Stock Screener
/ filtersresults — 100 row(s)
| Date | Ticker | Price | 52 Week | HLRng | Recom | Vol/Avg20d | Bandwidth/%B | RSI/Histogram | RS | MACD/Signal | Chart |
|---|---|---|---|---|---|---|---|---|---|---|---|
| 2026-07-17 | AAOI | 102.41 | / | 40.72% | none | 9,532,543/10,763,457 | 60.78/0.15 | 36.82/-1.9700 | 1.30 | -15.63/-13.65 | Chart 3M 🌐 |
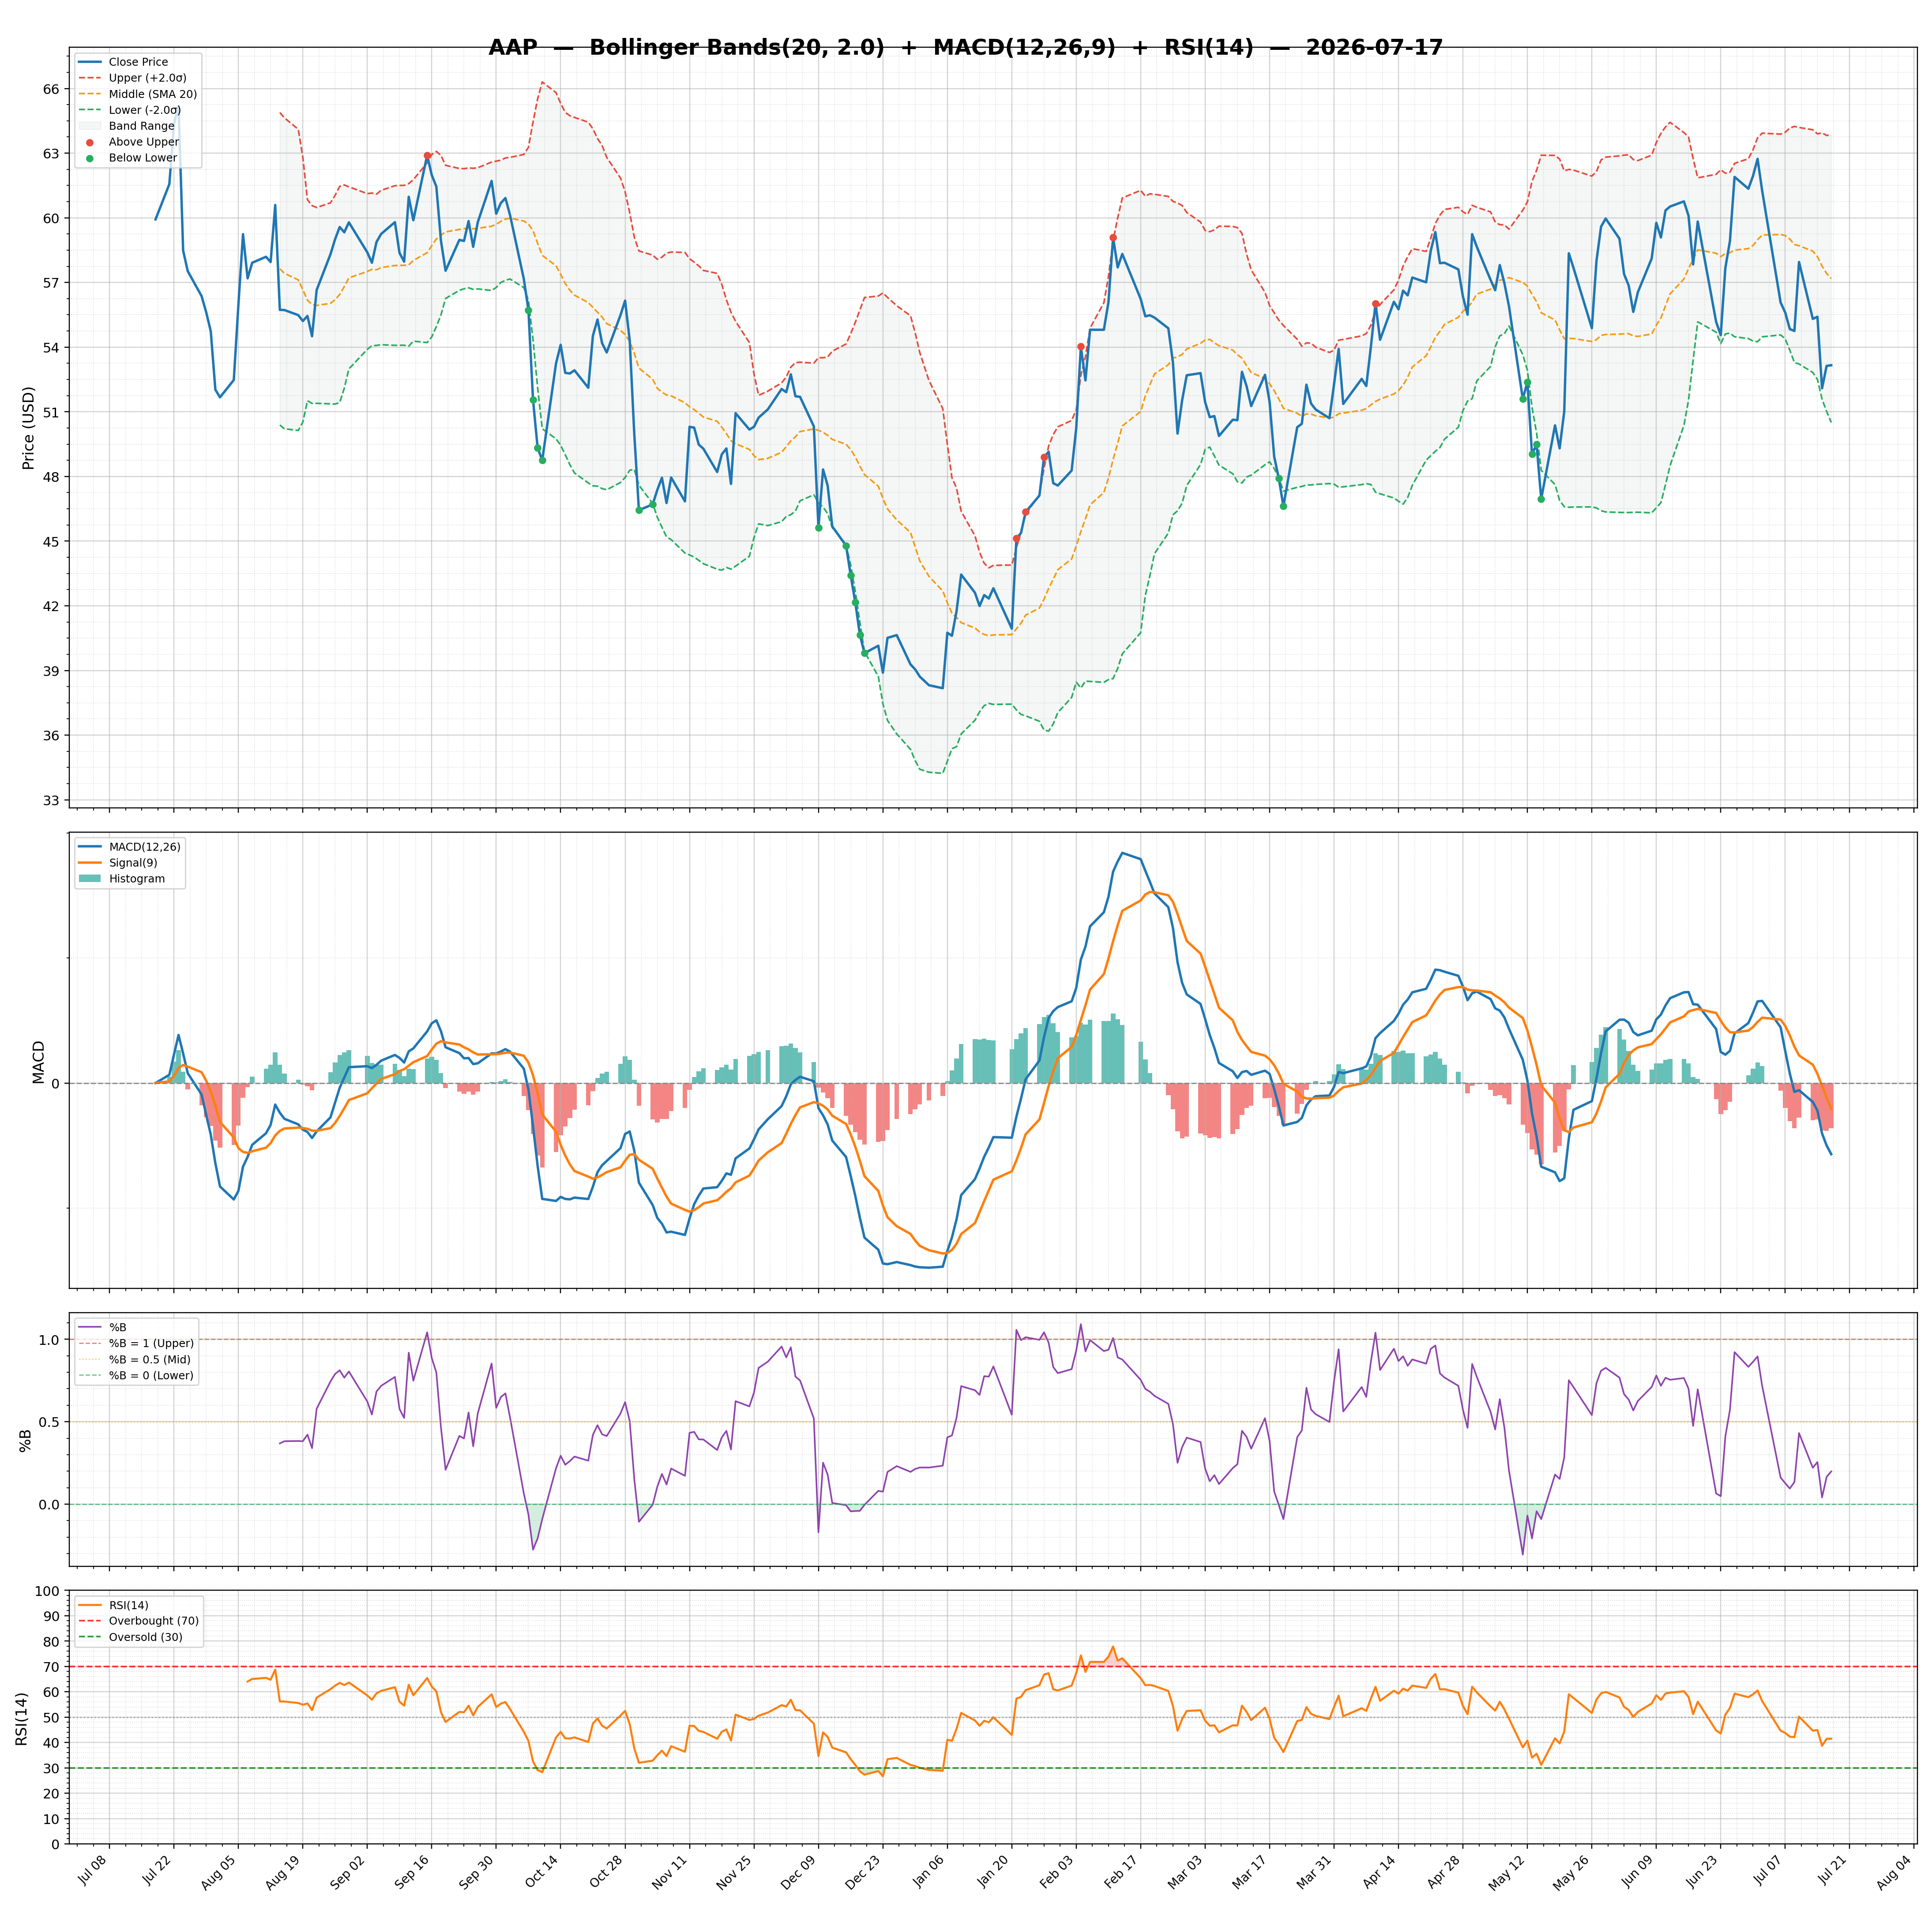
| 2026-07-17 | AAP | 53.16 | / | 55.46% | hold | 1,193,833/1,850,682 | 23.35/0.20 | 41.51/-0.7200 | 0.00 | -1.14/-0.42 | Chart 3M 🌐 |
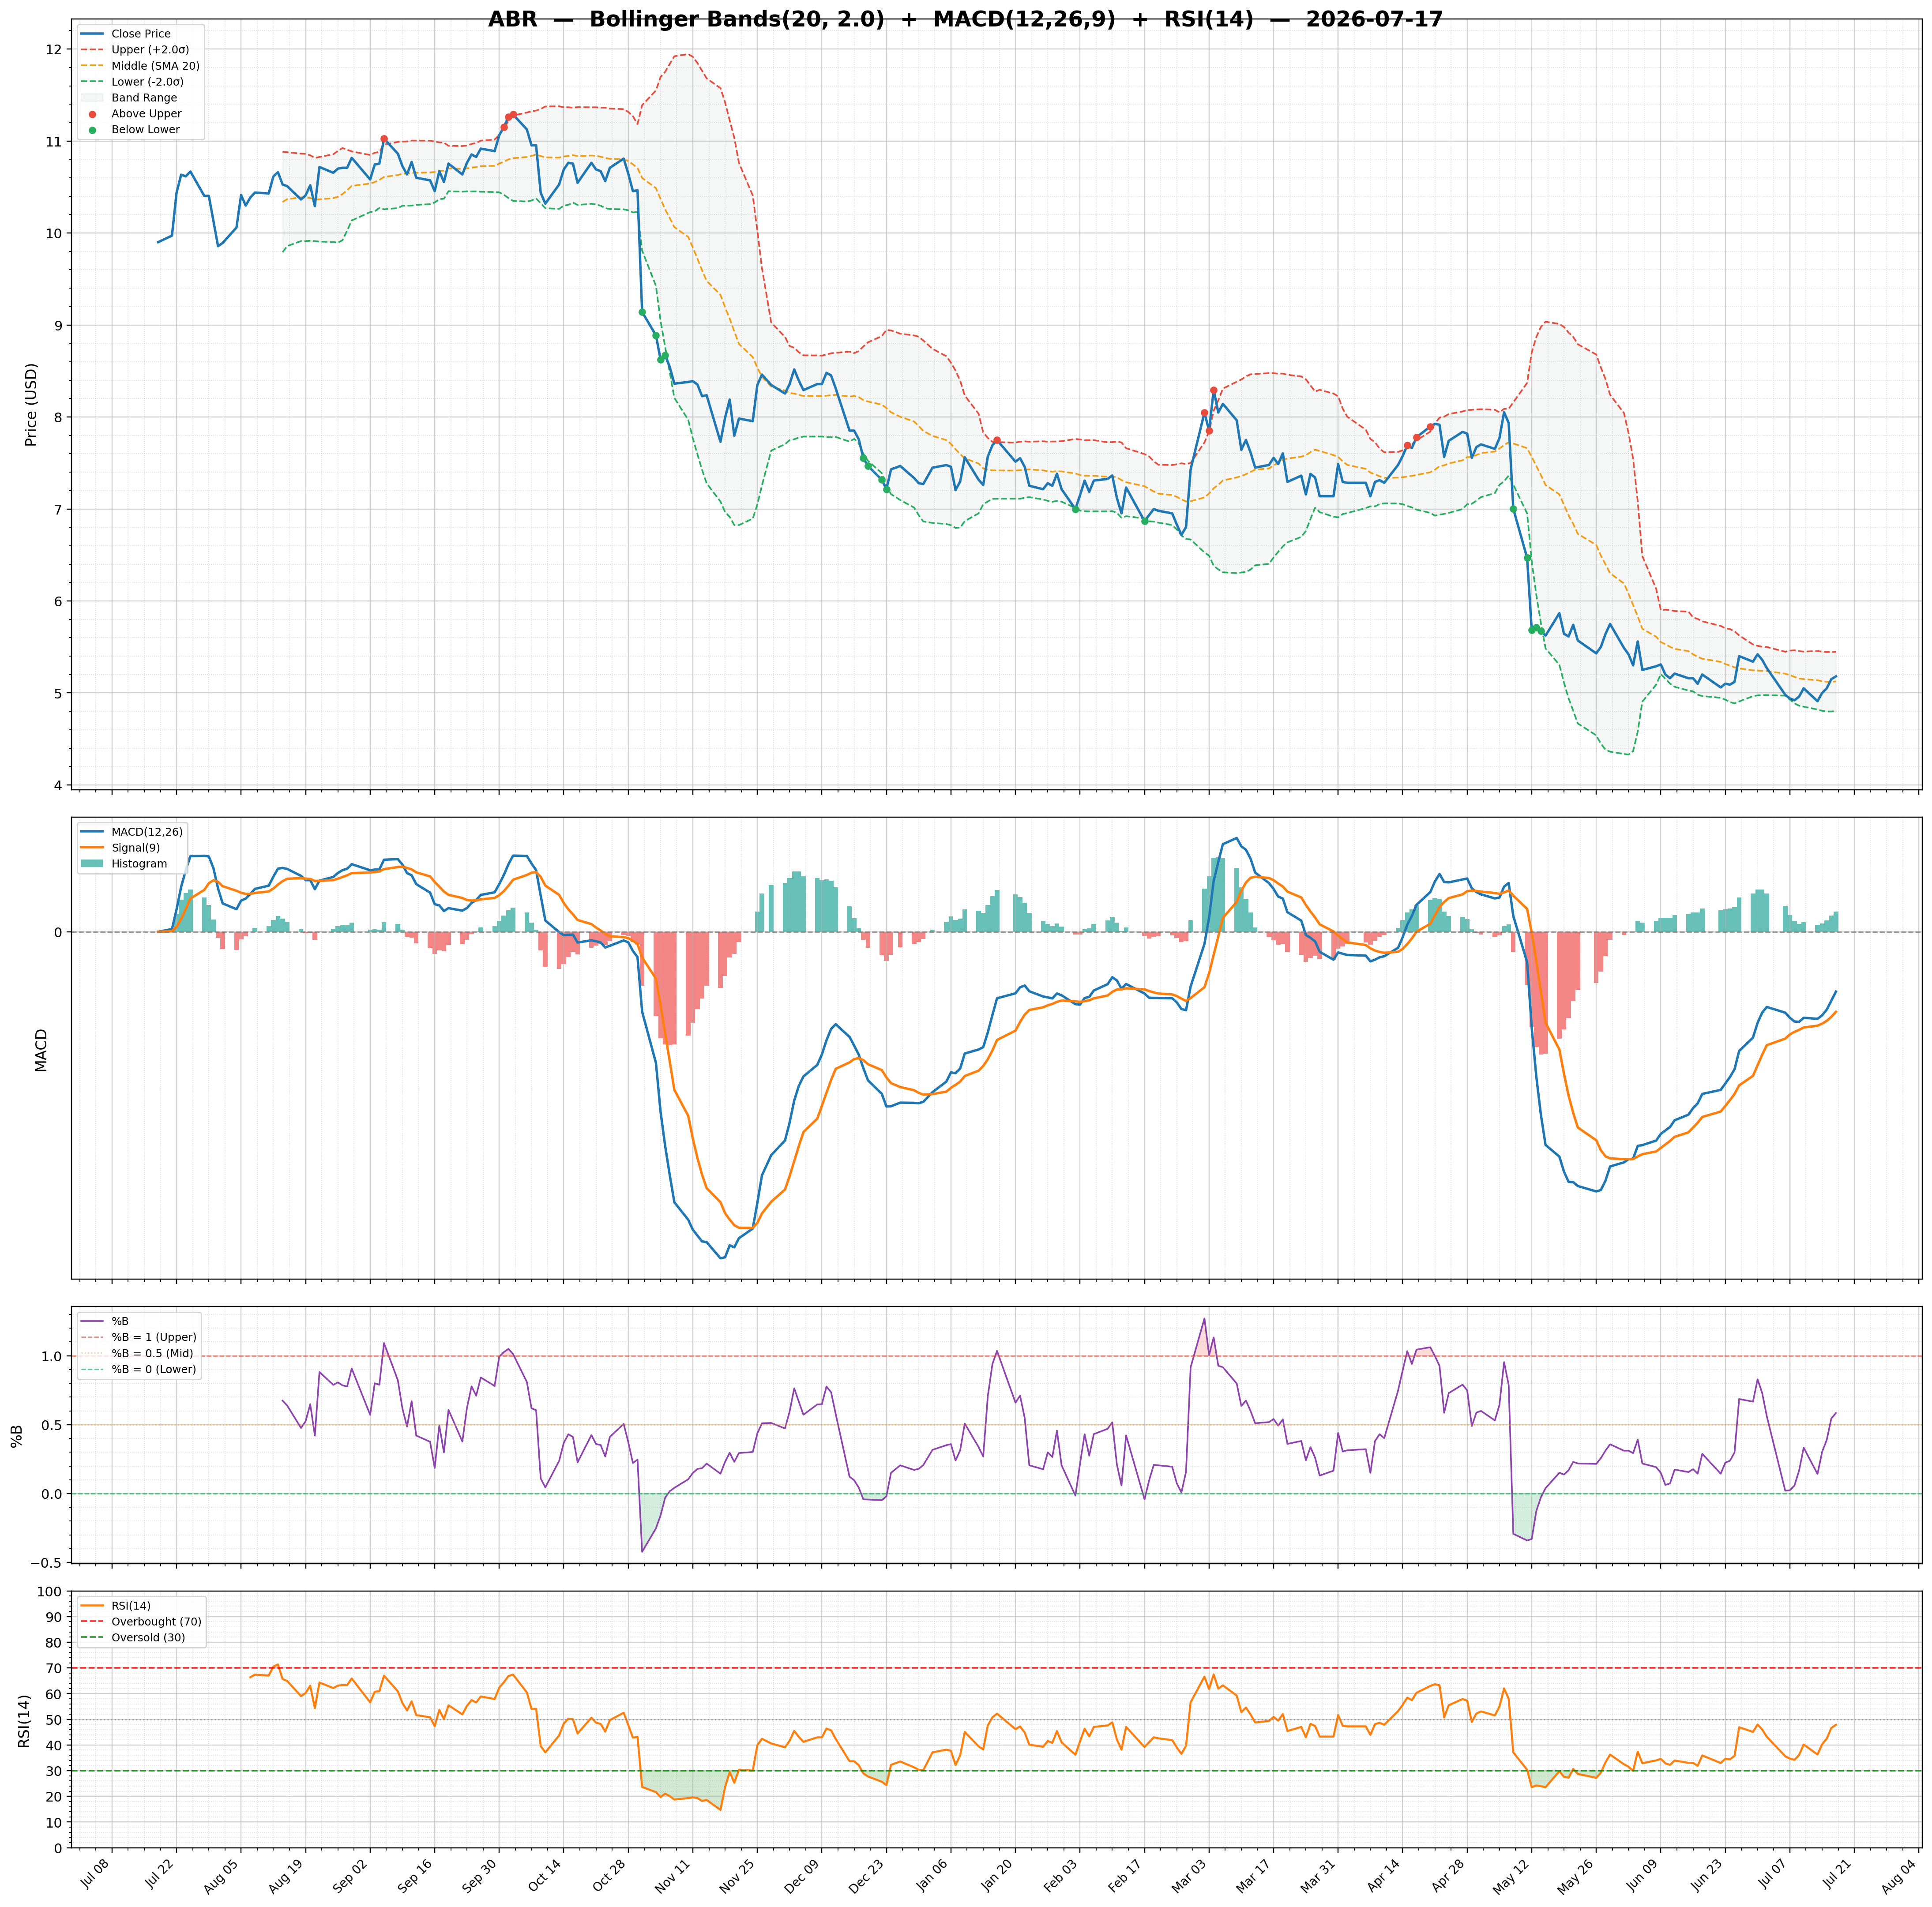
| 2026-07-17 | ABR | 5.18 | / | 4.23% | hold | 2,759,763/3,983,313 | 12.64/0.58 | 47.86/0.0400 | -0.39 | -0.13/-0.17 | Chart 3M 🌐 |
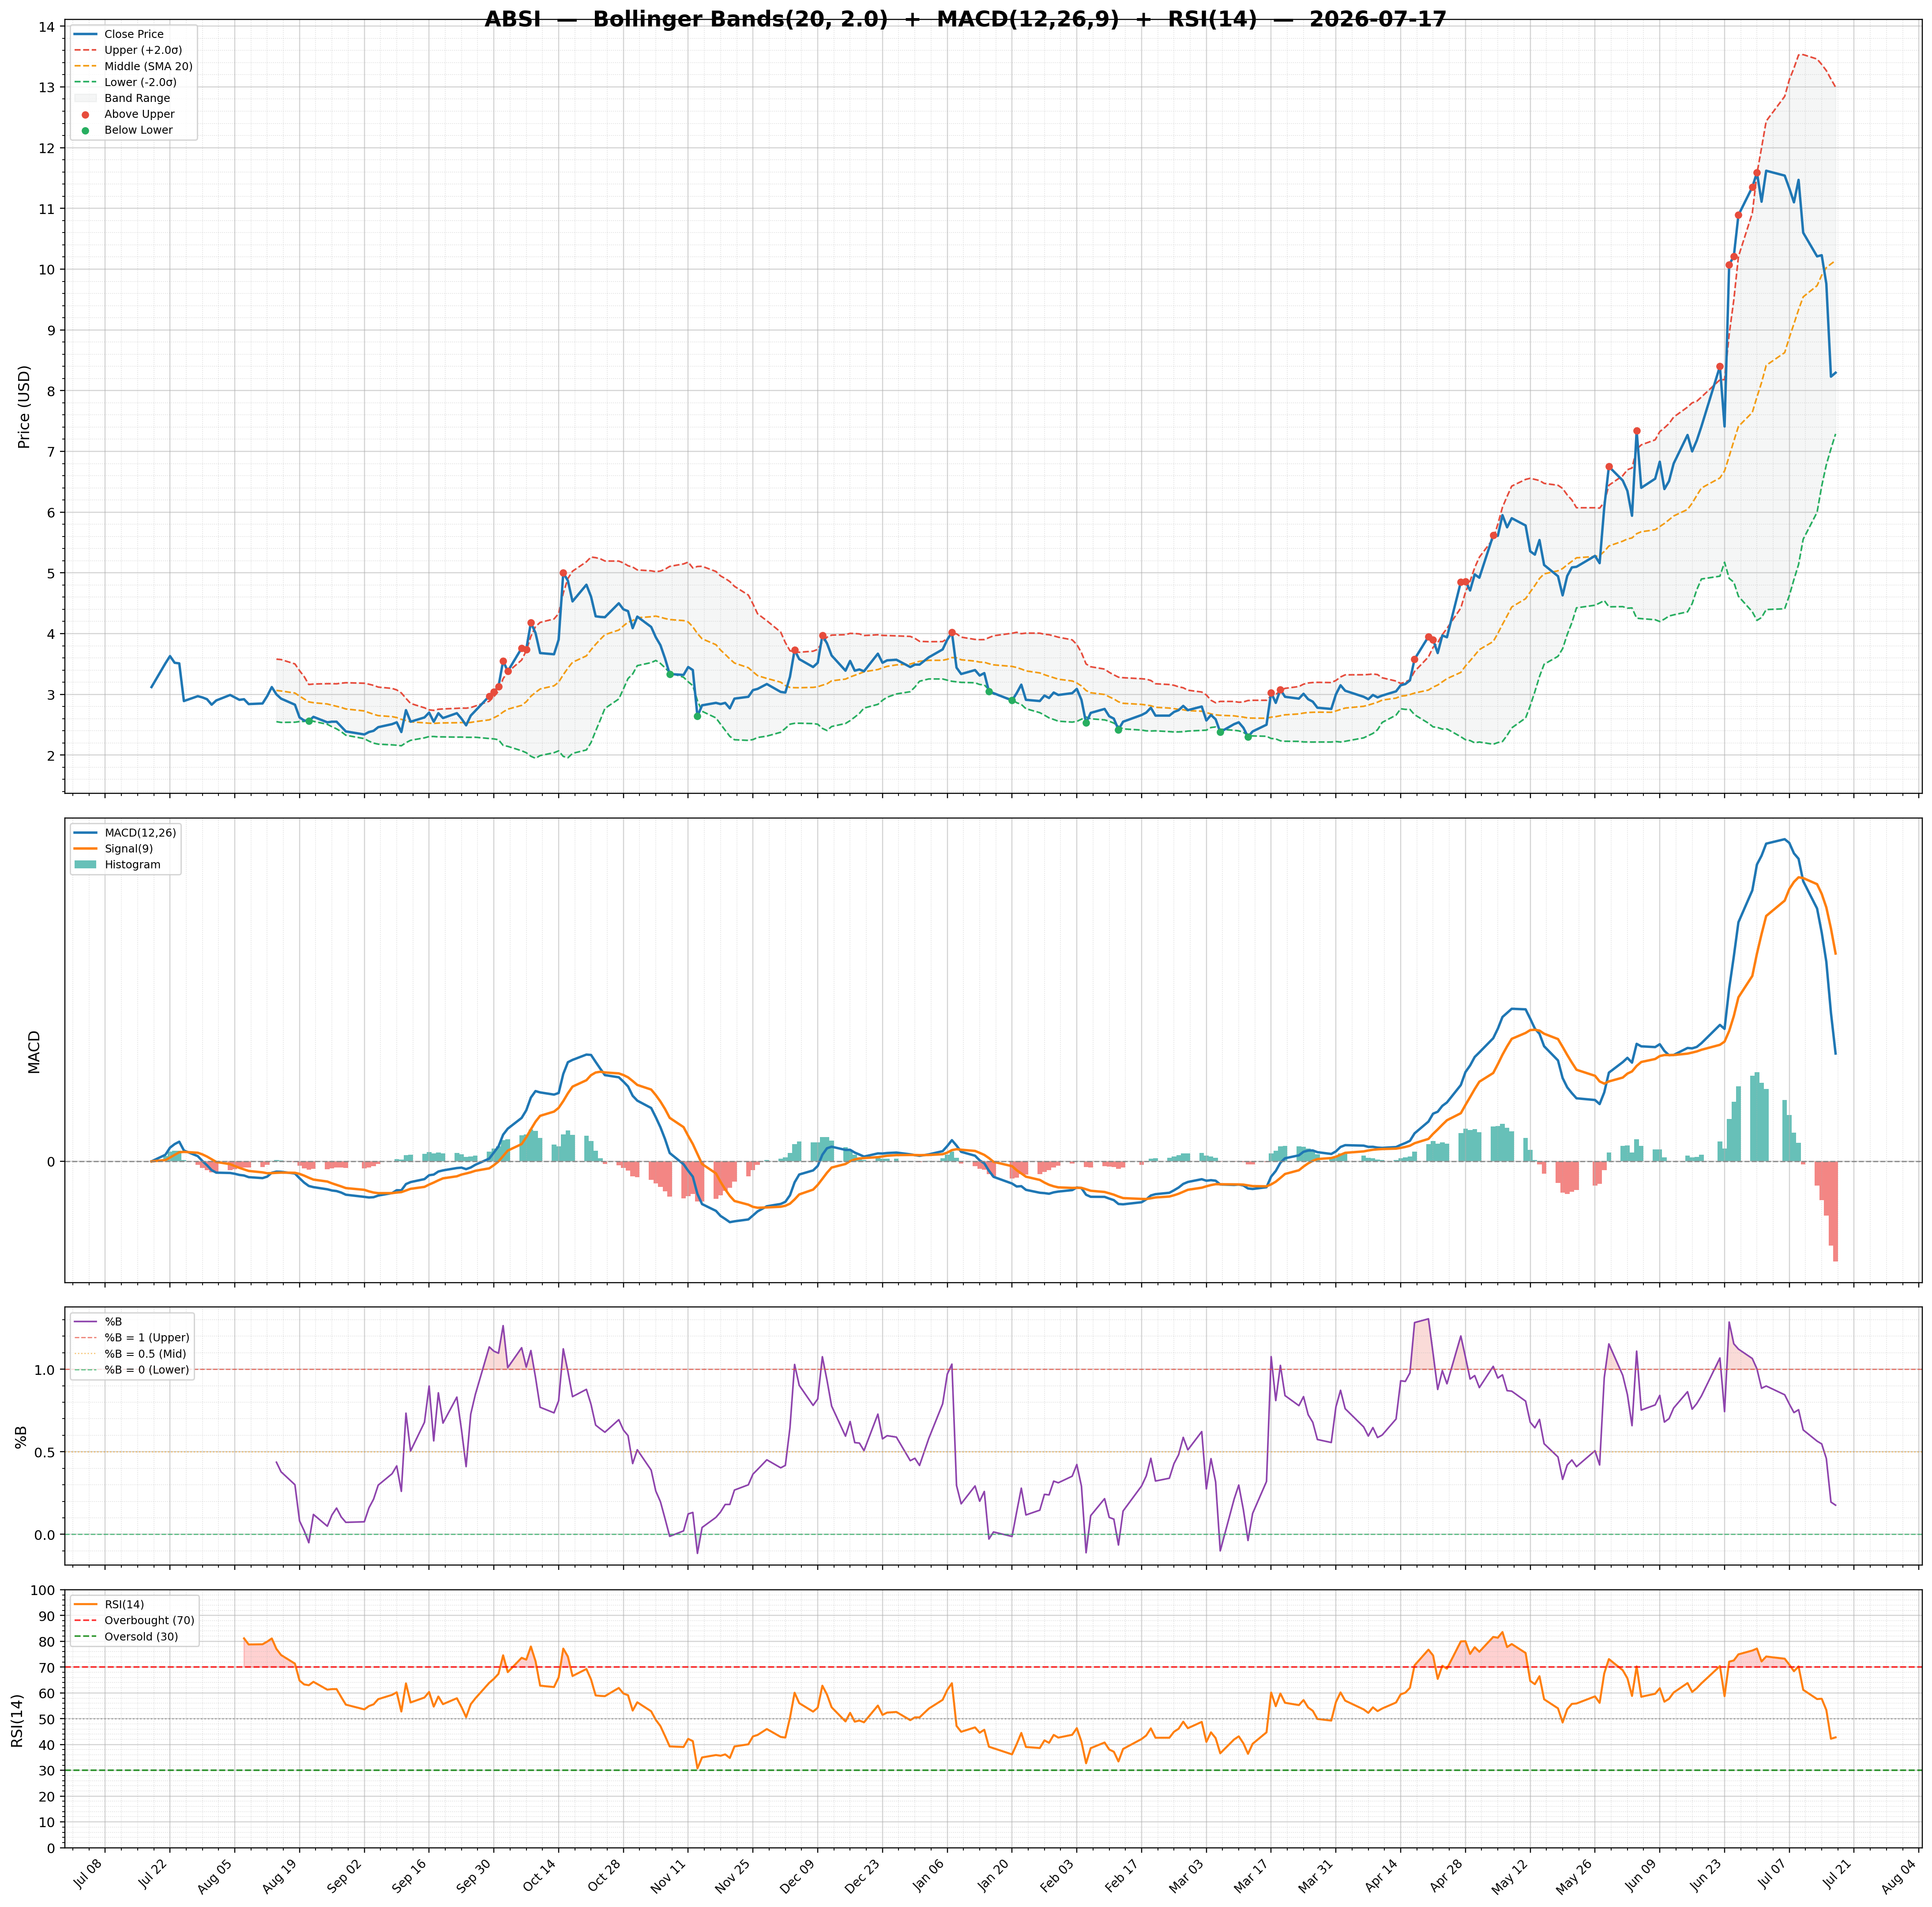
| 2026-07-17 | ABSI | 8.30 | / | 64.32% | strong_buy | 3,714,815/7,935,071 | 56.28/0.18 | 42.78/-0.4700 | 1.42 | 0.51/0.98 | Chart 3M 🌐 |
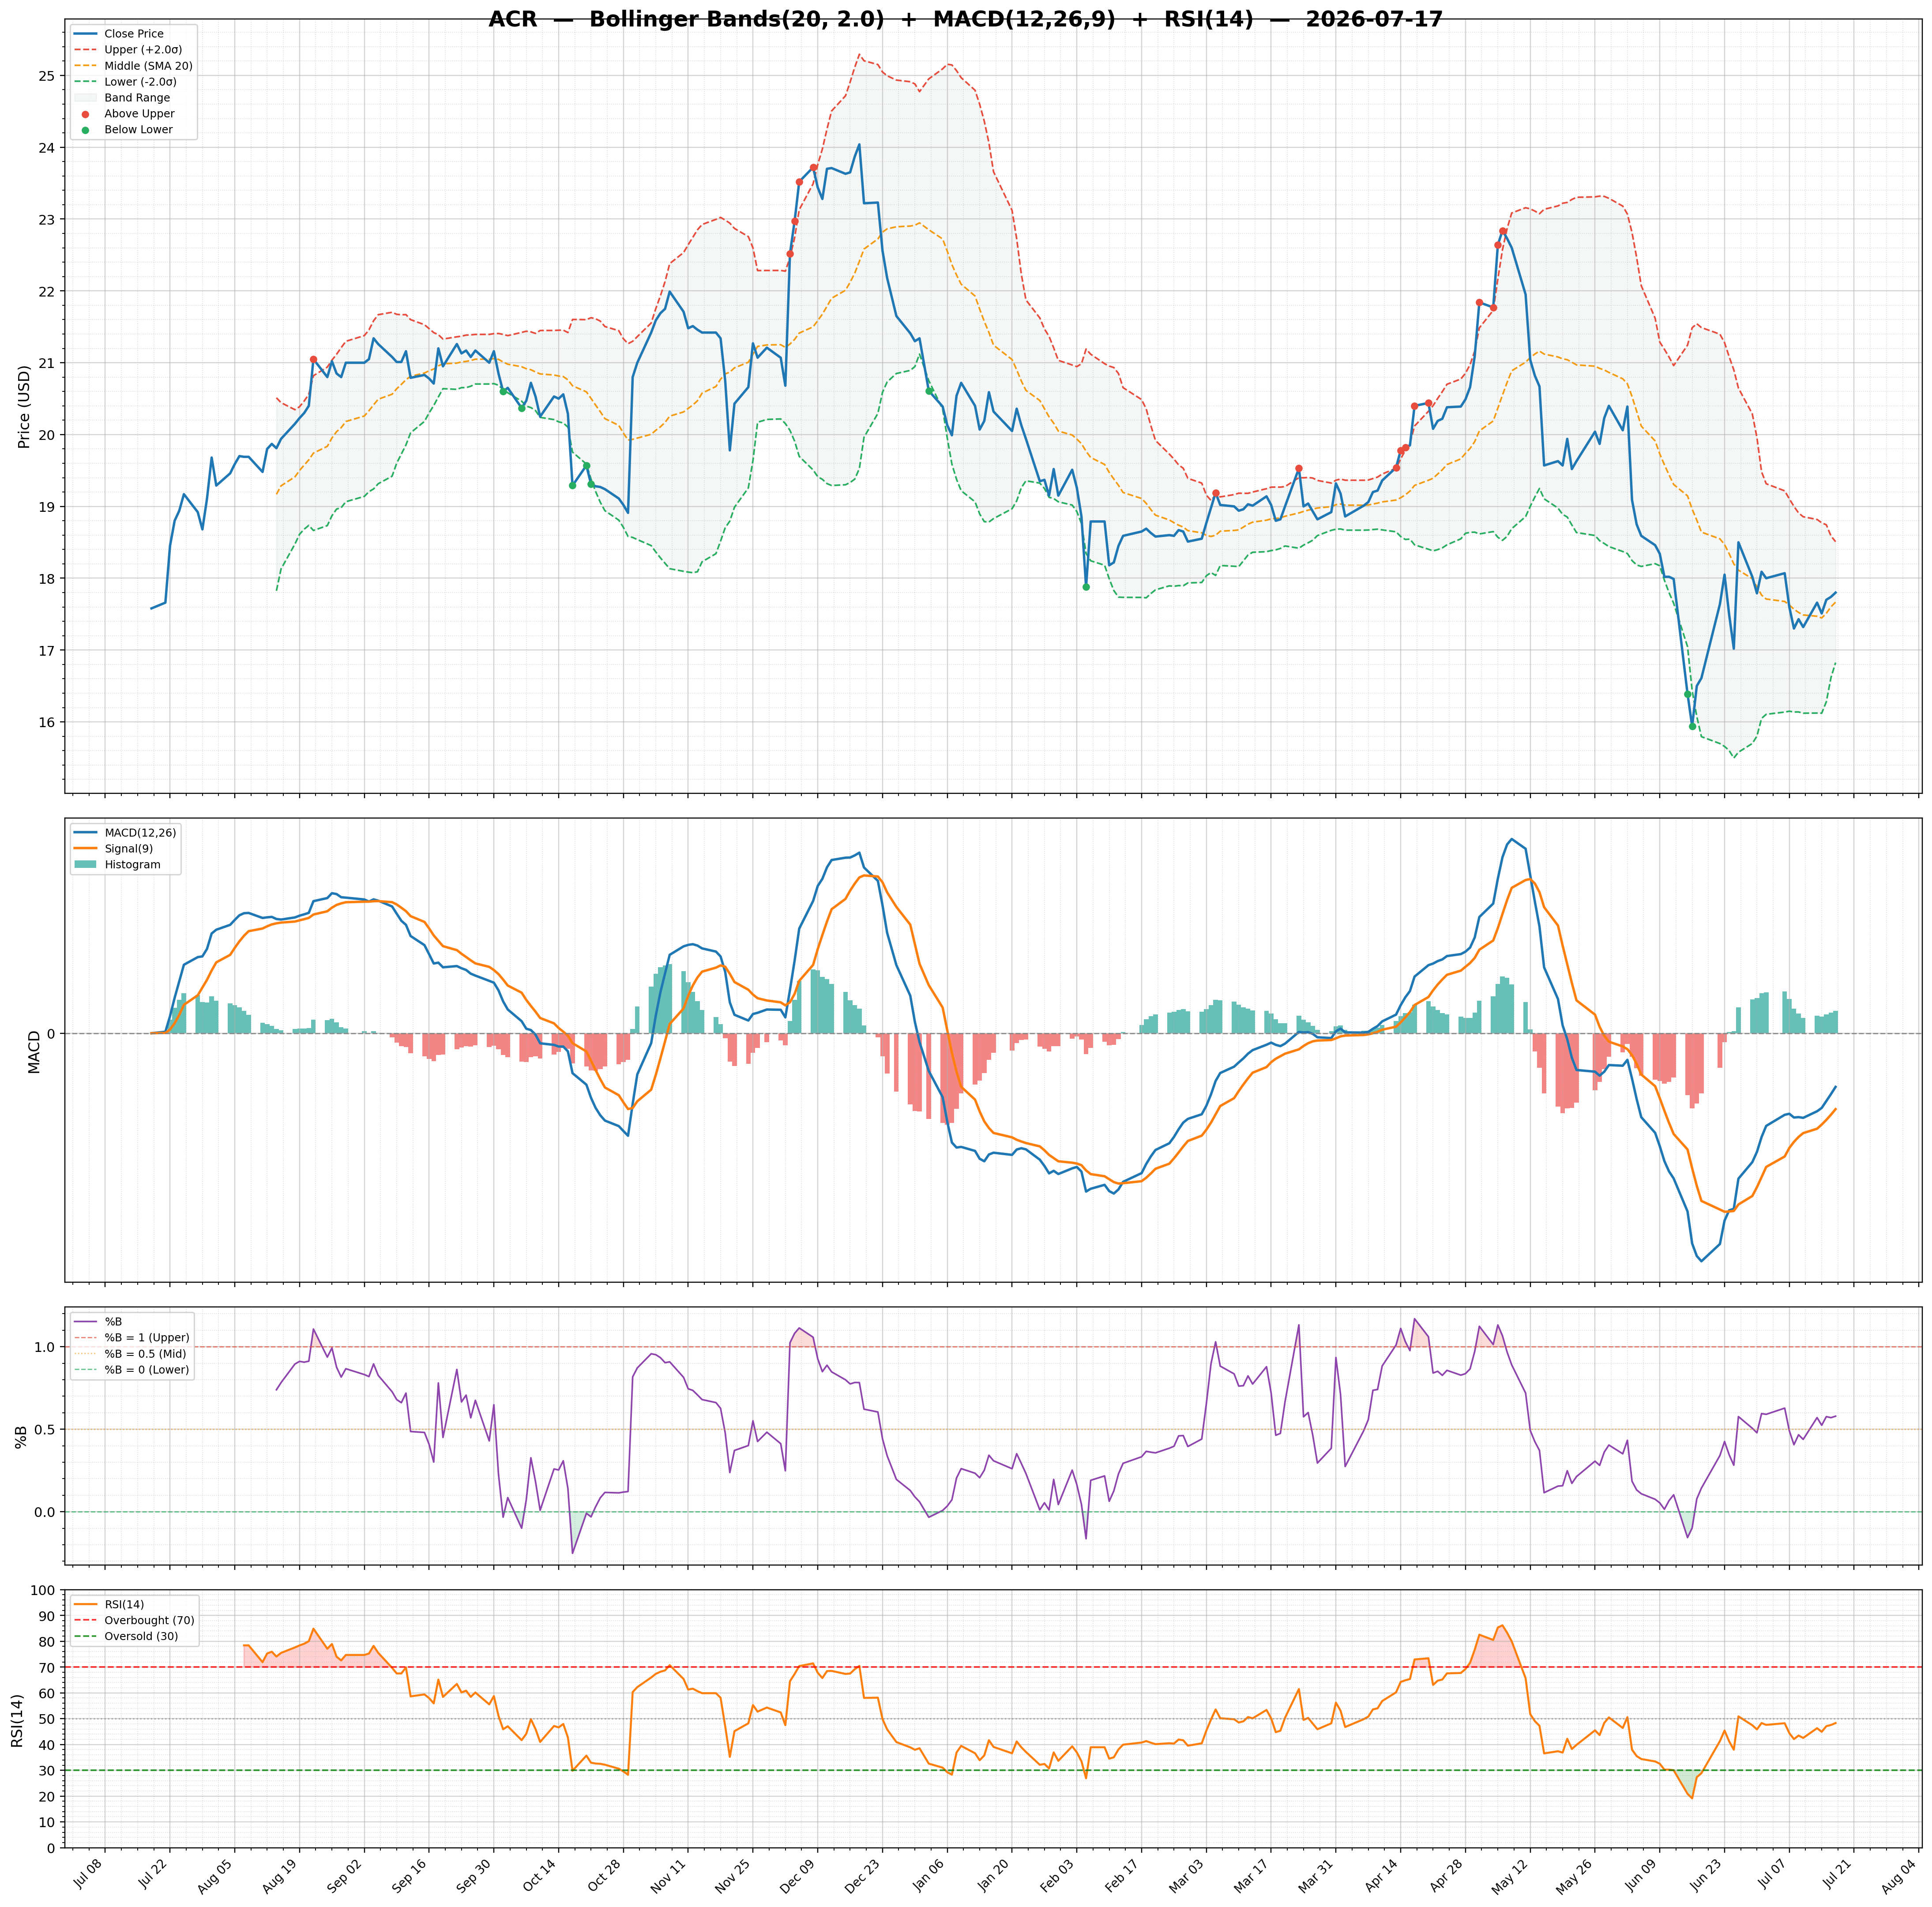
| 2026-07-17 | ACR | 17.80 | / | 22.96% | none | 15,795/40,920 | 9.53/0.58 | 48.31/0.1000 | -0.09 | -0.24/-0.33 | Chart 3M 🌐 |
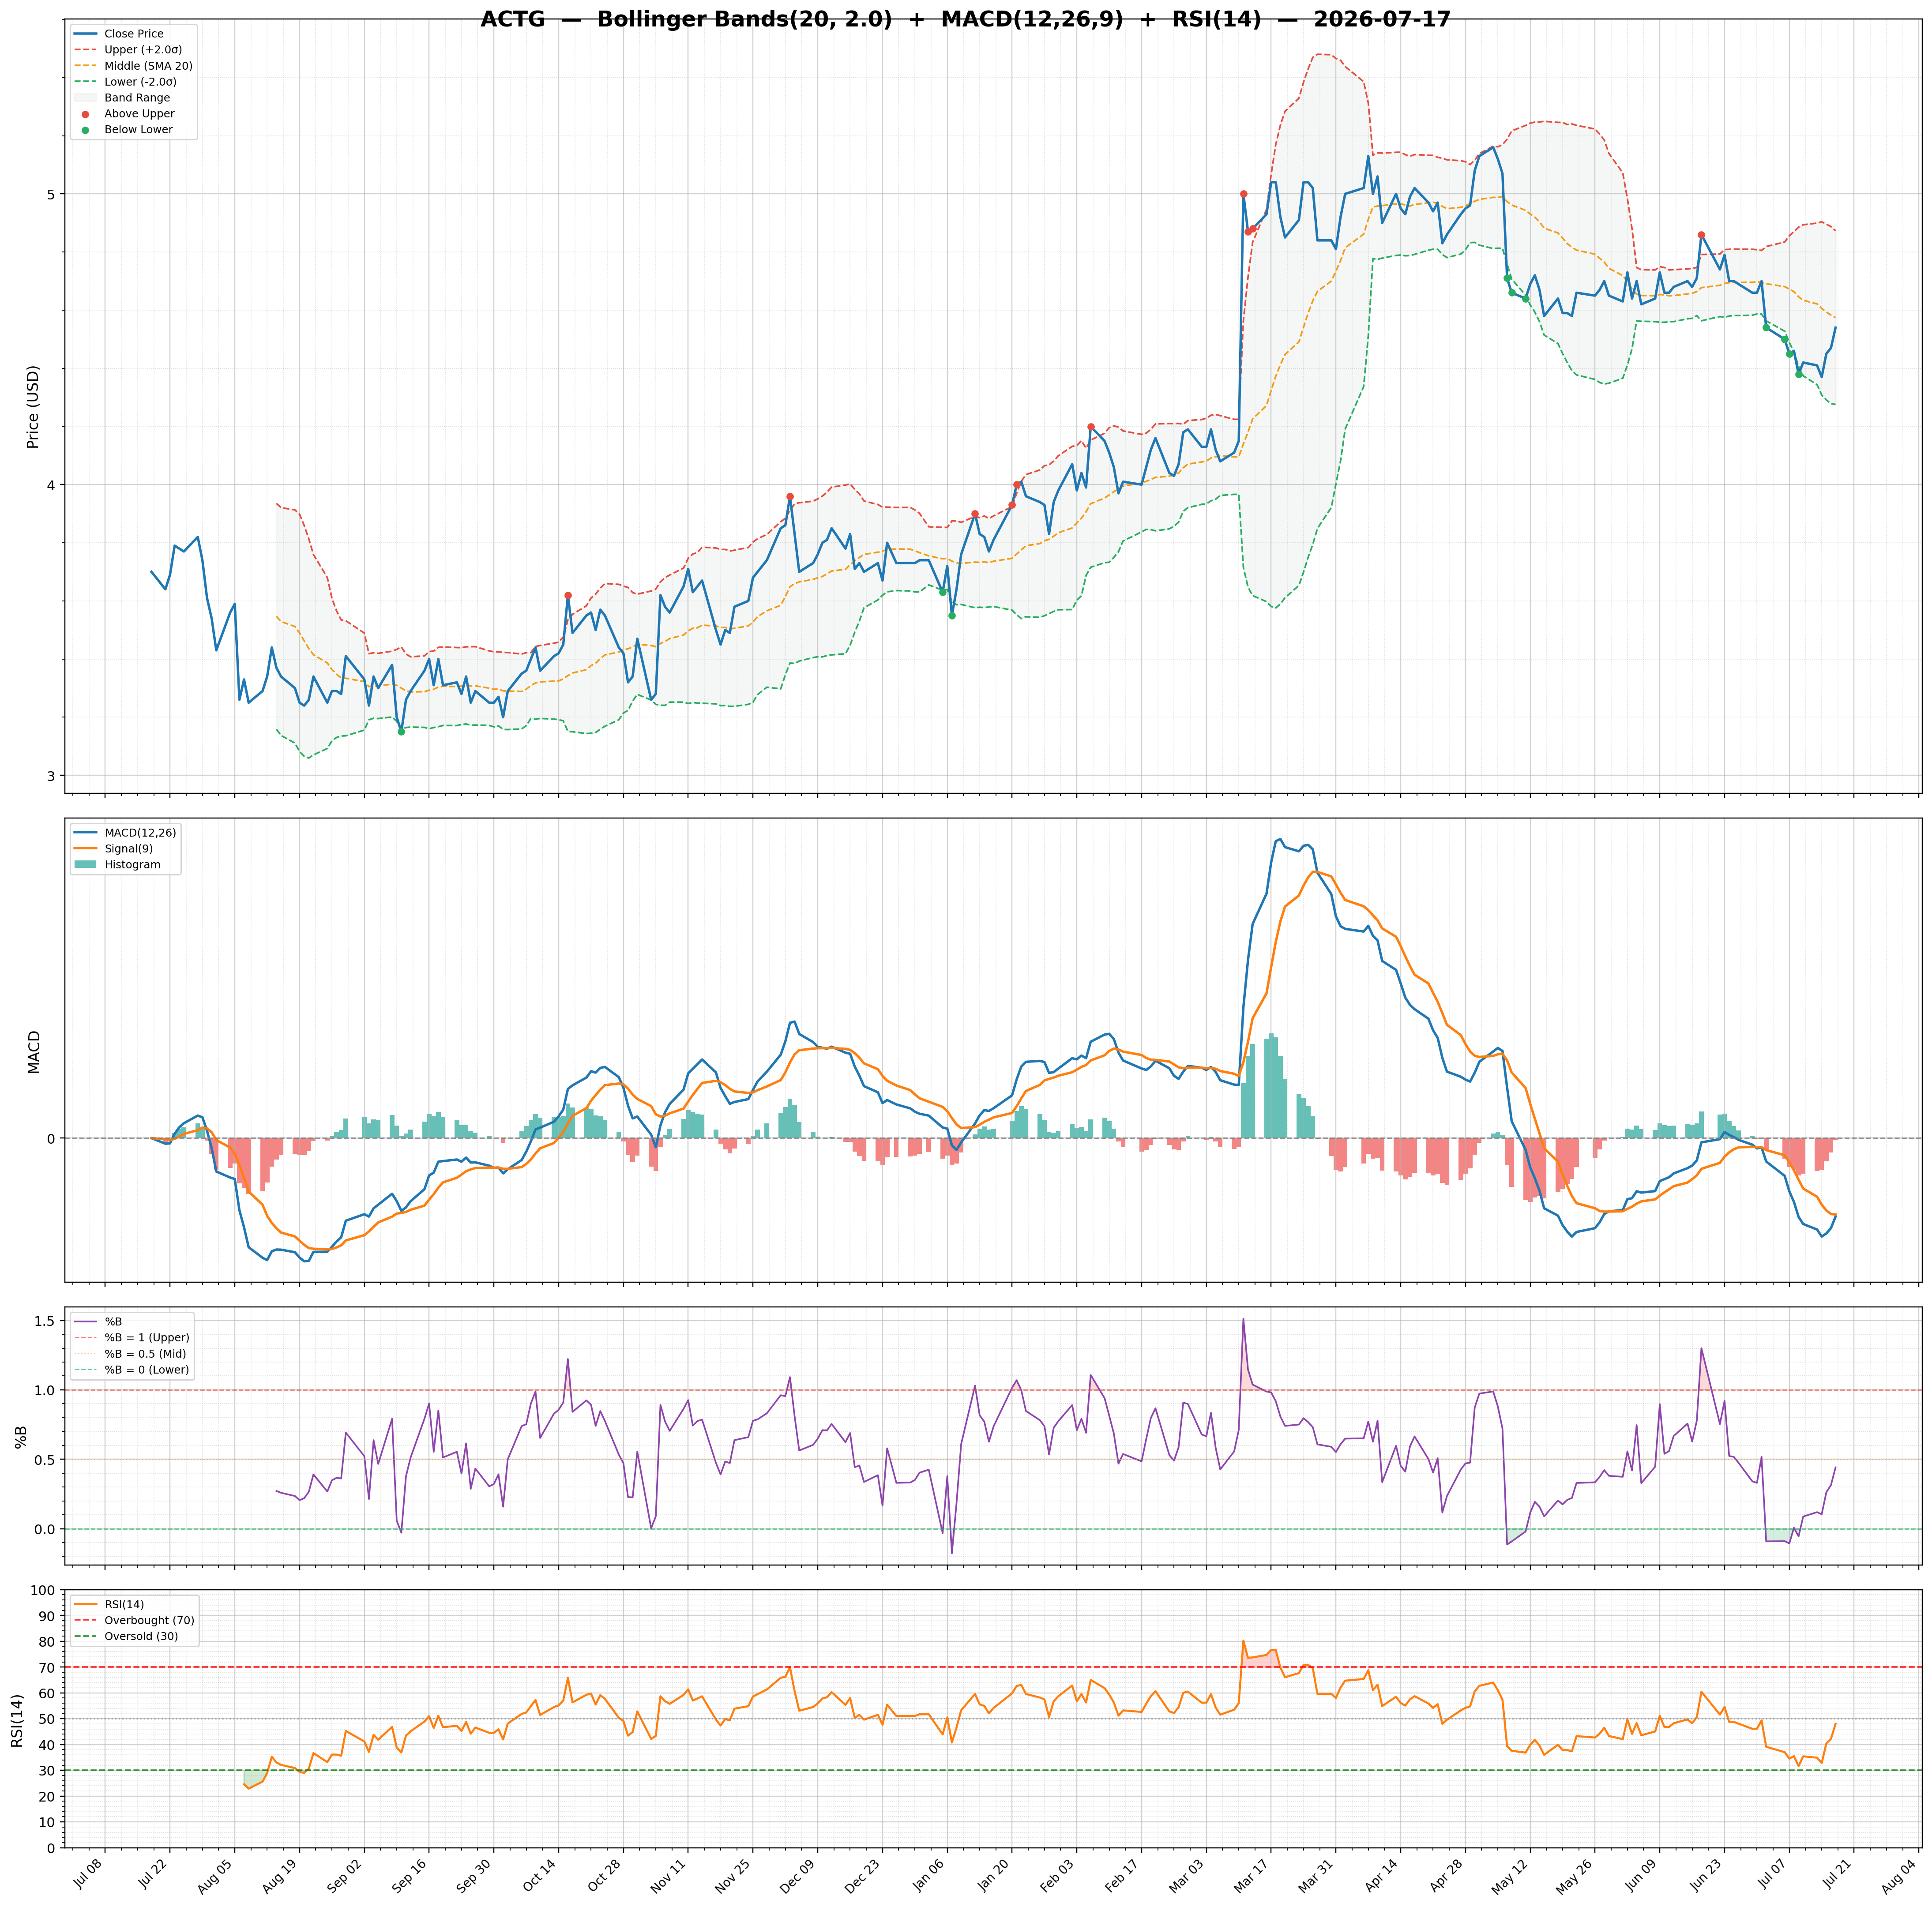
| 2026-07-17 | ACTG | 4.54 | / | 69.15% | none | 292,193/274,800 | 13.06/0.44 | 48.01/-0.0000 | 0.12 | -0.07/-0.07 | Chart 3M 🌐 |
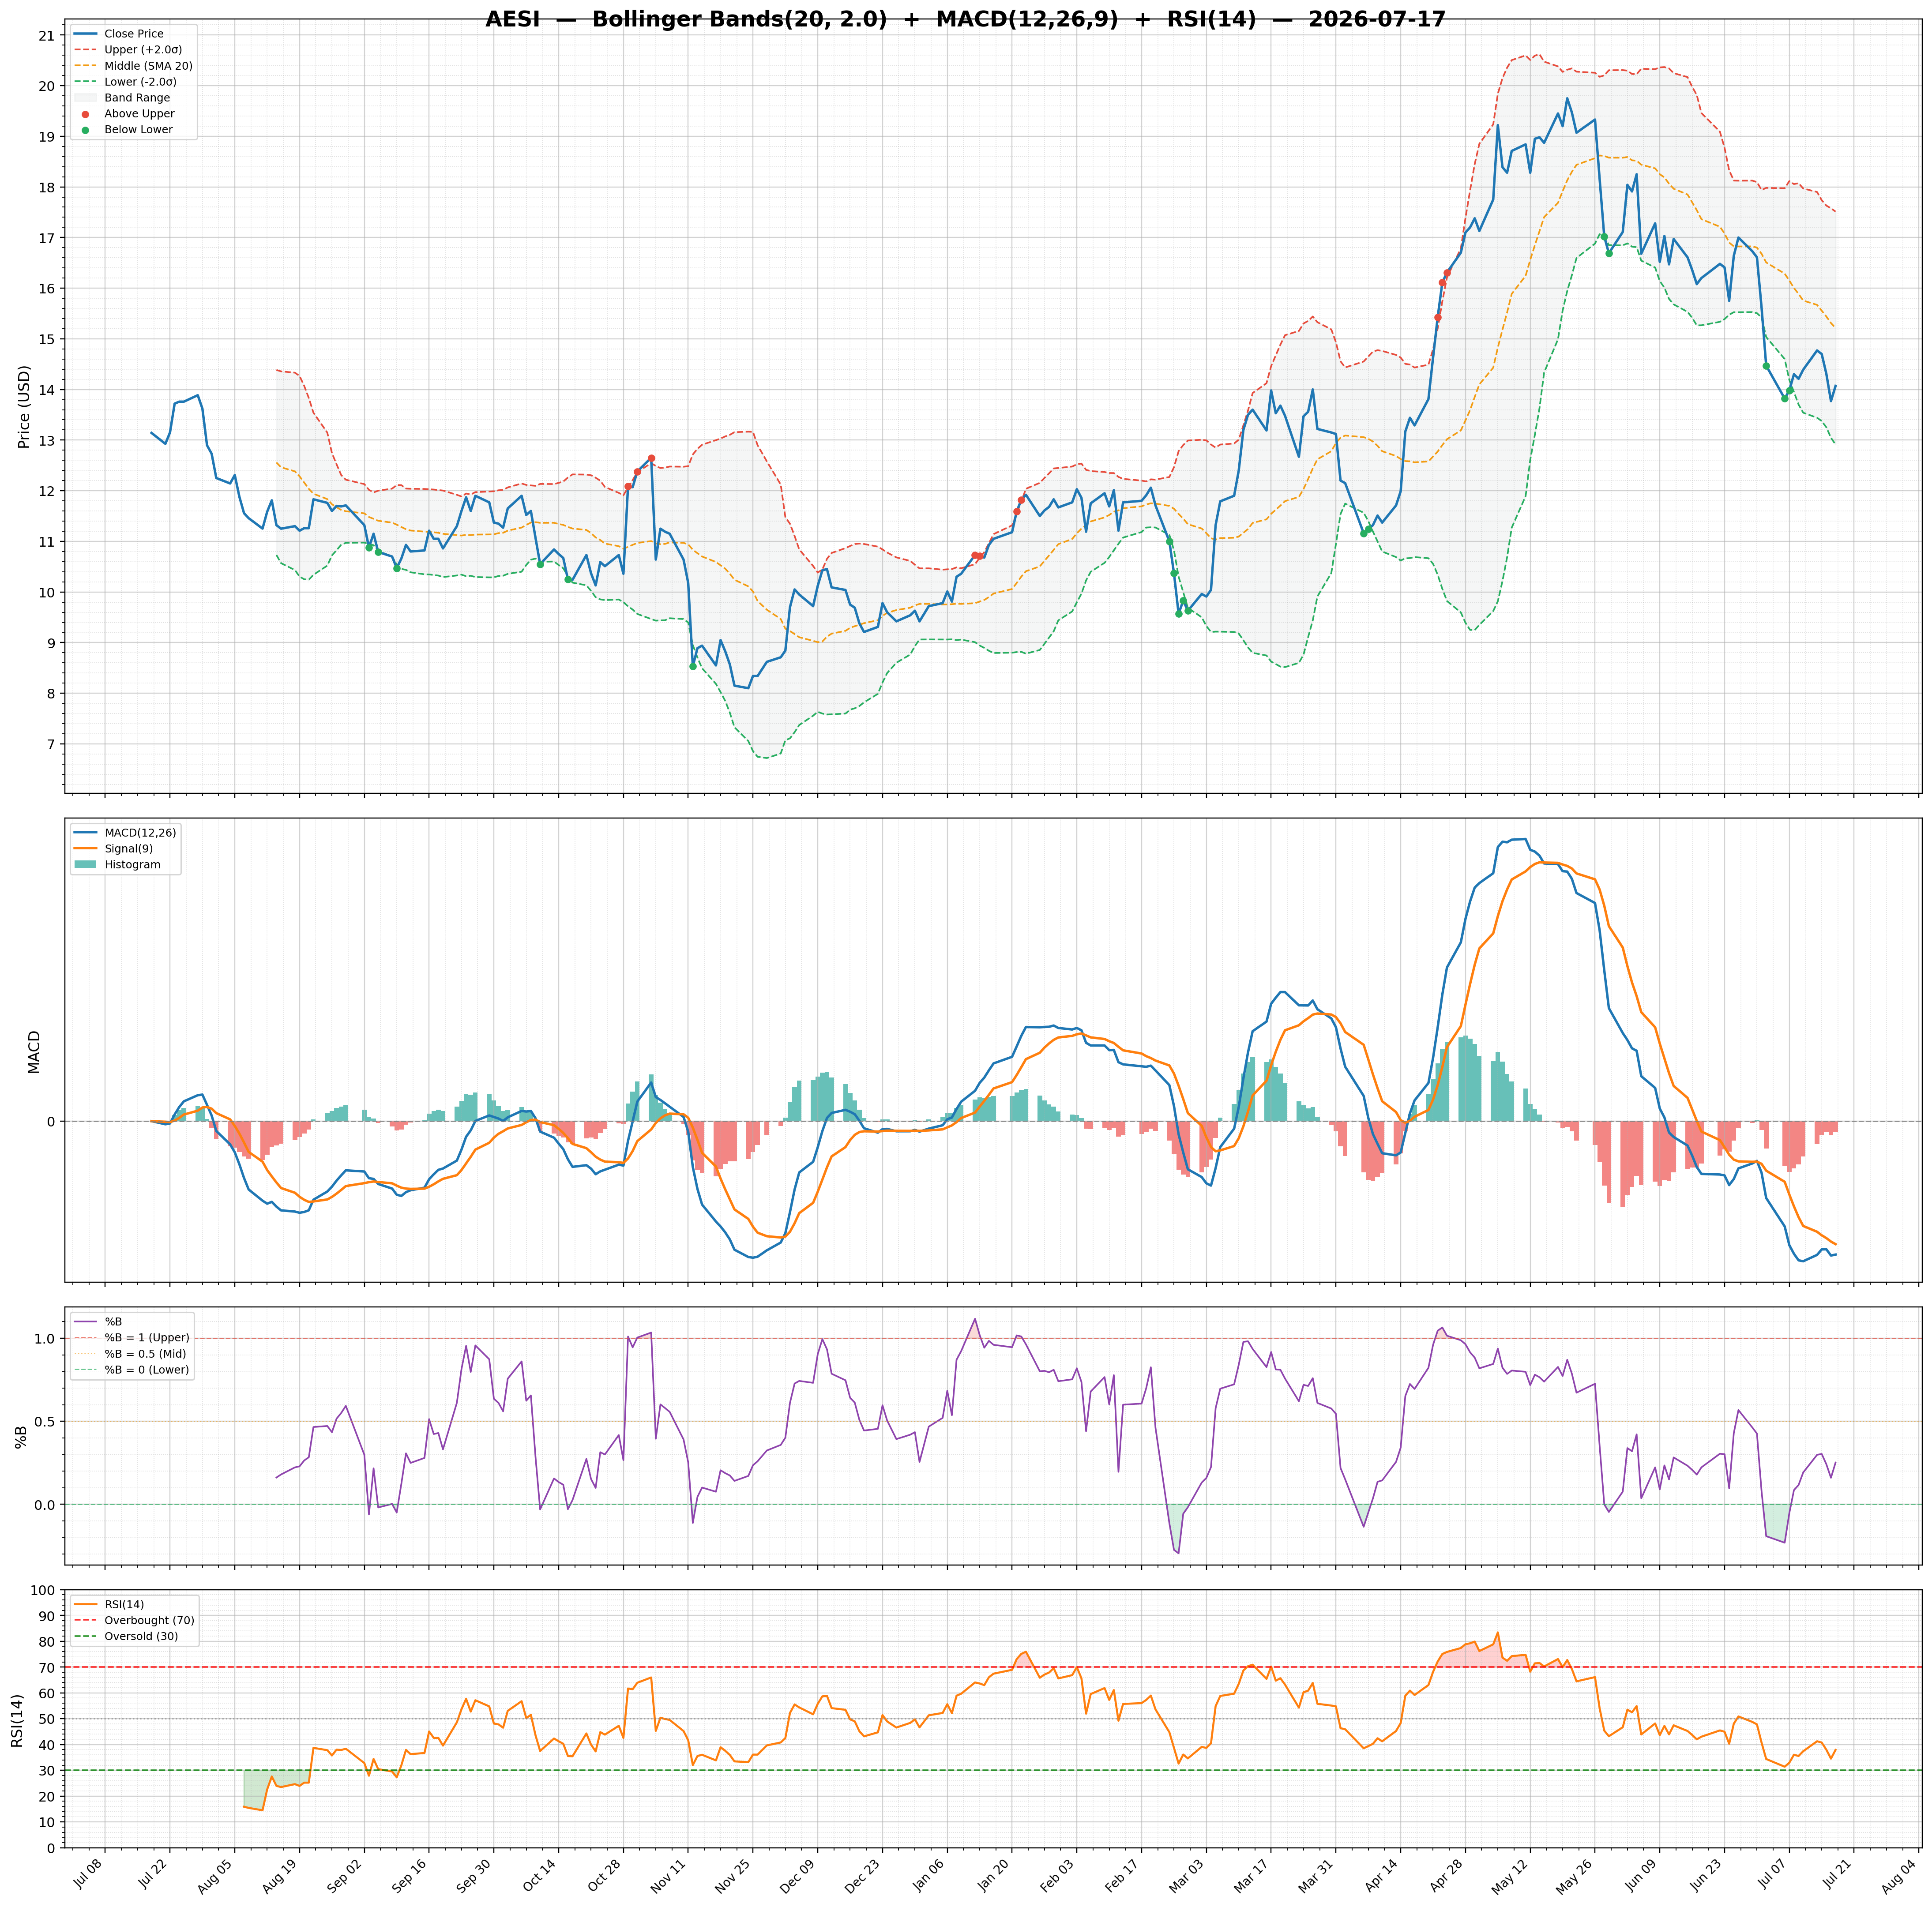
| 2026-07-17 | AESI | 14.07 | / | 51.24% | buy | 3,120,303/2,837,320 | 30.25/0.25 | 37.92/-0.0600 | 0.16 | -0.74/-0.68 | Chart 3M 🌐 |
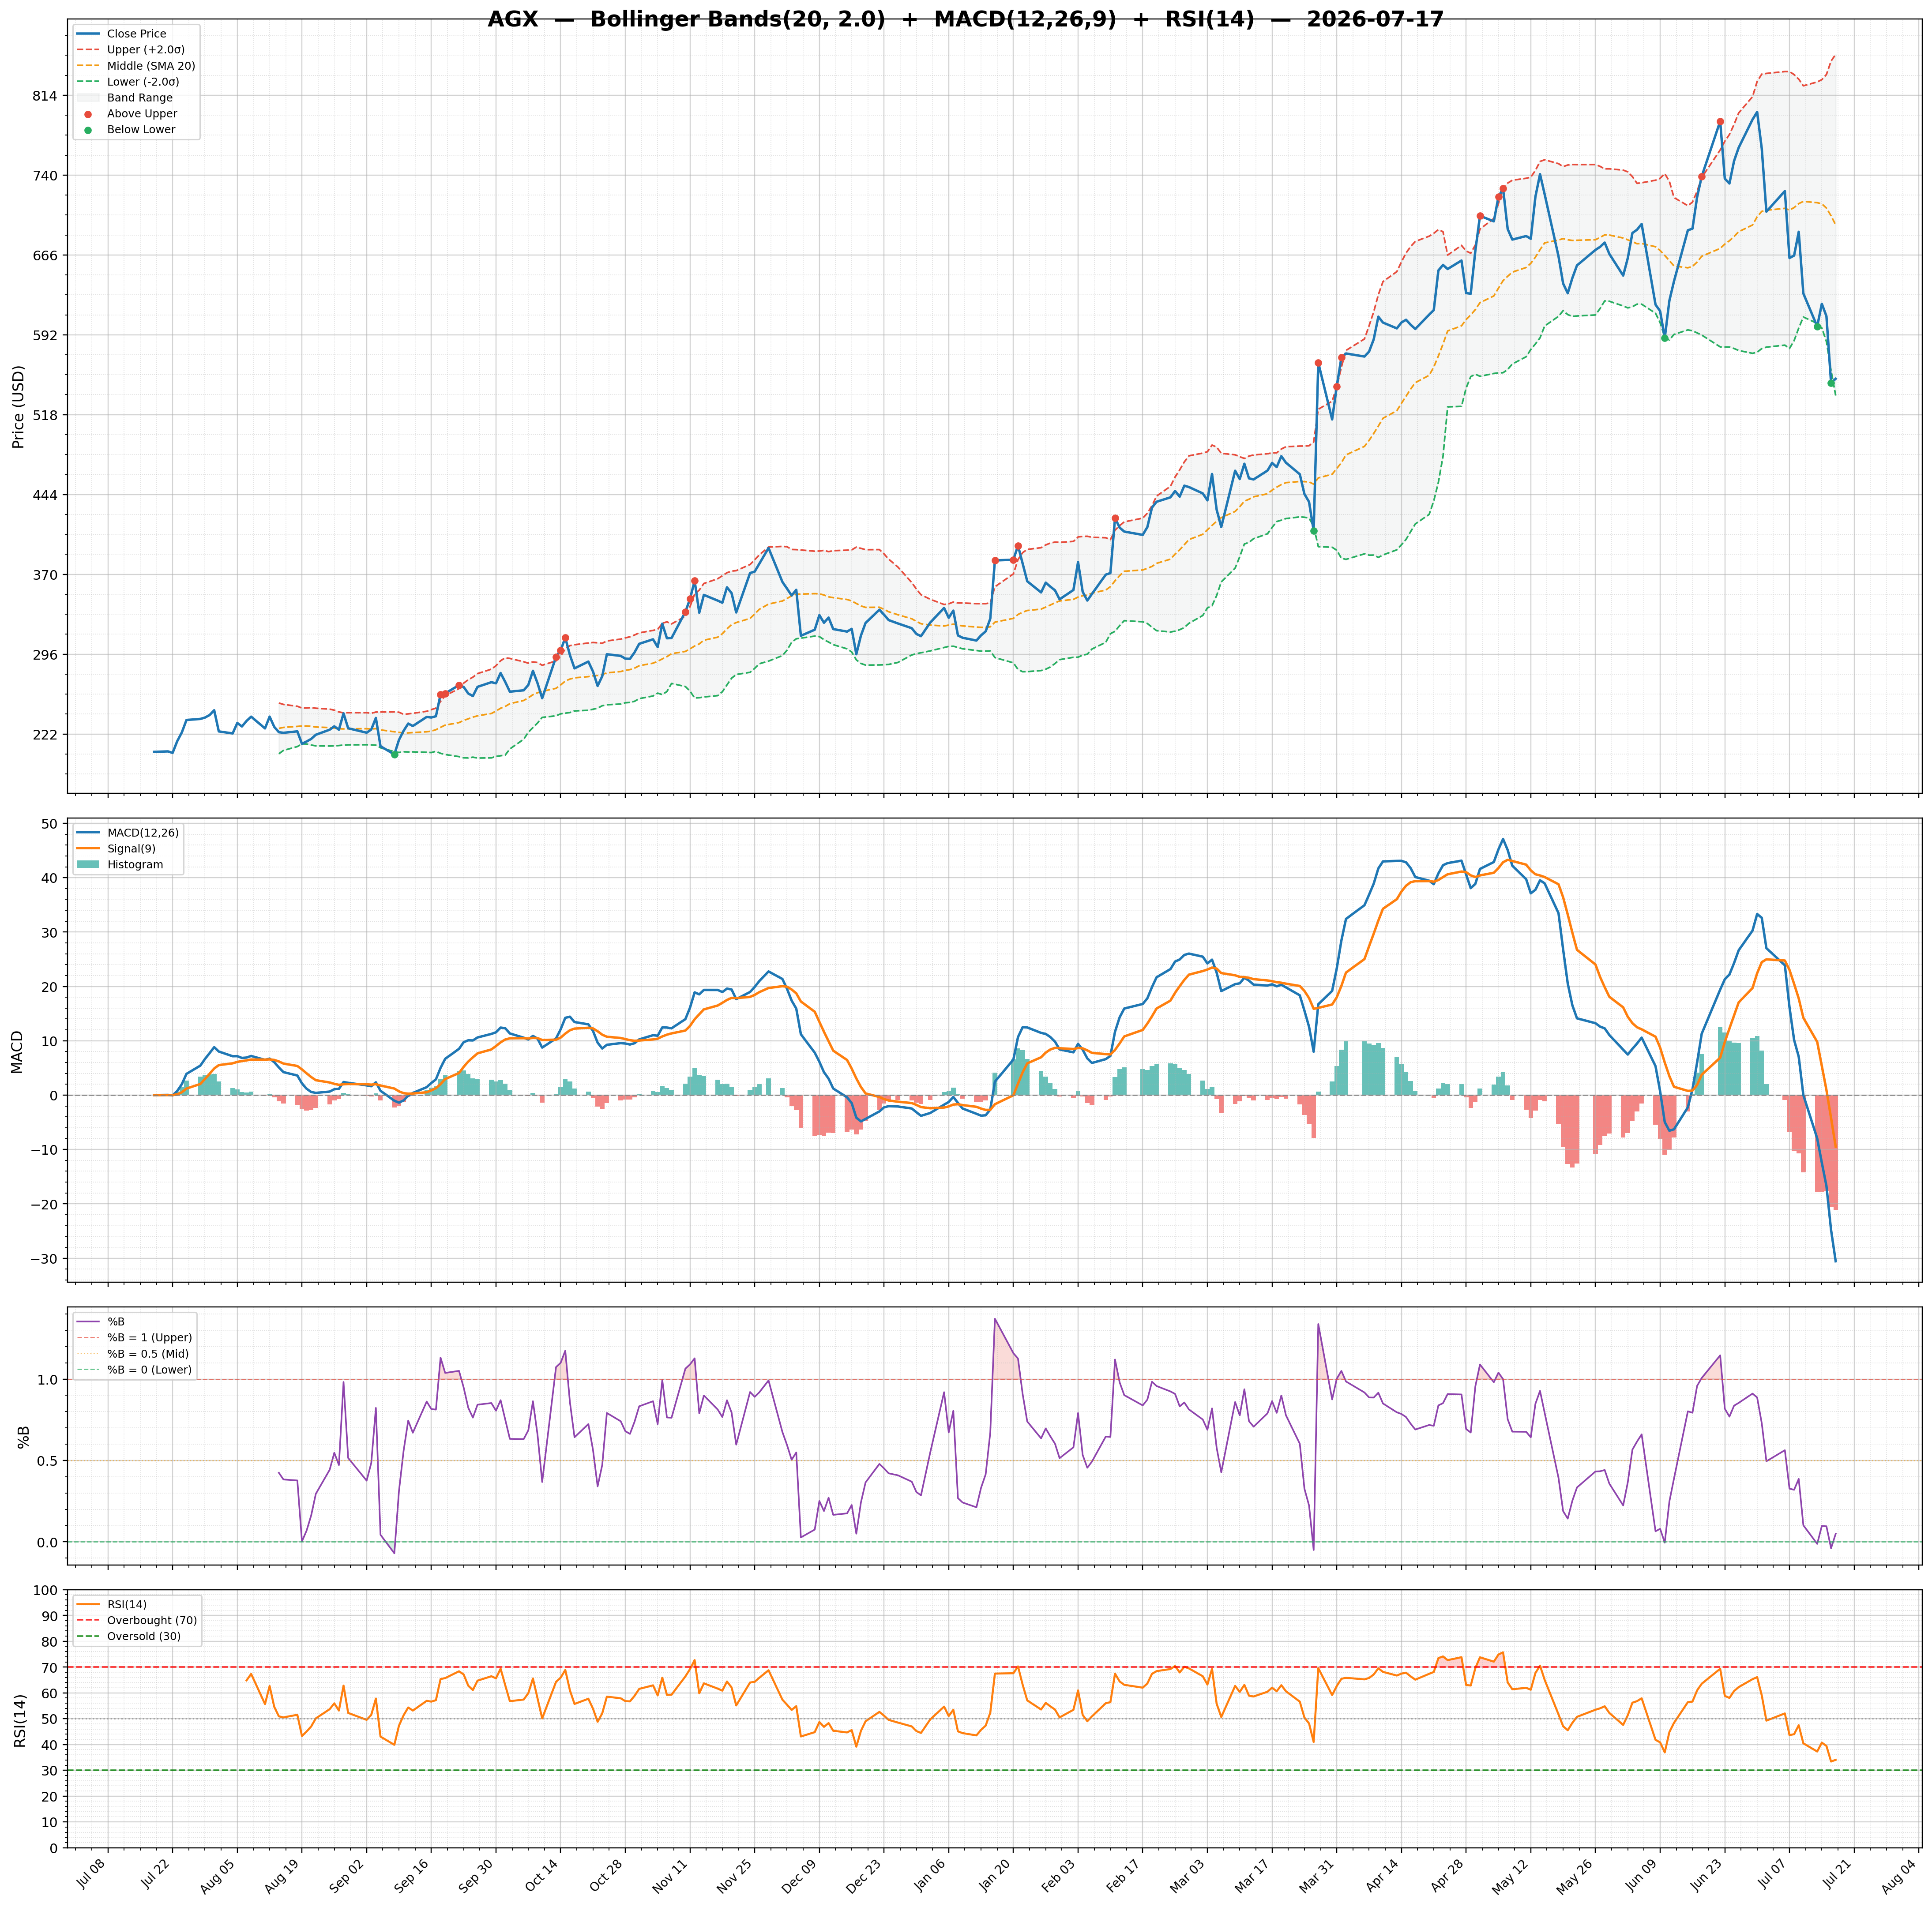
| 2026-07-17 | AGX | 551.26 | / | 58.47% | none | 728,863/345,793 | 45.58/0.05 | 34.06/-21.0800 | 0.62 | -30.57/-9.49 | Chart 3M 🌐 |
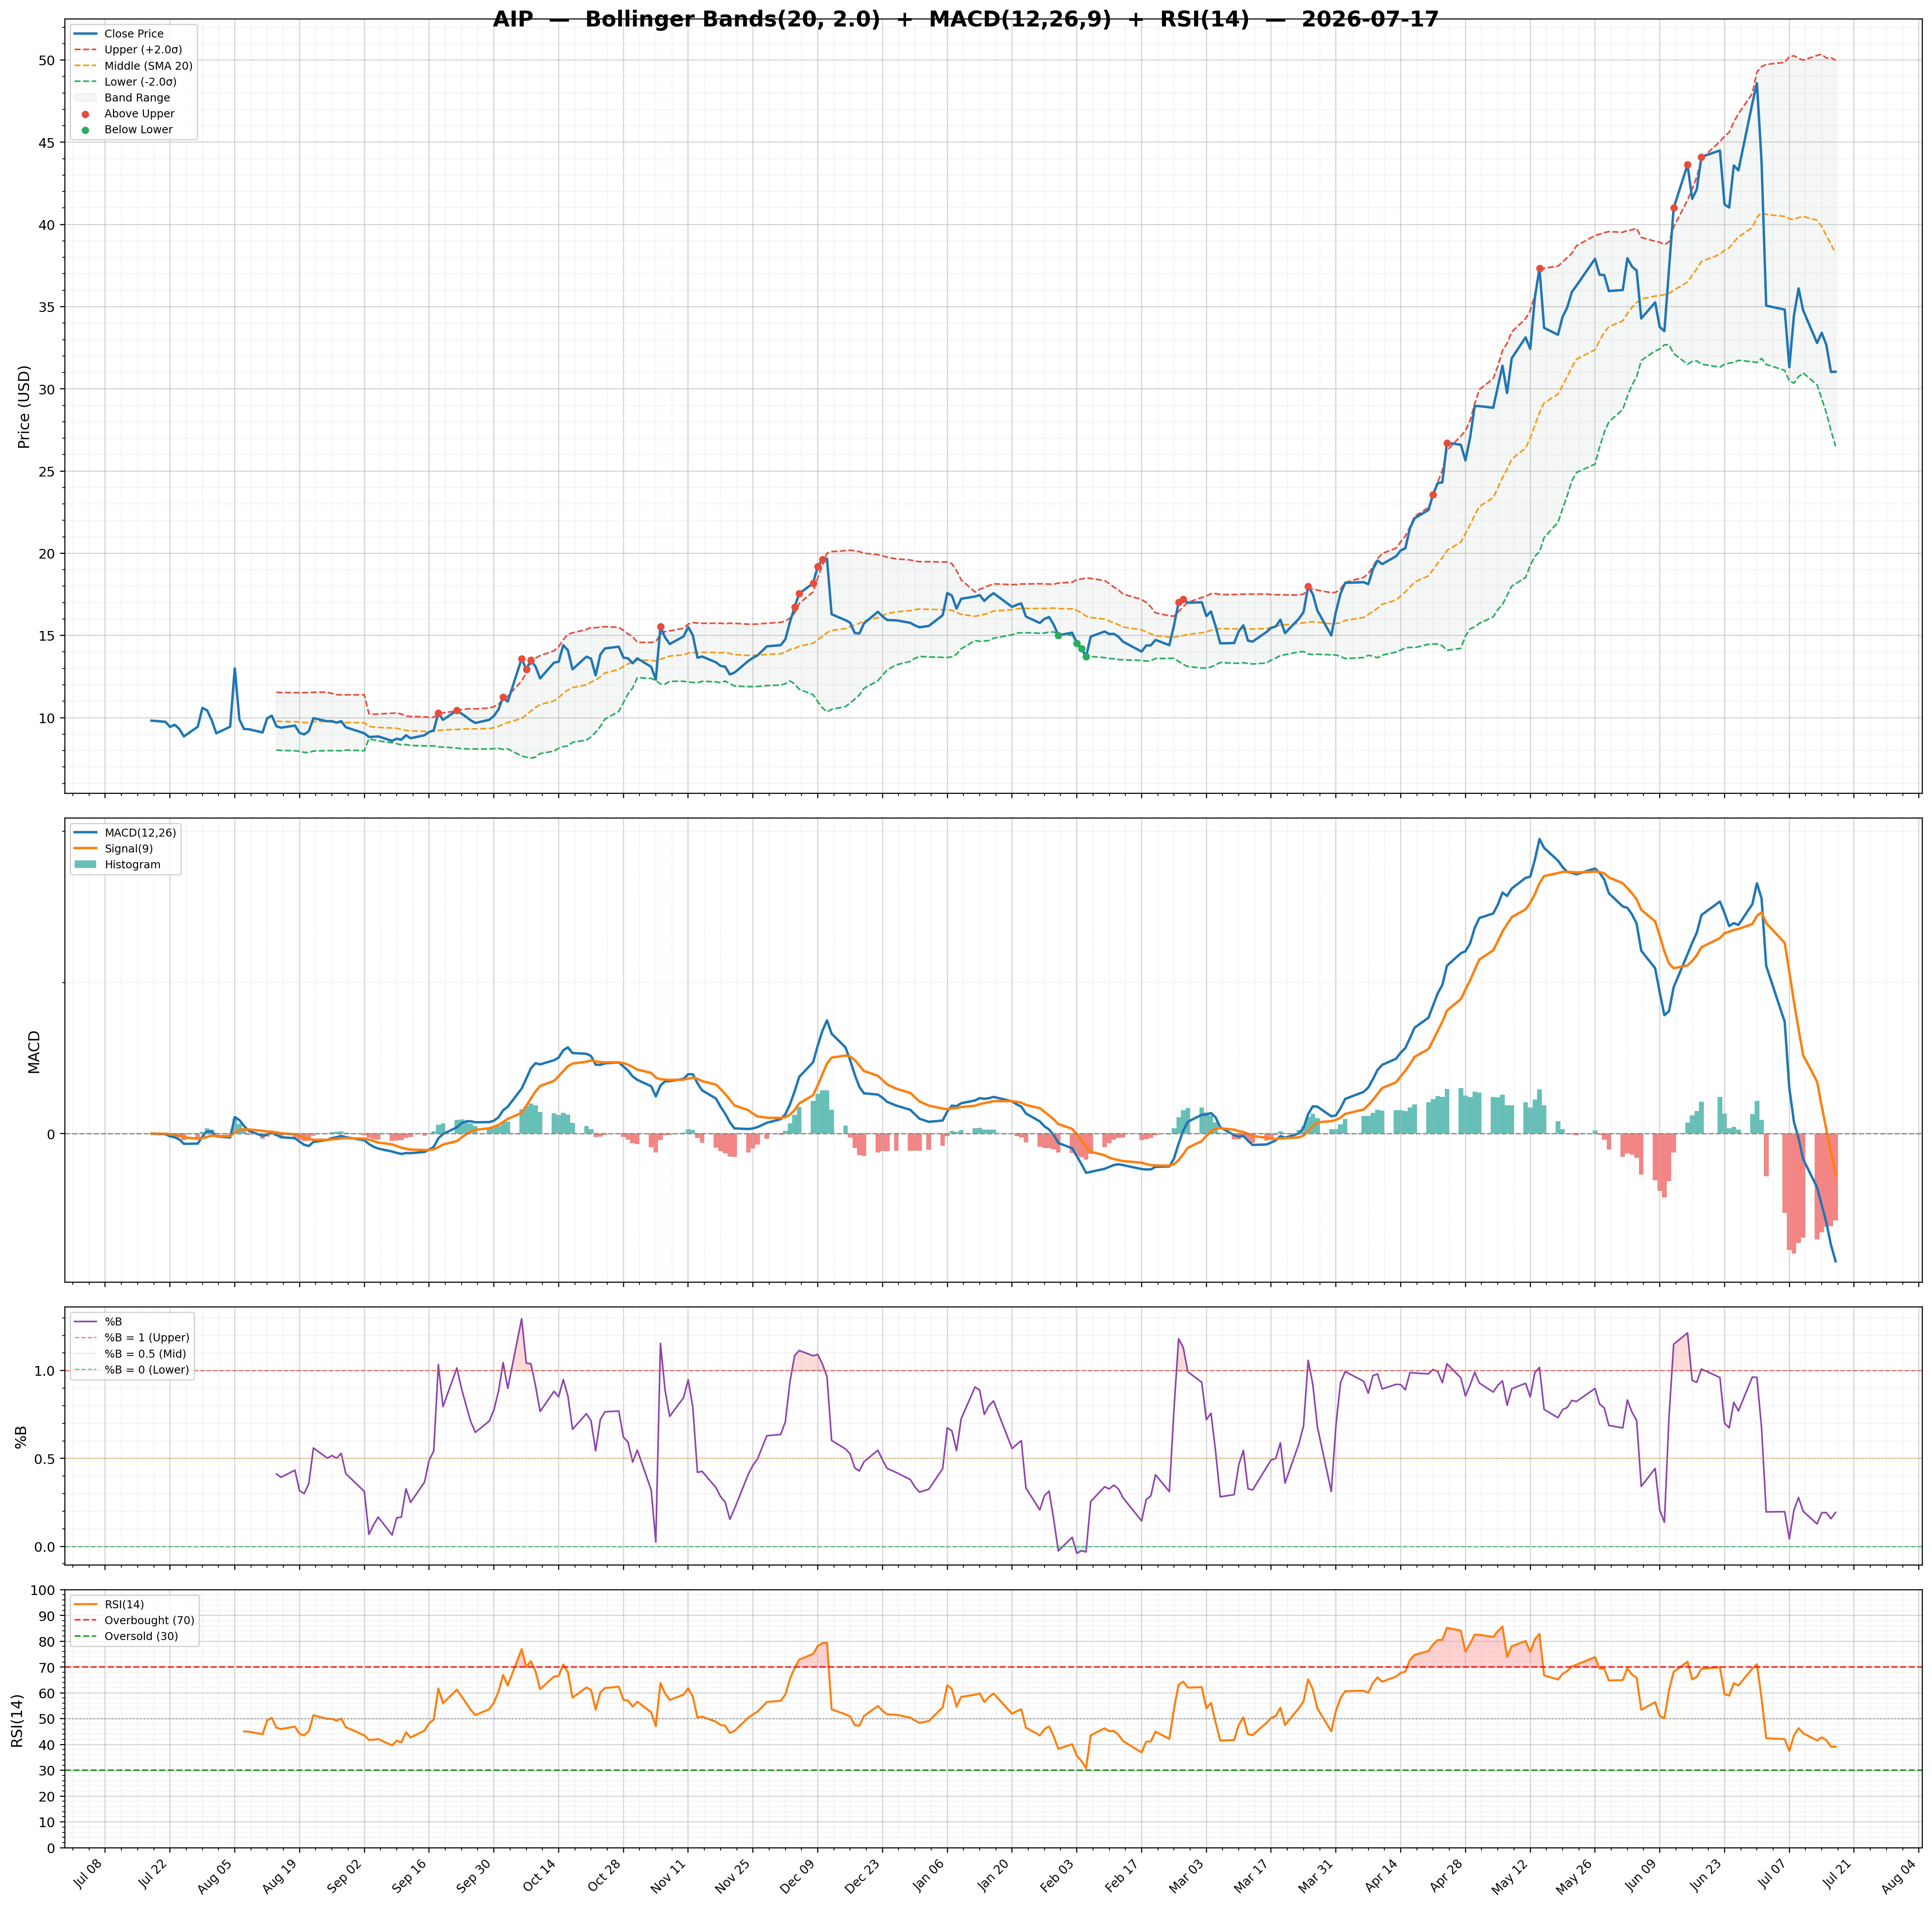
| 2026-07-17 | AIP | 31.04 | / | 56.12% | none | 820,654/1,040,793 | 61.36/0.19 | 39.18/-1.1500 | 1.04 | -1.69/-0.54 | Chart 3M 🌐 |
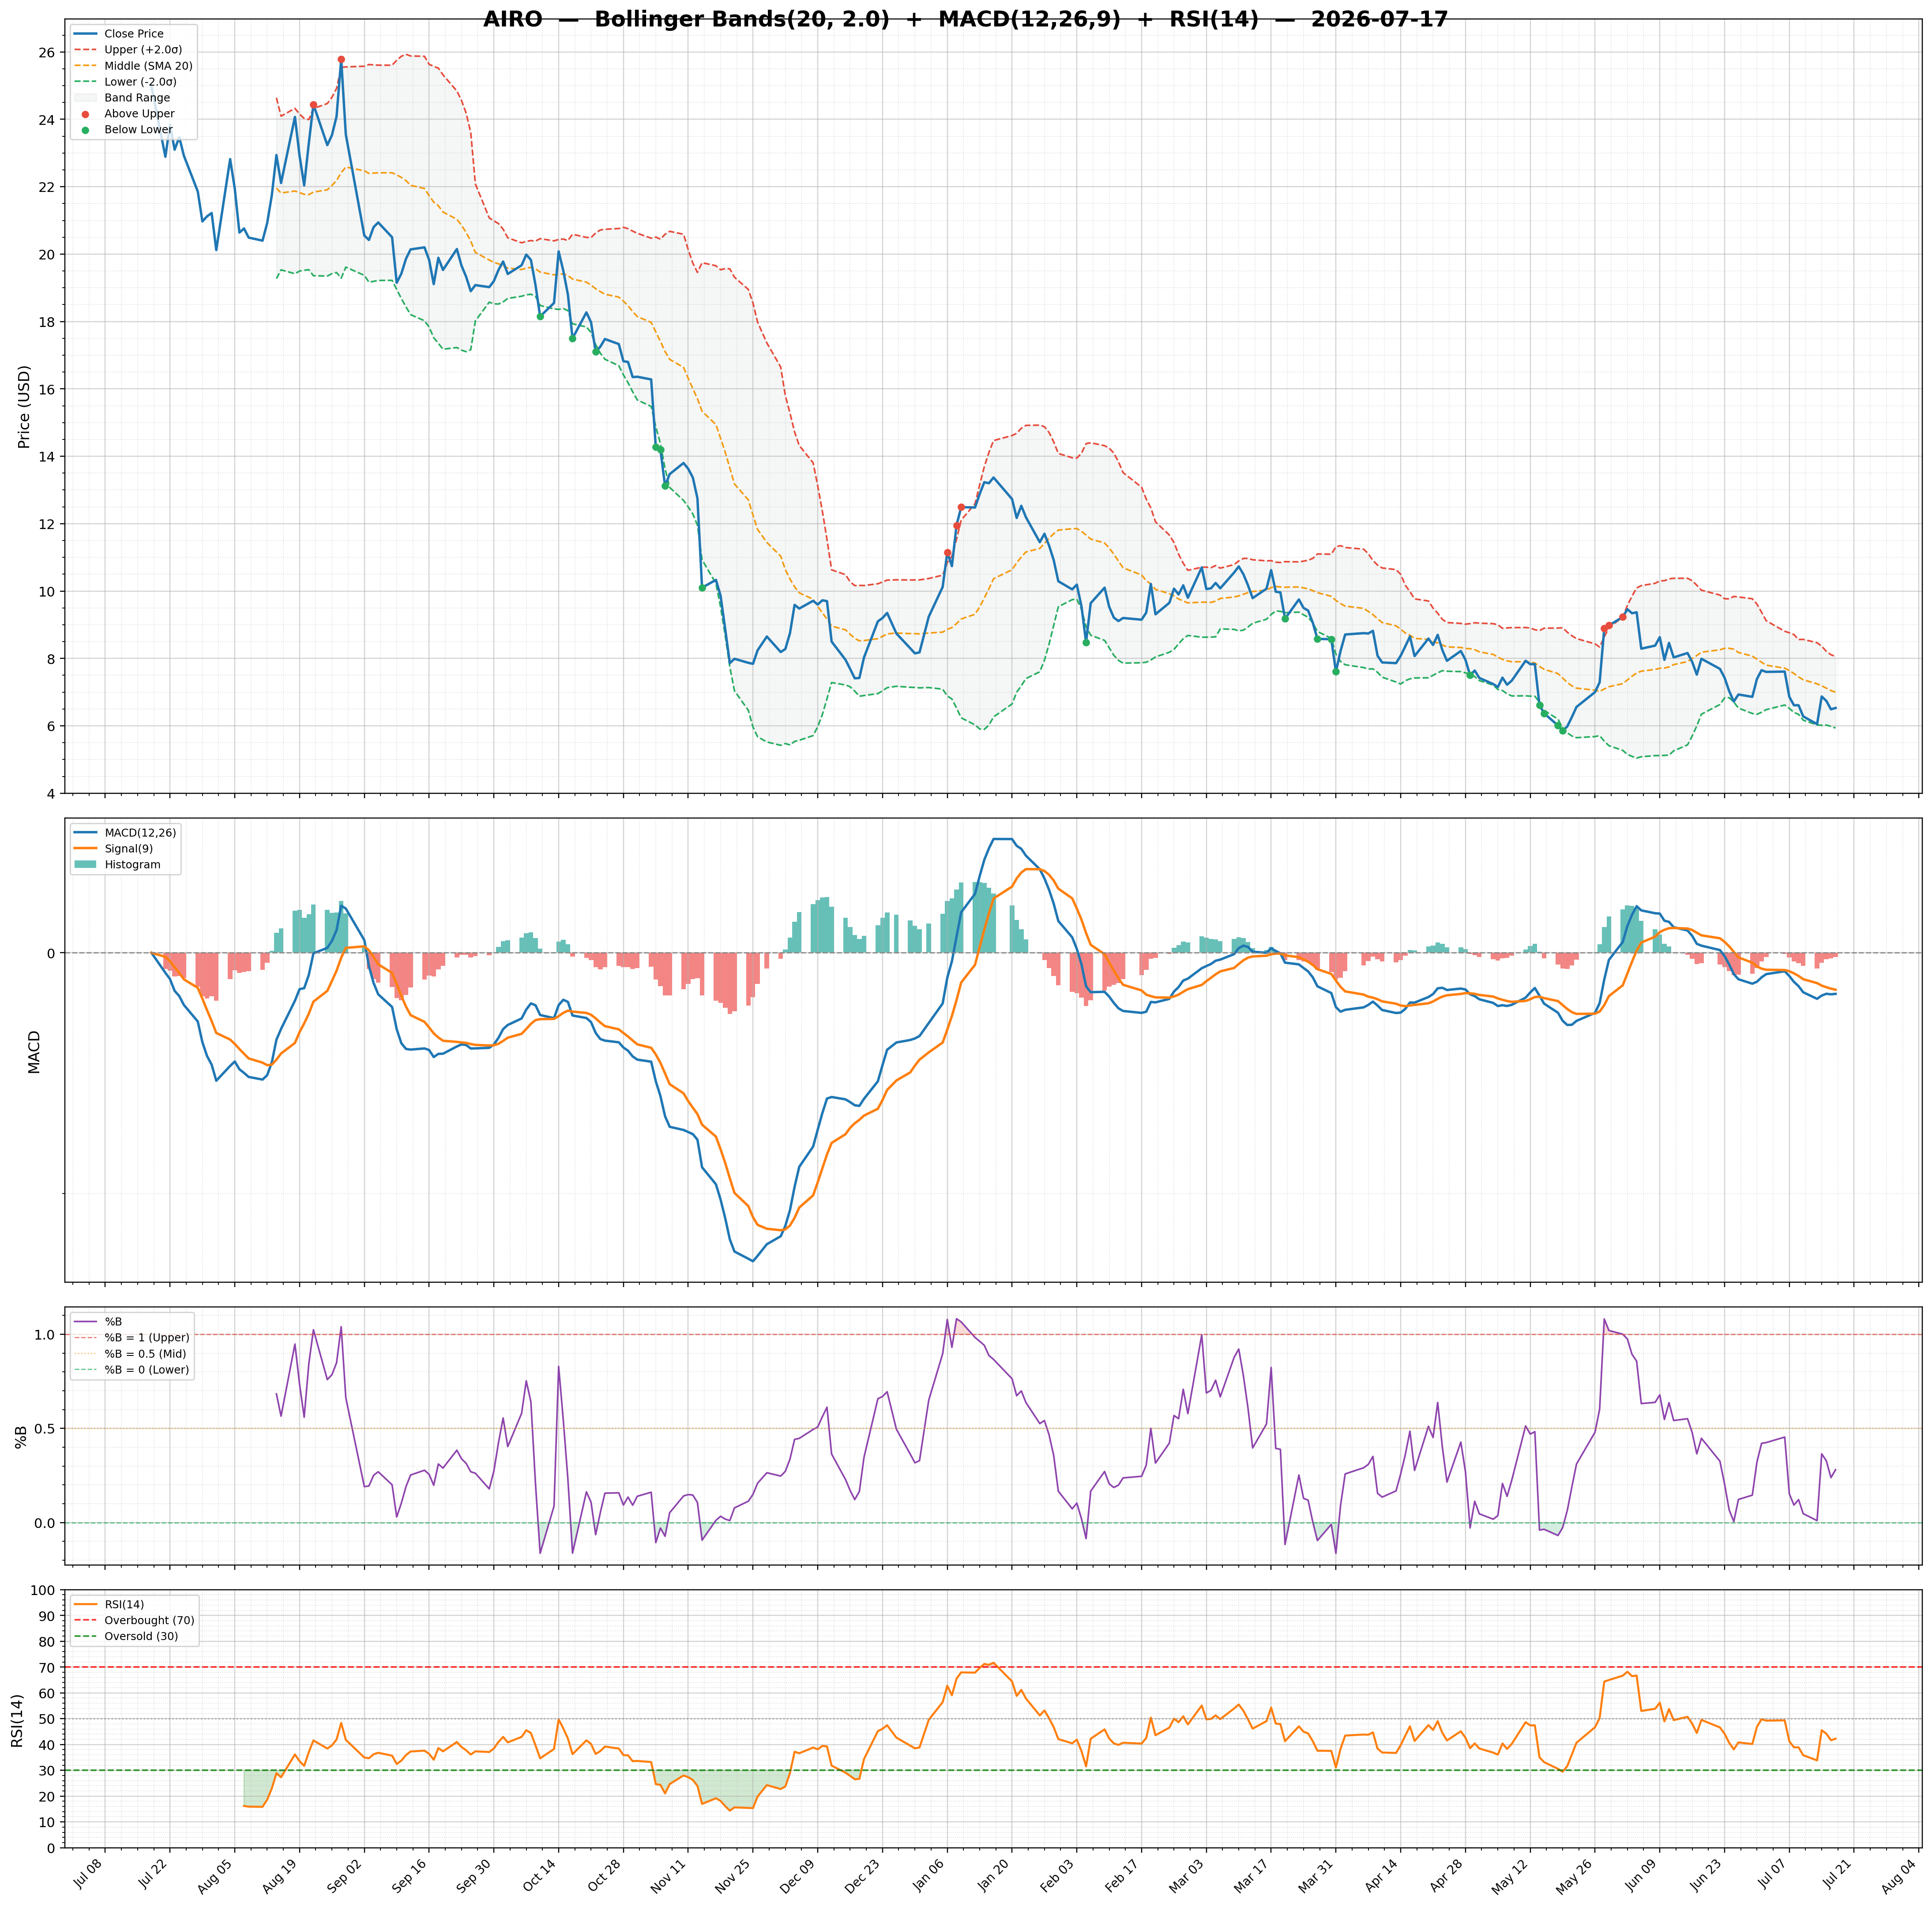
| 2026-07-17 | AIRO | 6.53 | / | 3.41% | buy | 279,999/464,940 | 30.37/0.28 | 42.24/-0.0400 | -0.48 | -0.34/-0.31 | Chart 3M 🌐 |
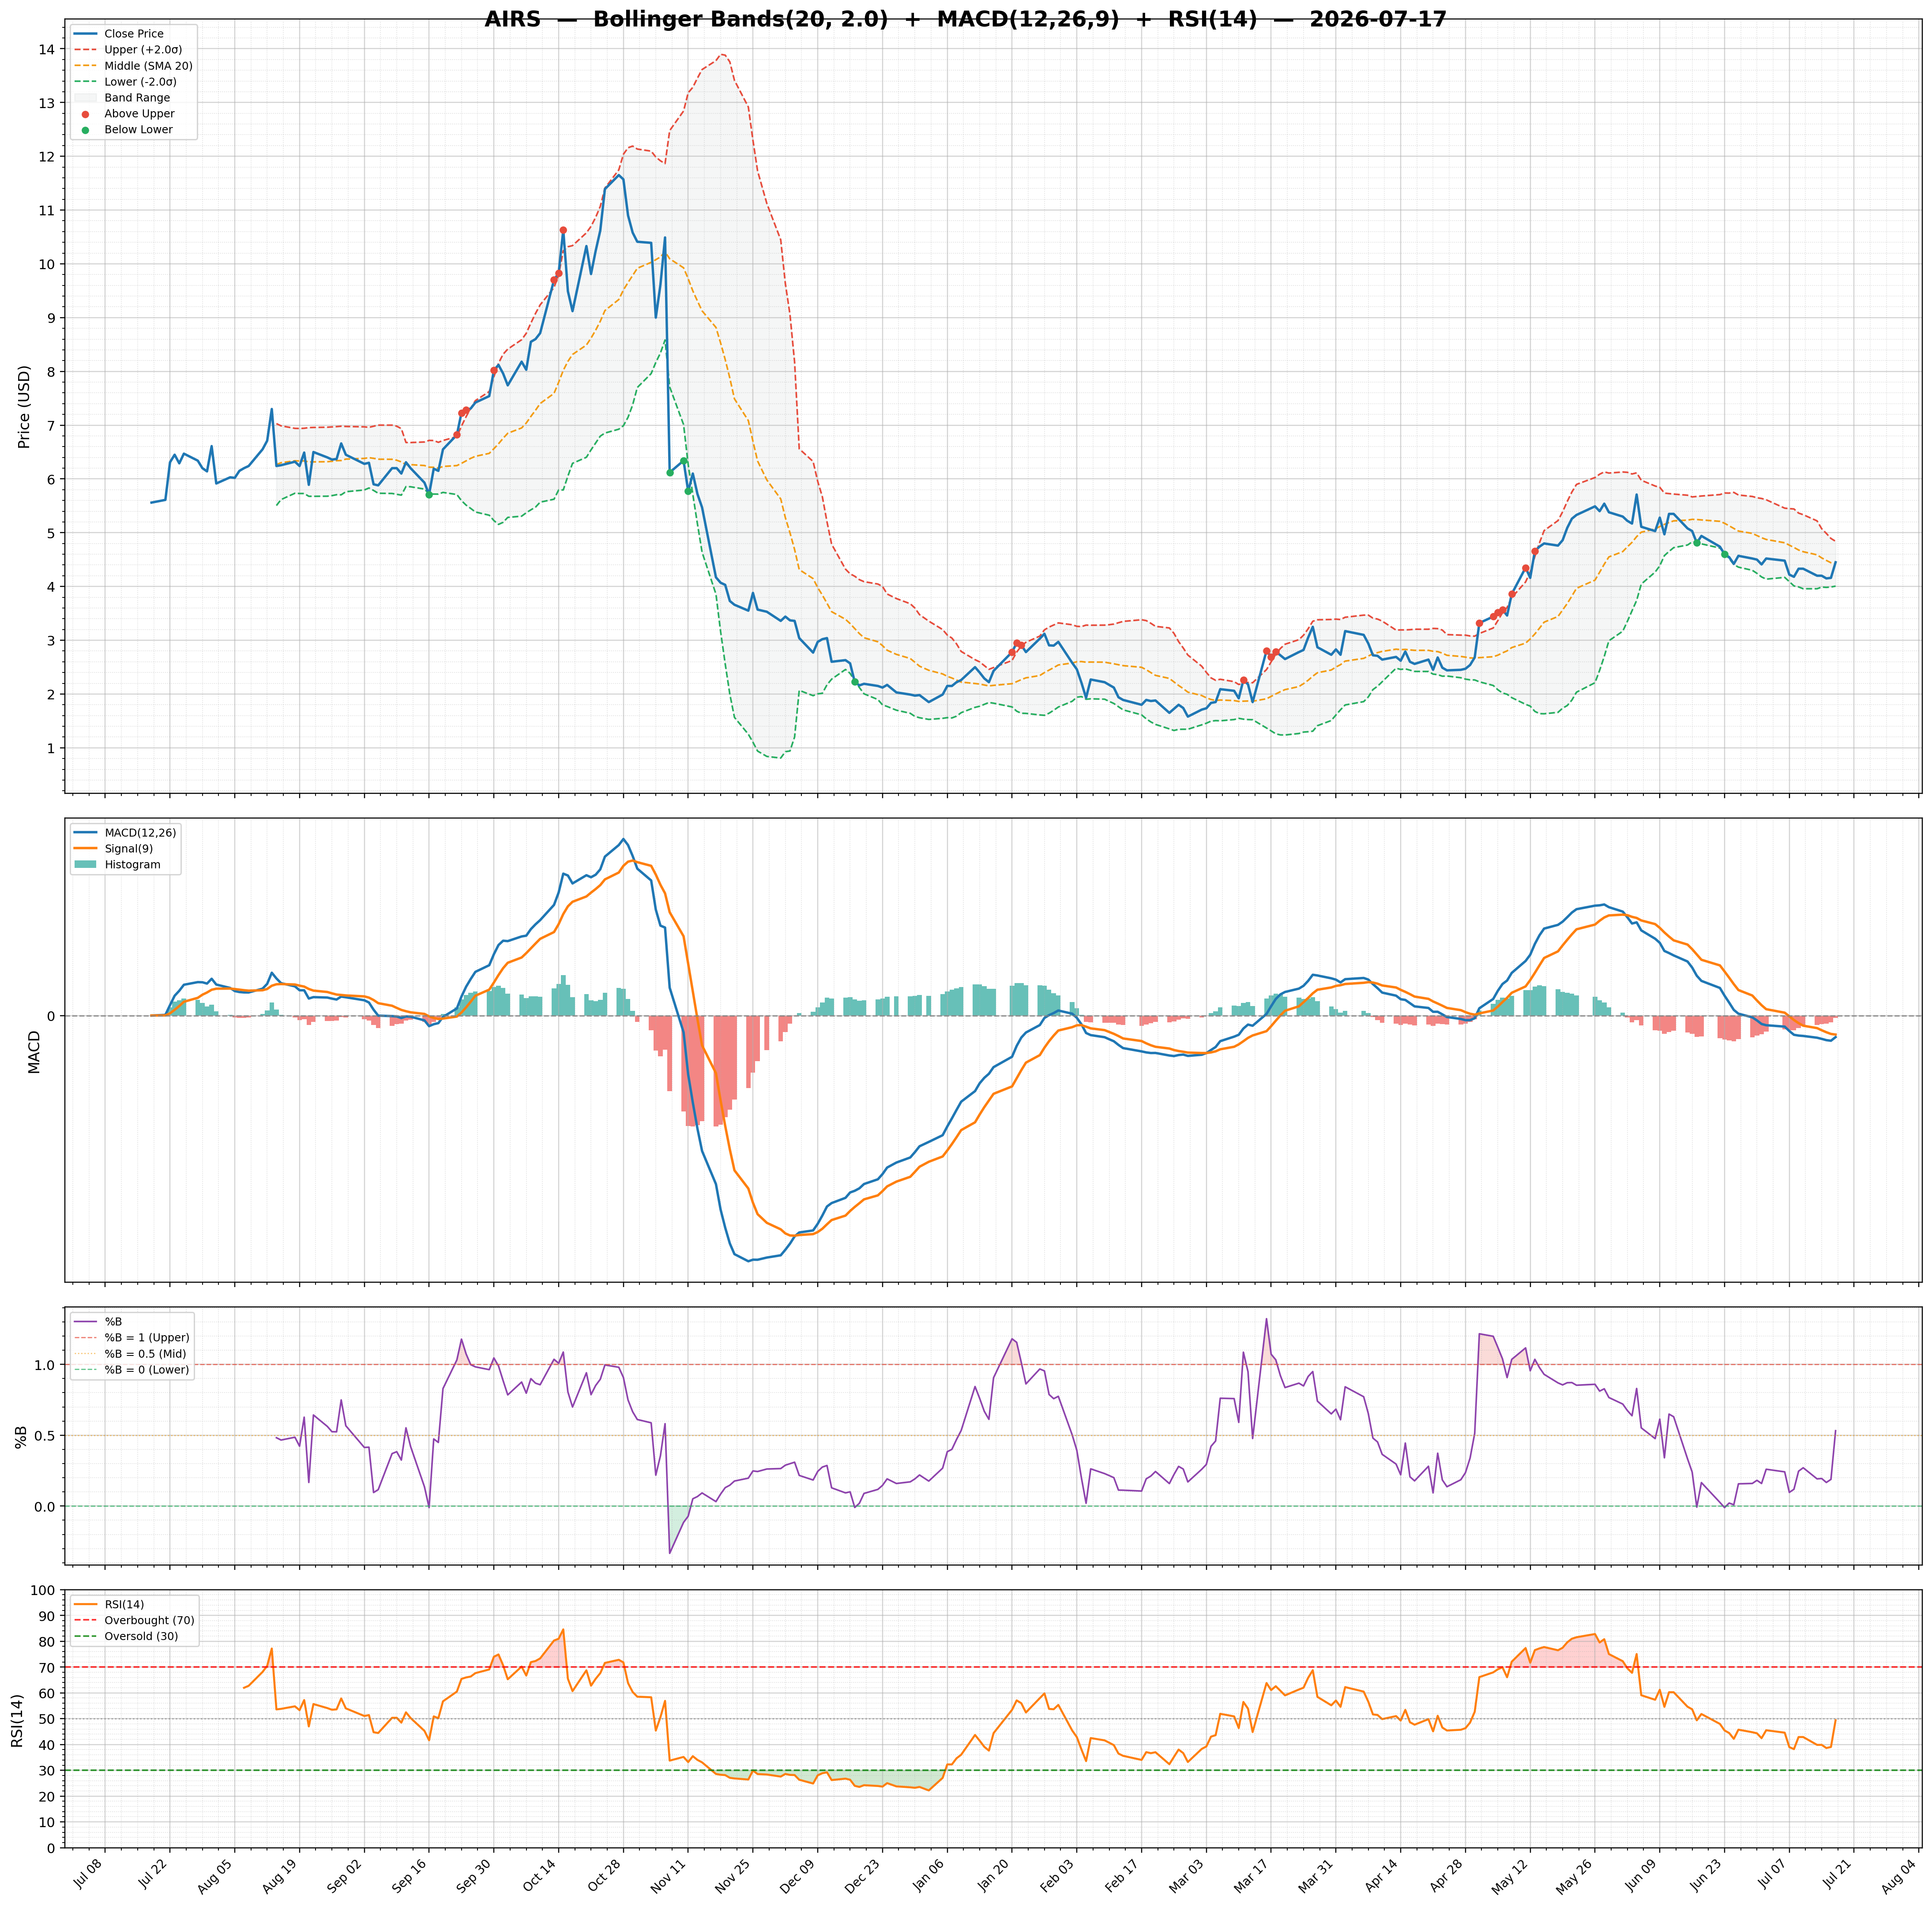
| 2026-07-17 | AIRS | 4.45 | / | 28.50% | hold | 619,529/500,279 | 18.85/0.53 | 49.40/-0.0200 | 0.32 | -0.13/-0.12 | Chart 3M 🌐 |
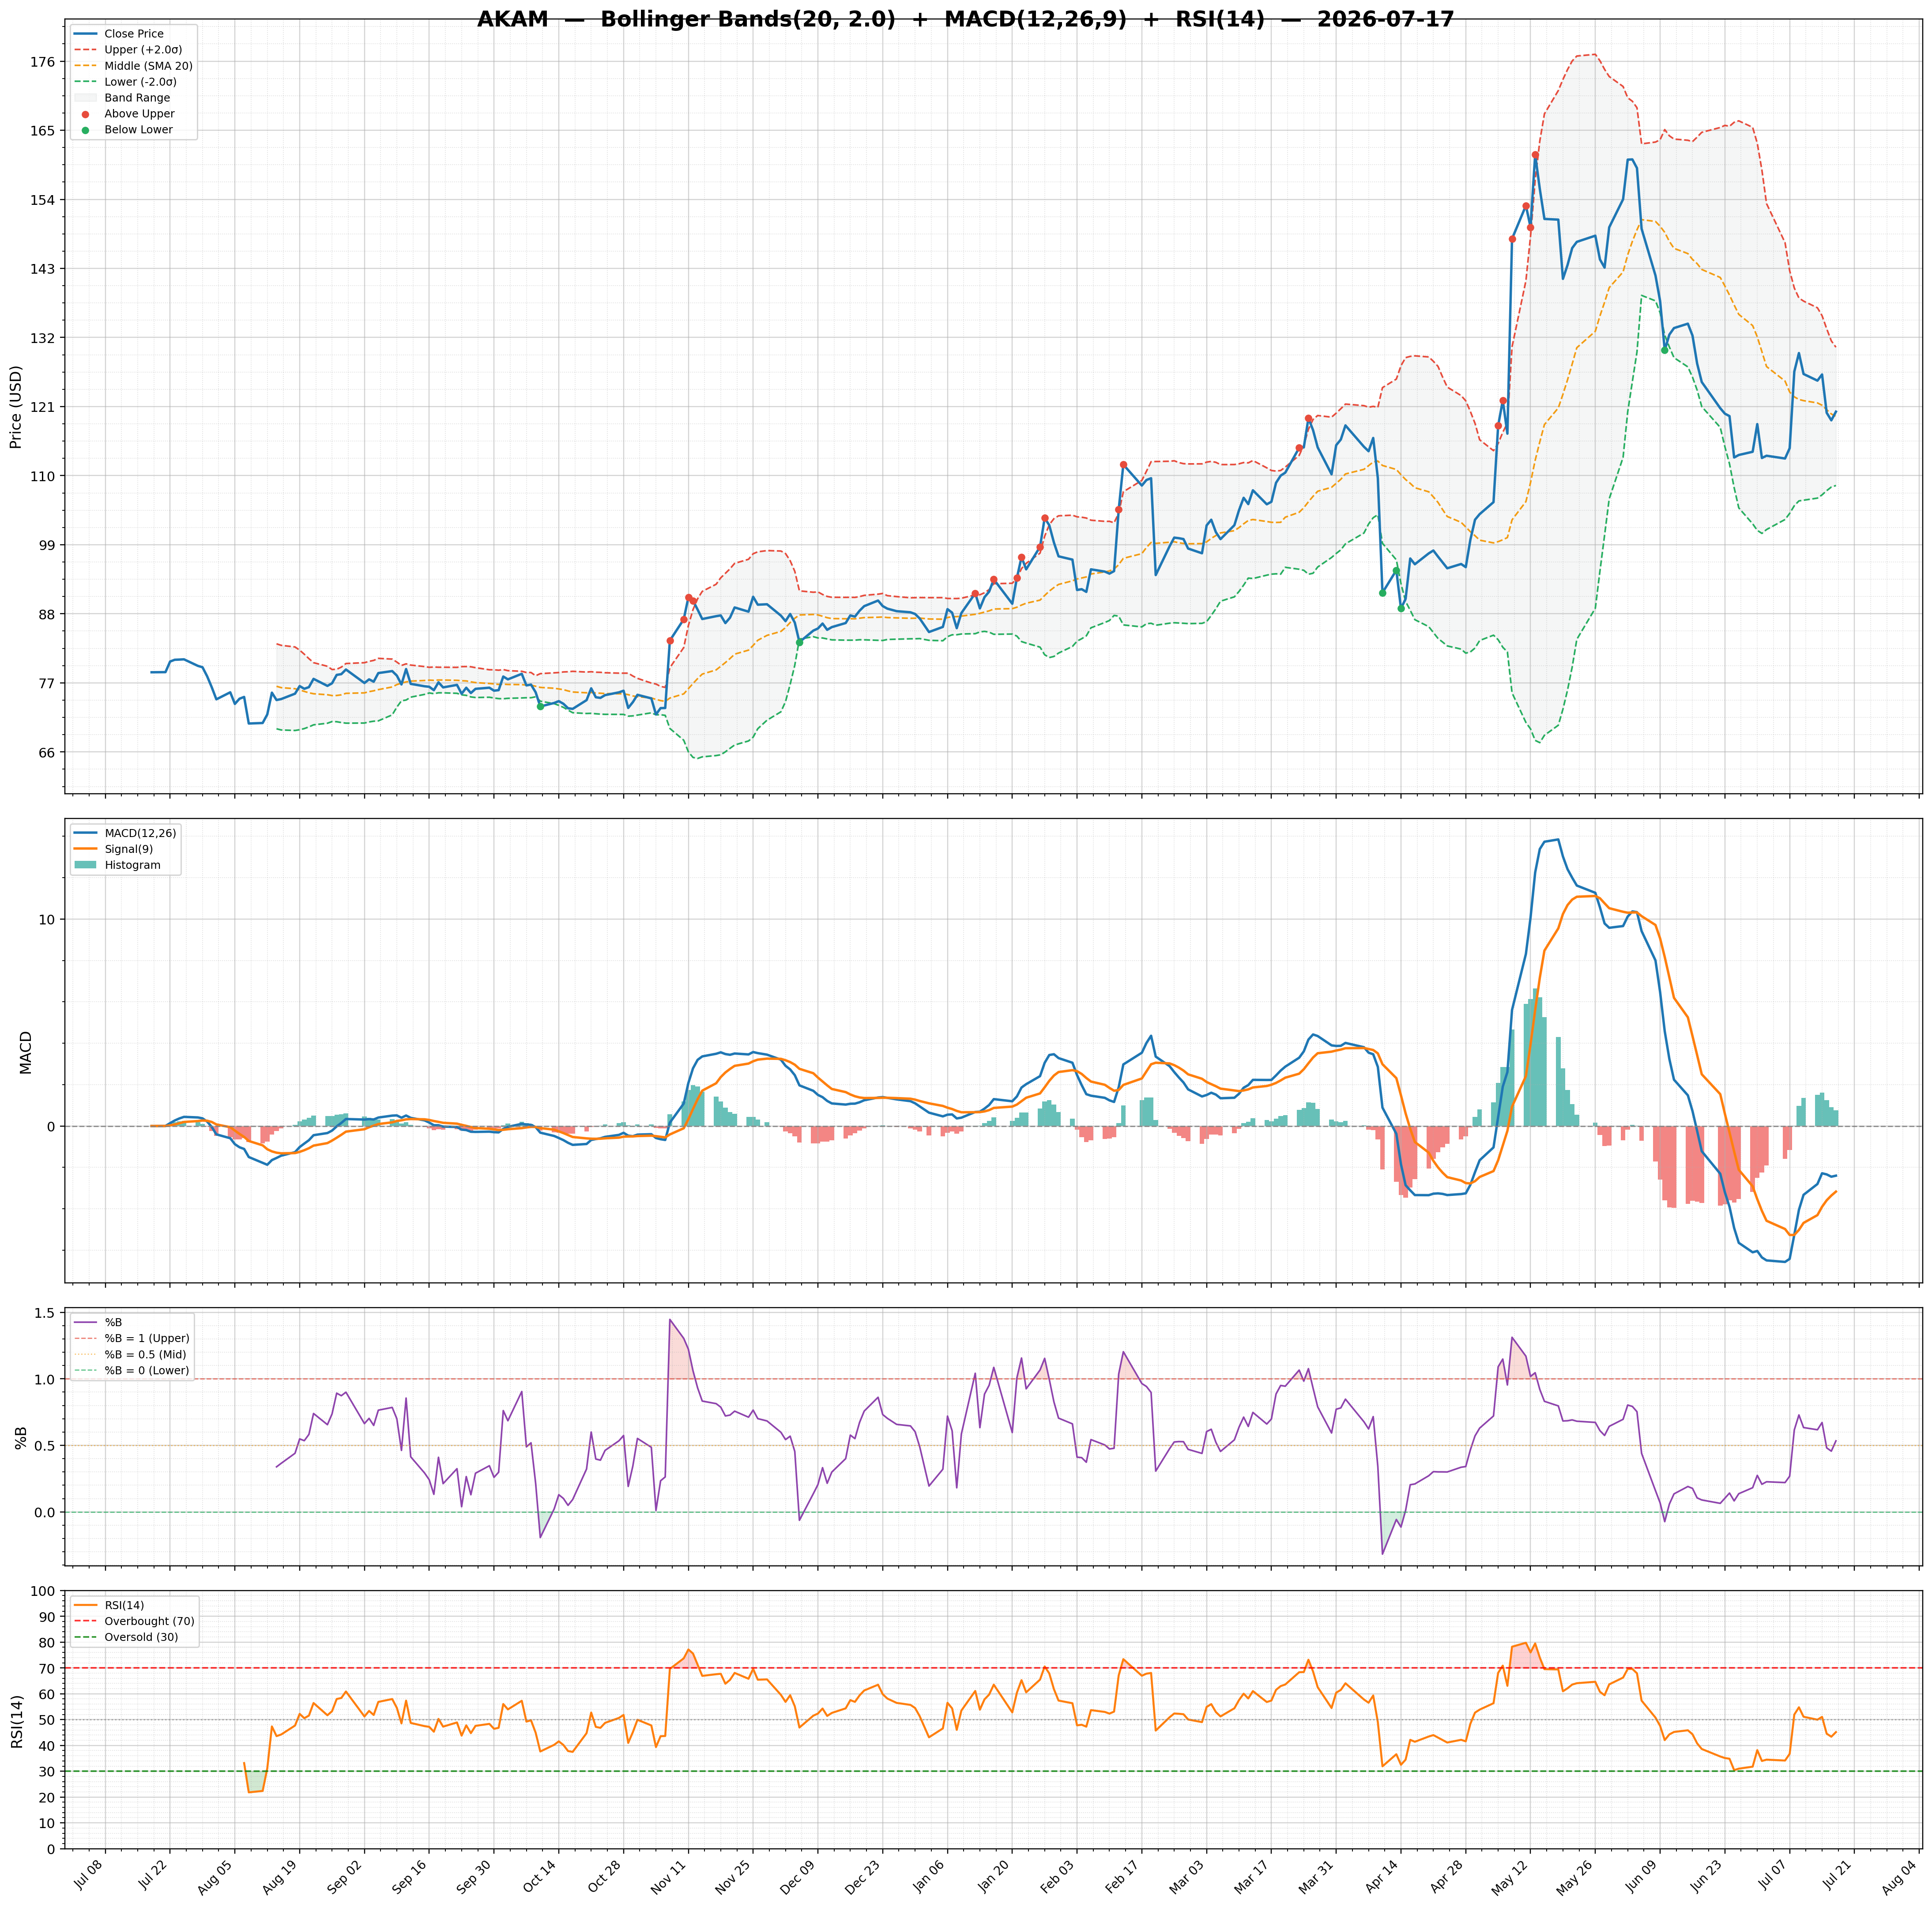
| 2026-07-17 | AKAM | 120.19 | / | 54.81% | buy | 3,400,661/3,982,783 | 18.44/0.53 | 45.16/0.7700 | 0.39 | -2.40/-3.17 | Chart 3M 🌐 |
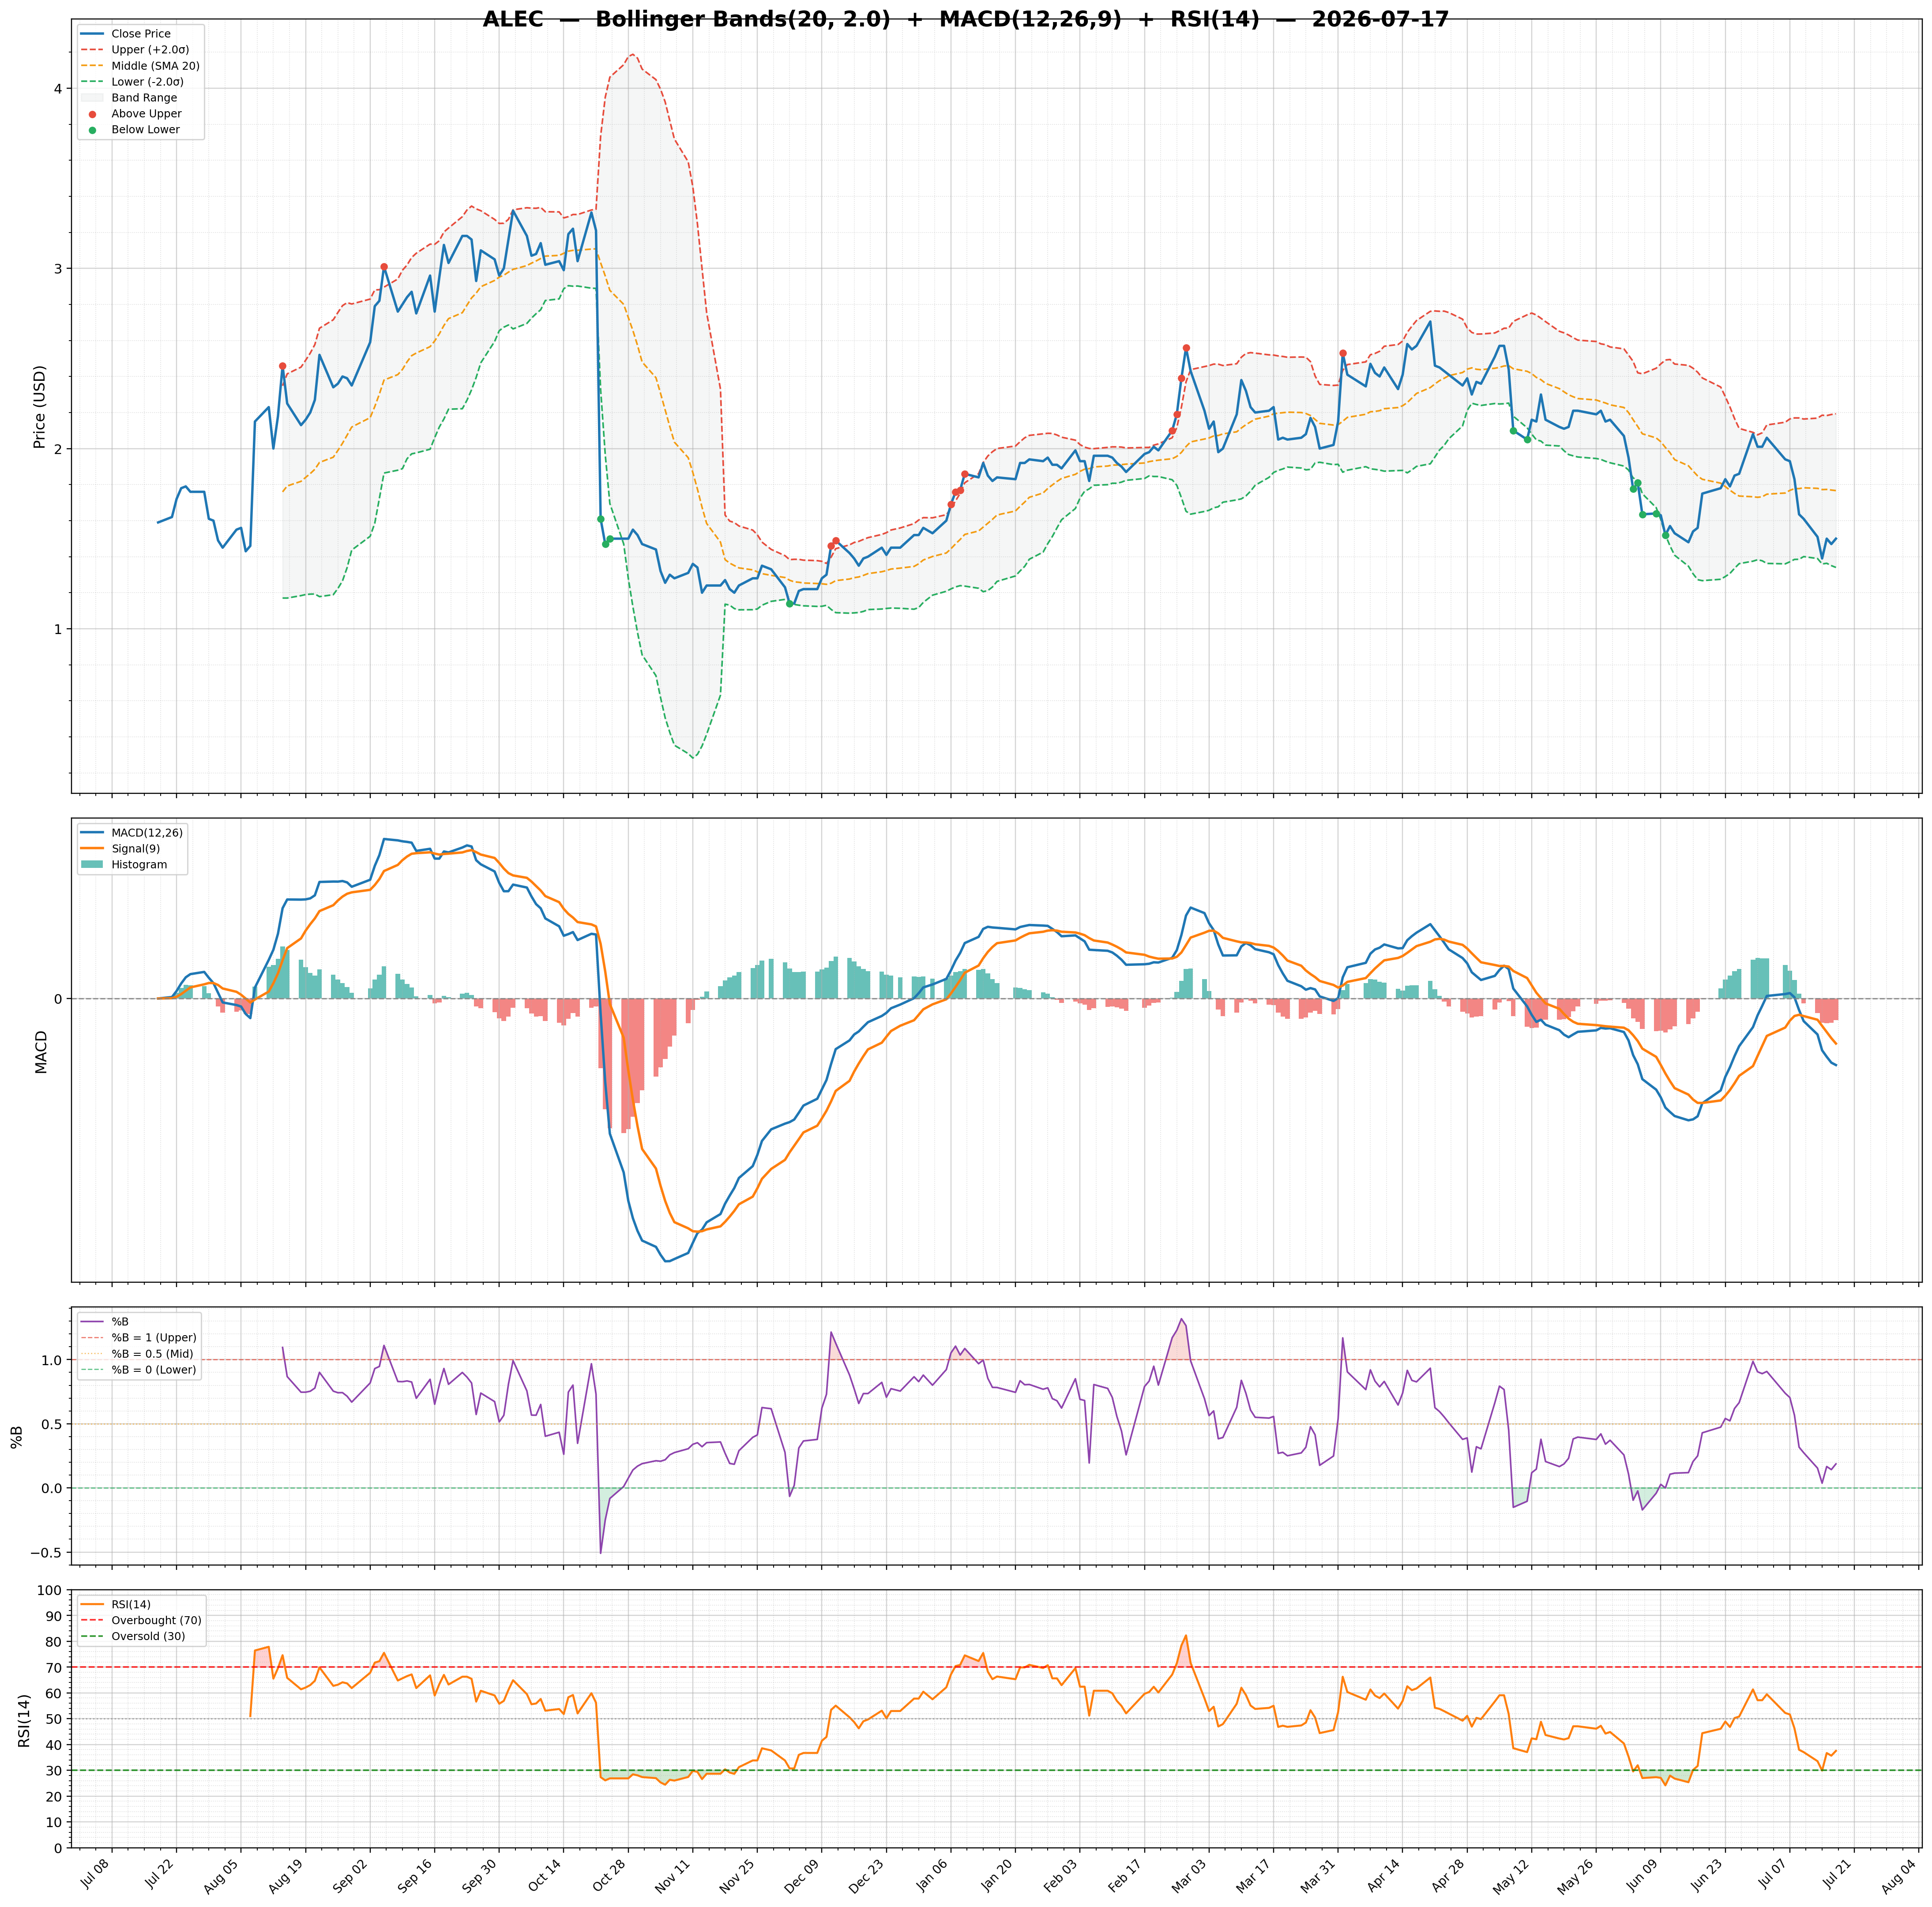
| 2026-07-17 | ALEC | 1.50 | / | 16.51% | hold | 495,078/936,189 | 48.28/0.19 | 37.54/-0.0400 | -0.32 | -0.11/-0.07 | Chart 3M 🌐 |
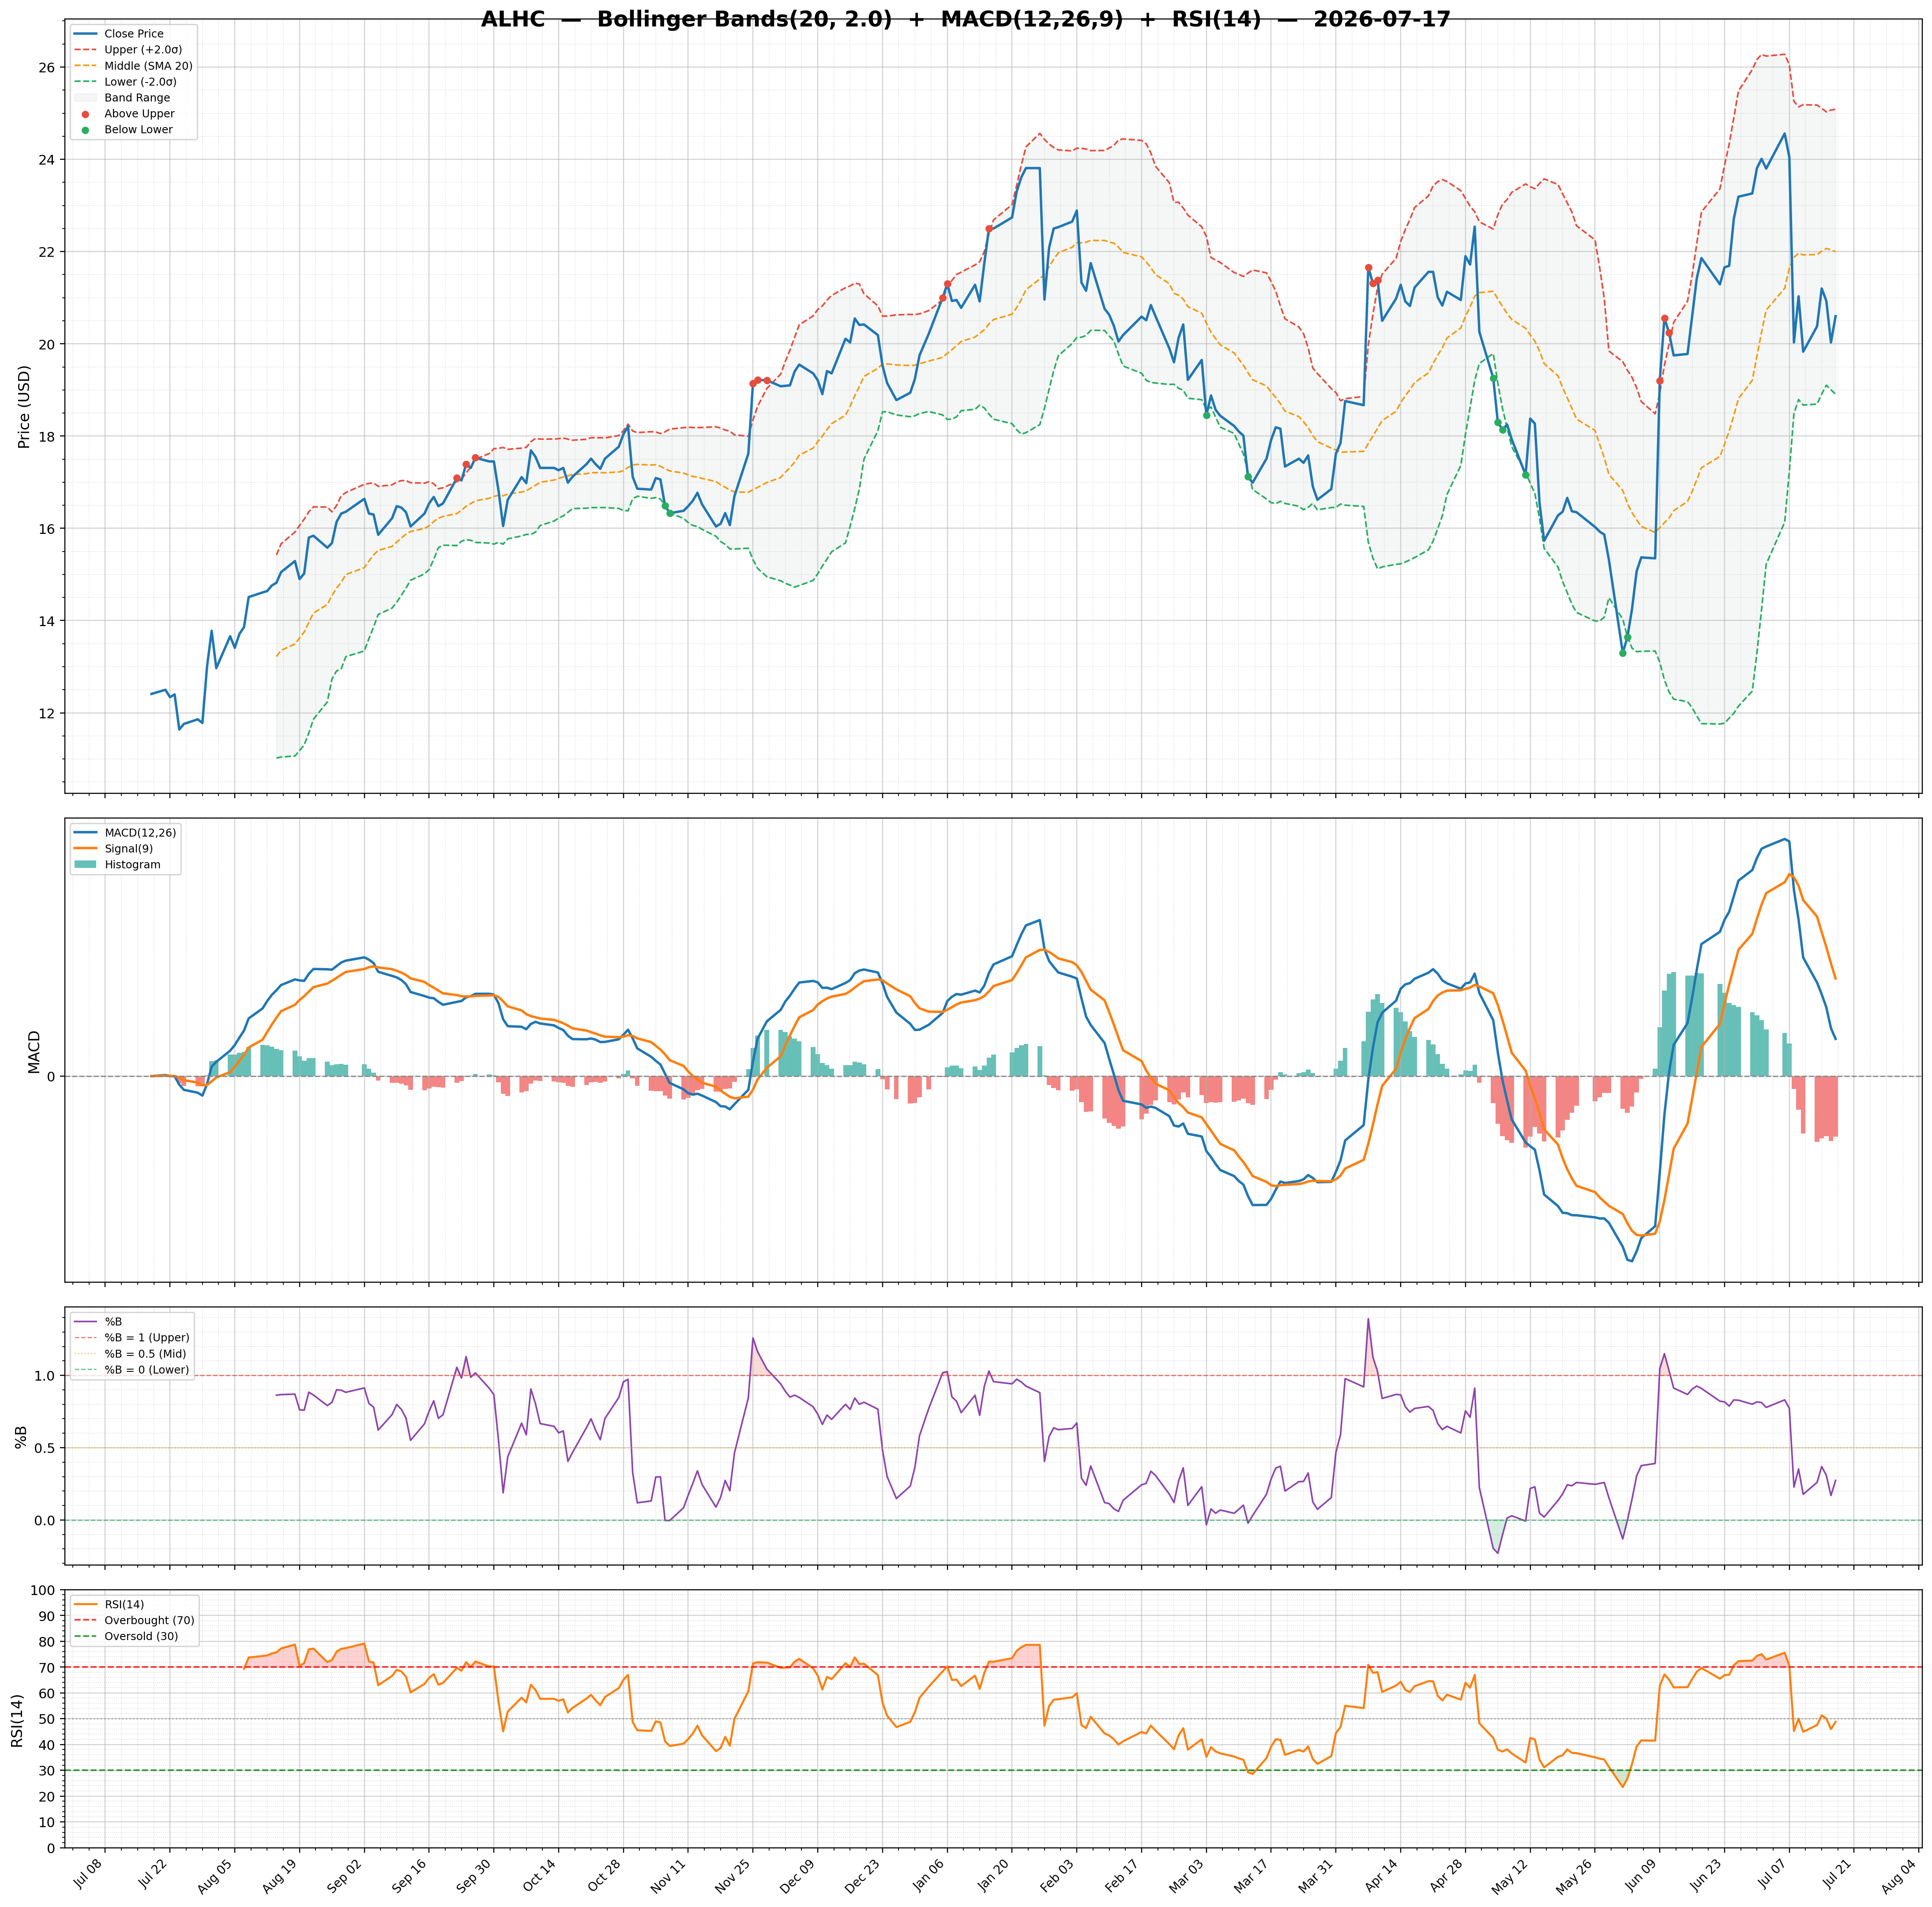
| 2026-07-17 | ALHC | 20.60 | / | 69.35% | strong_buy | 2,559,873/5,009,319 | 28.09/0.27 | 48.80/-0.4400 | 0.15 | 0.27/0.71 | Chart 3M 🌐 |
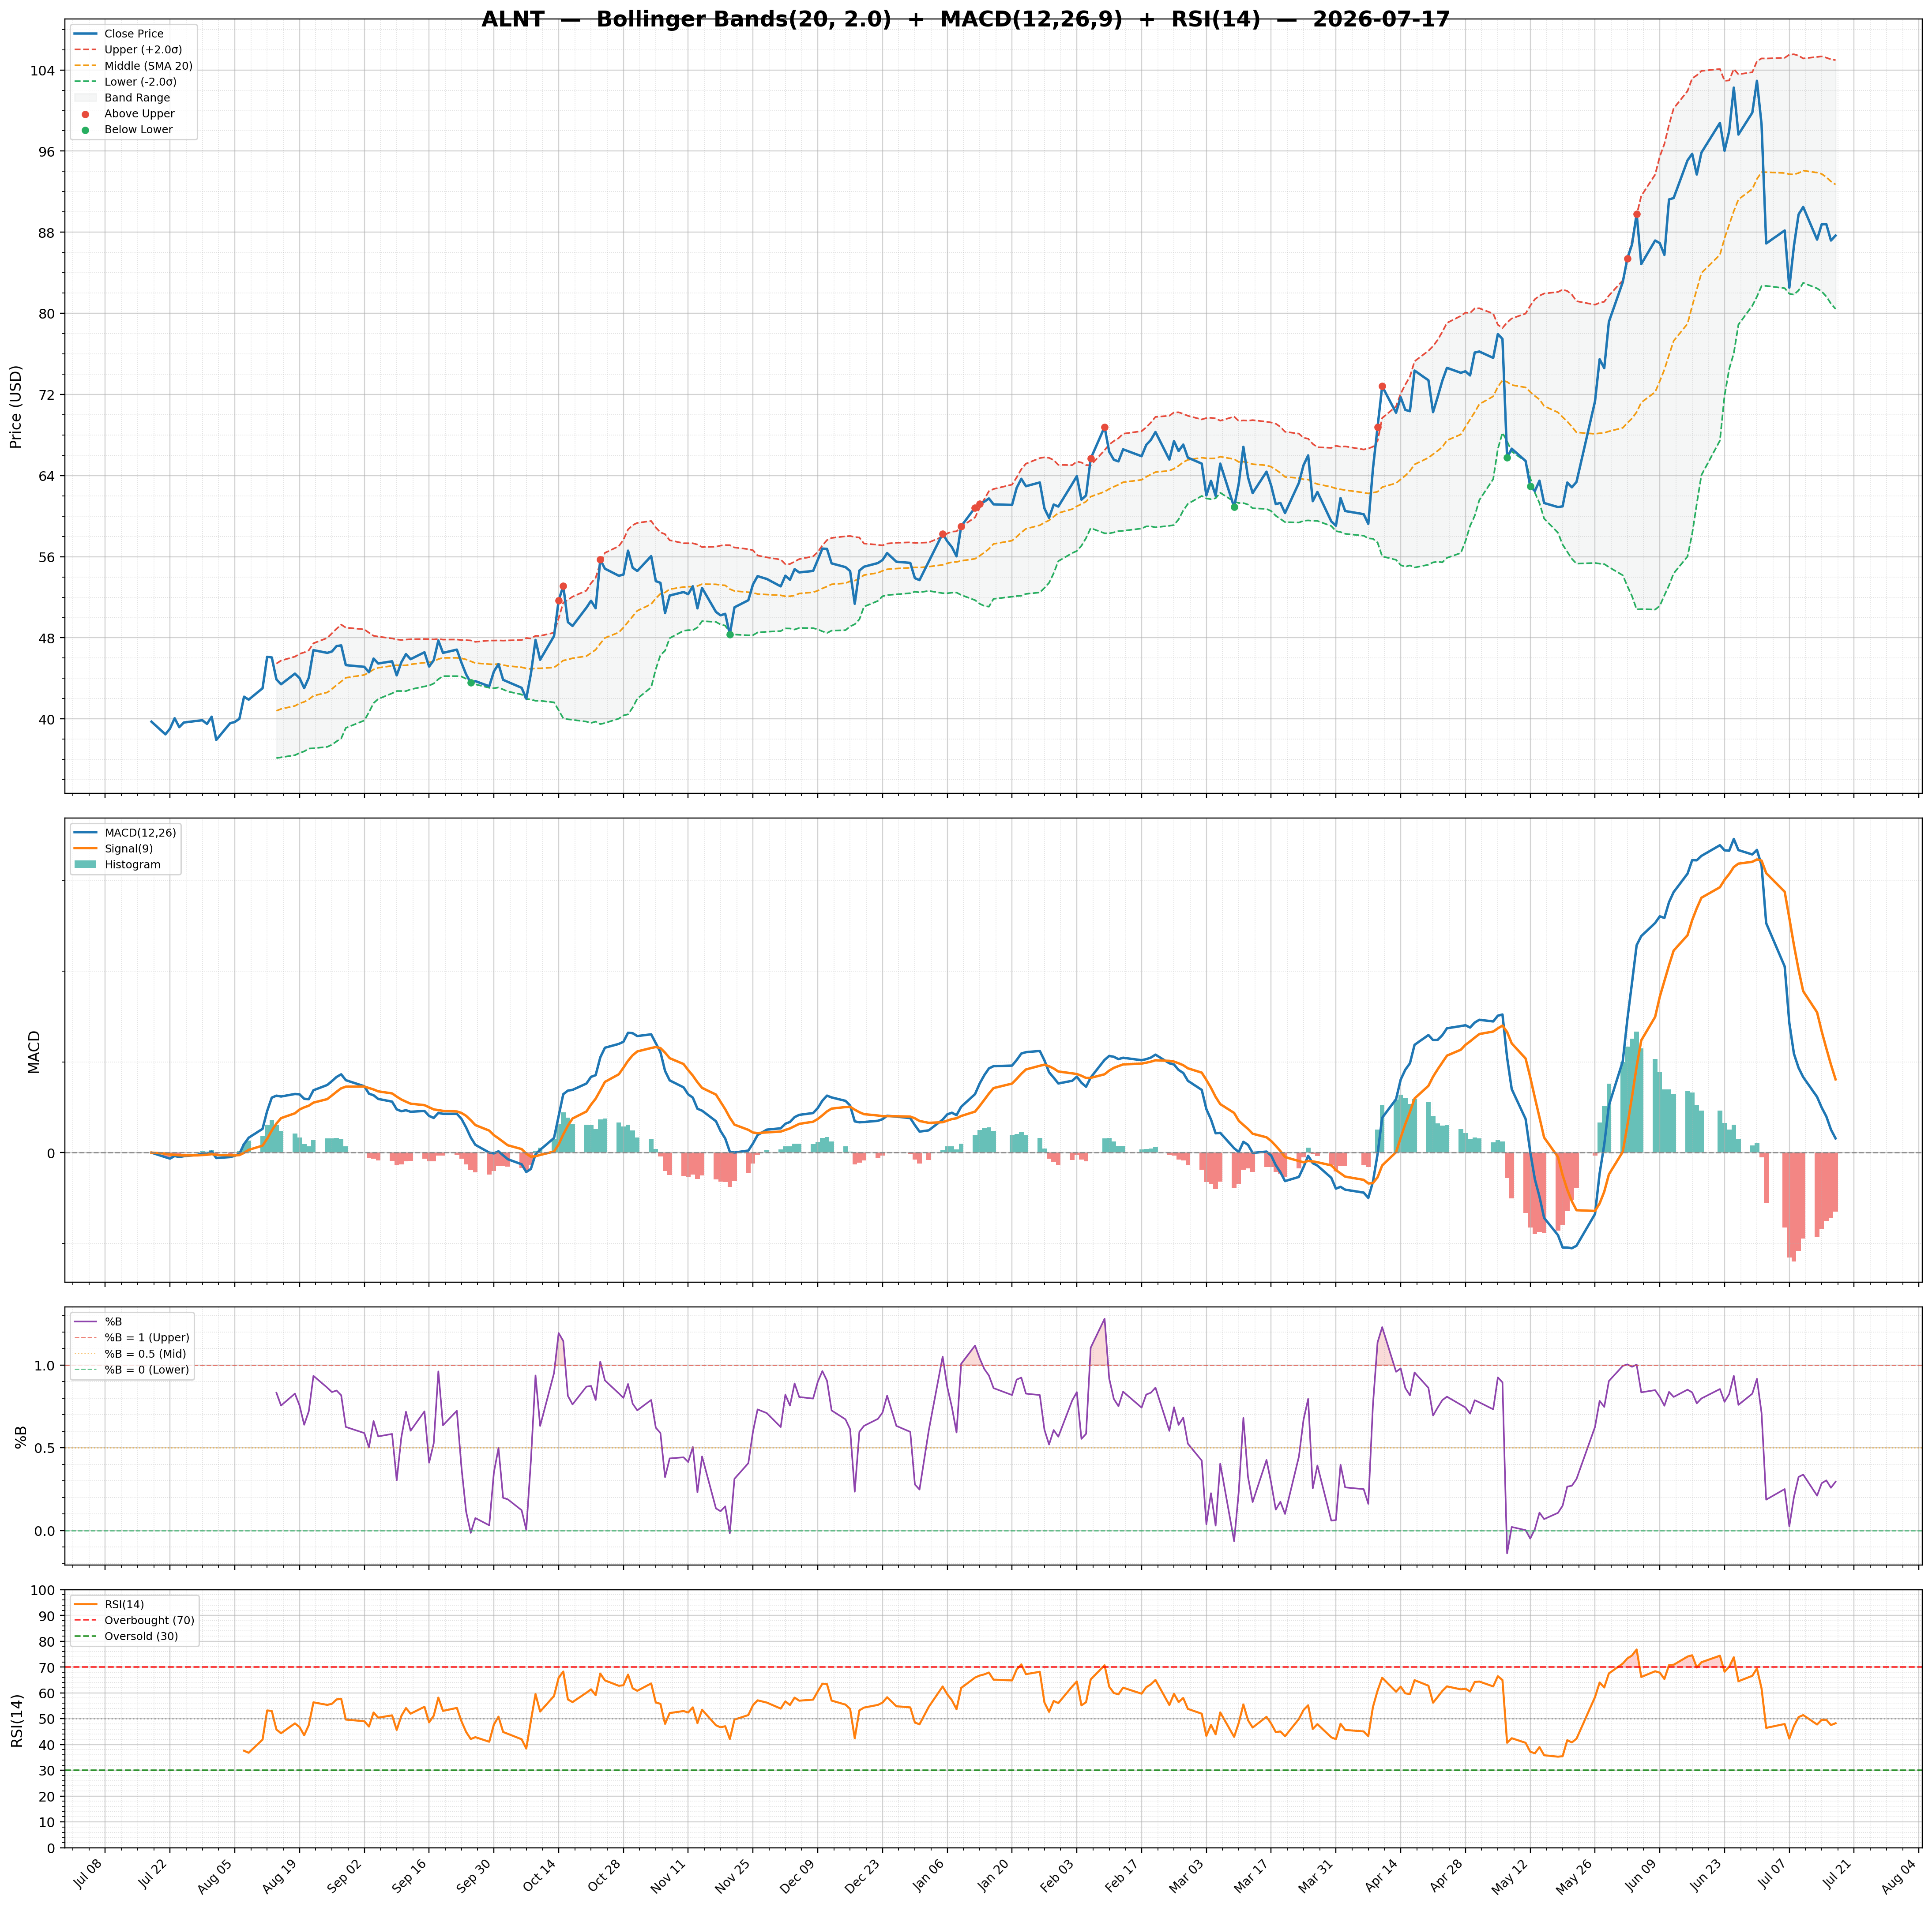
| 2026-07-17 | ALNT | 87.67 | / | 76.52% | buy | 201,028/321,396 | 26.48/0.30 | 48.24/-1.3000 | 0.58 | 0.31/1.62 | Chart 3M 🌐 |
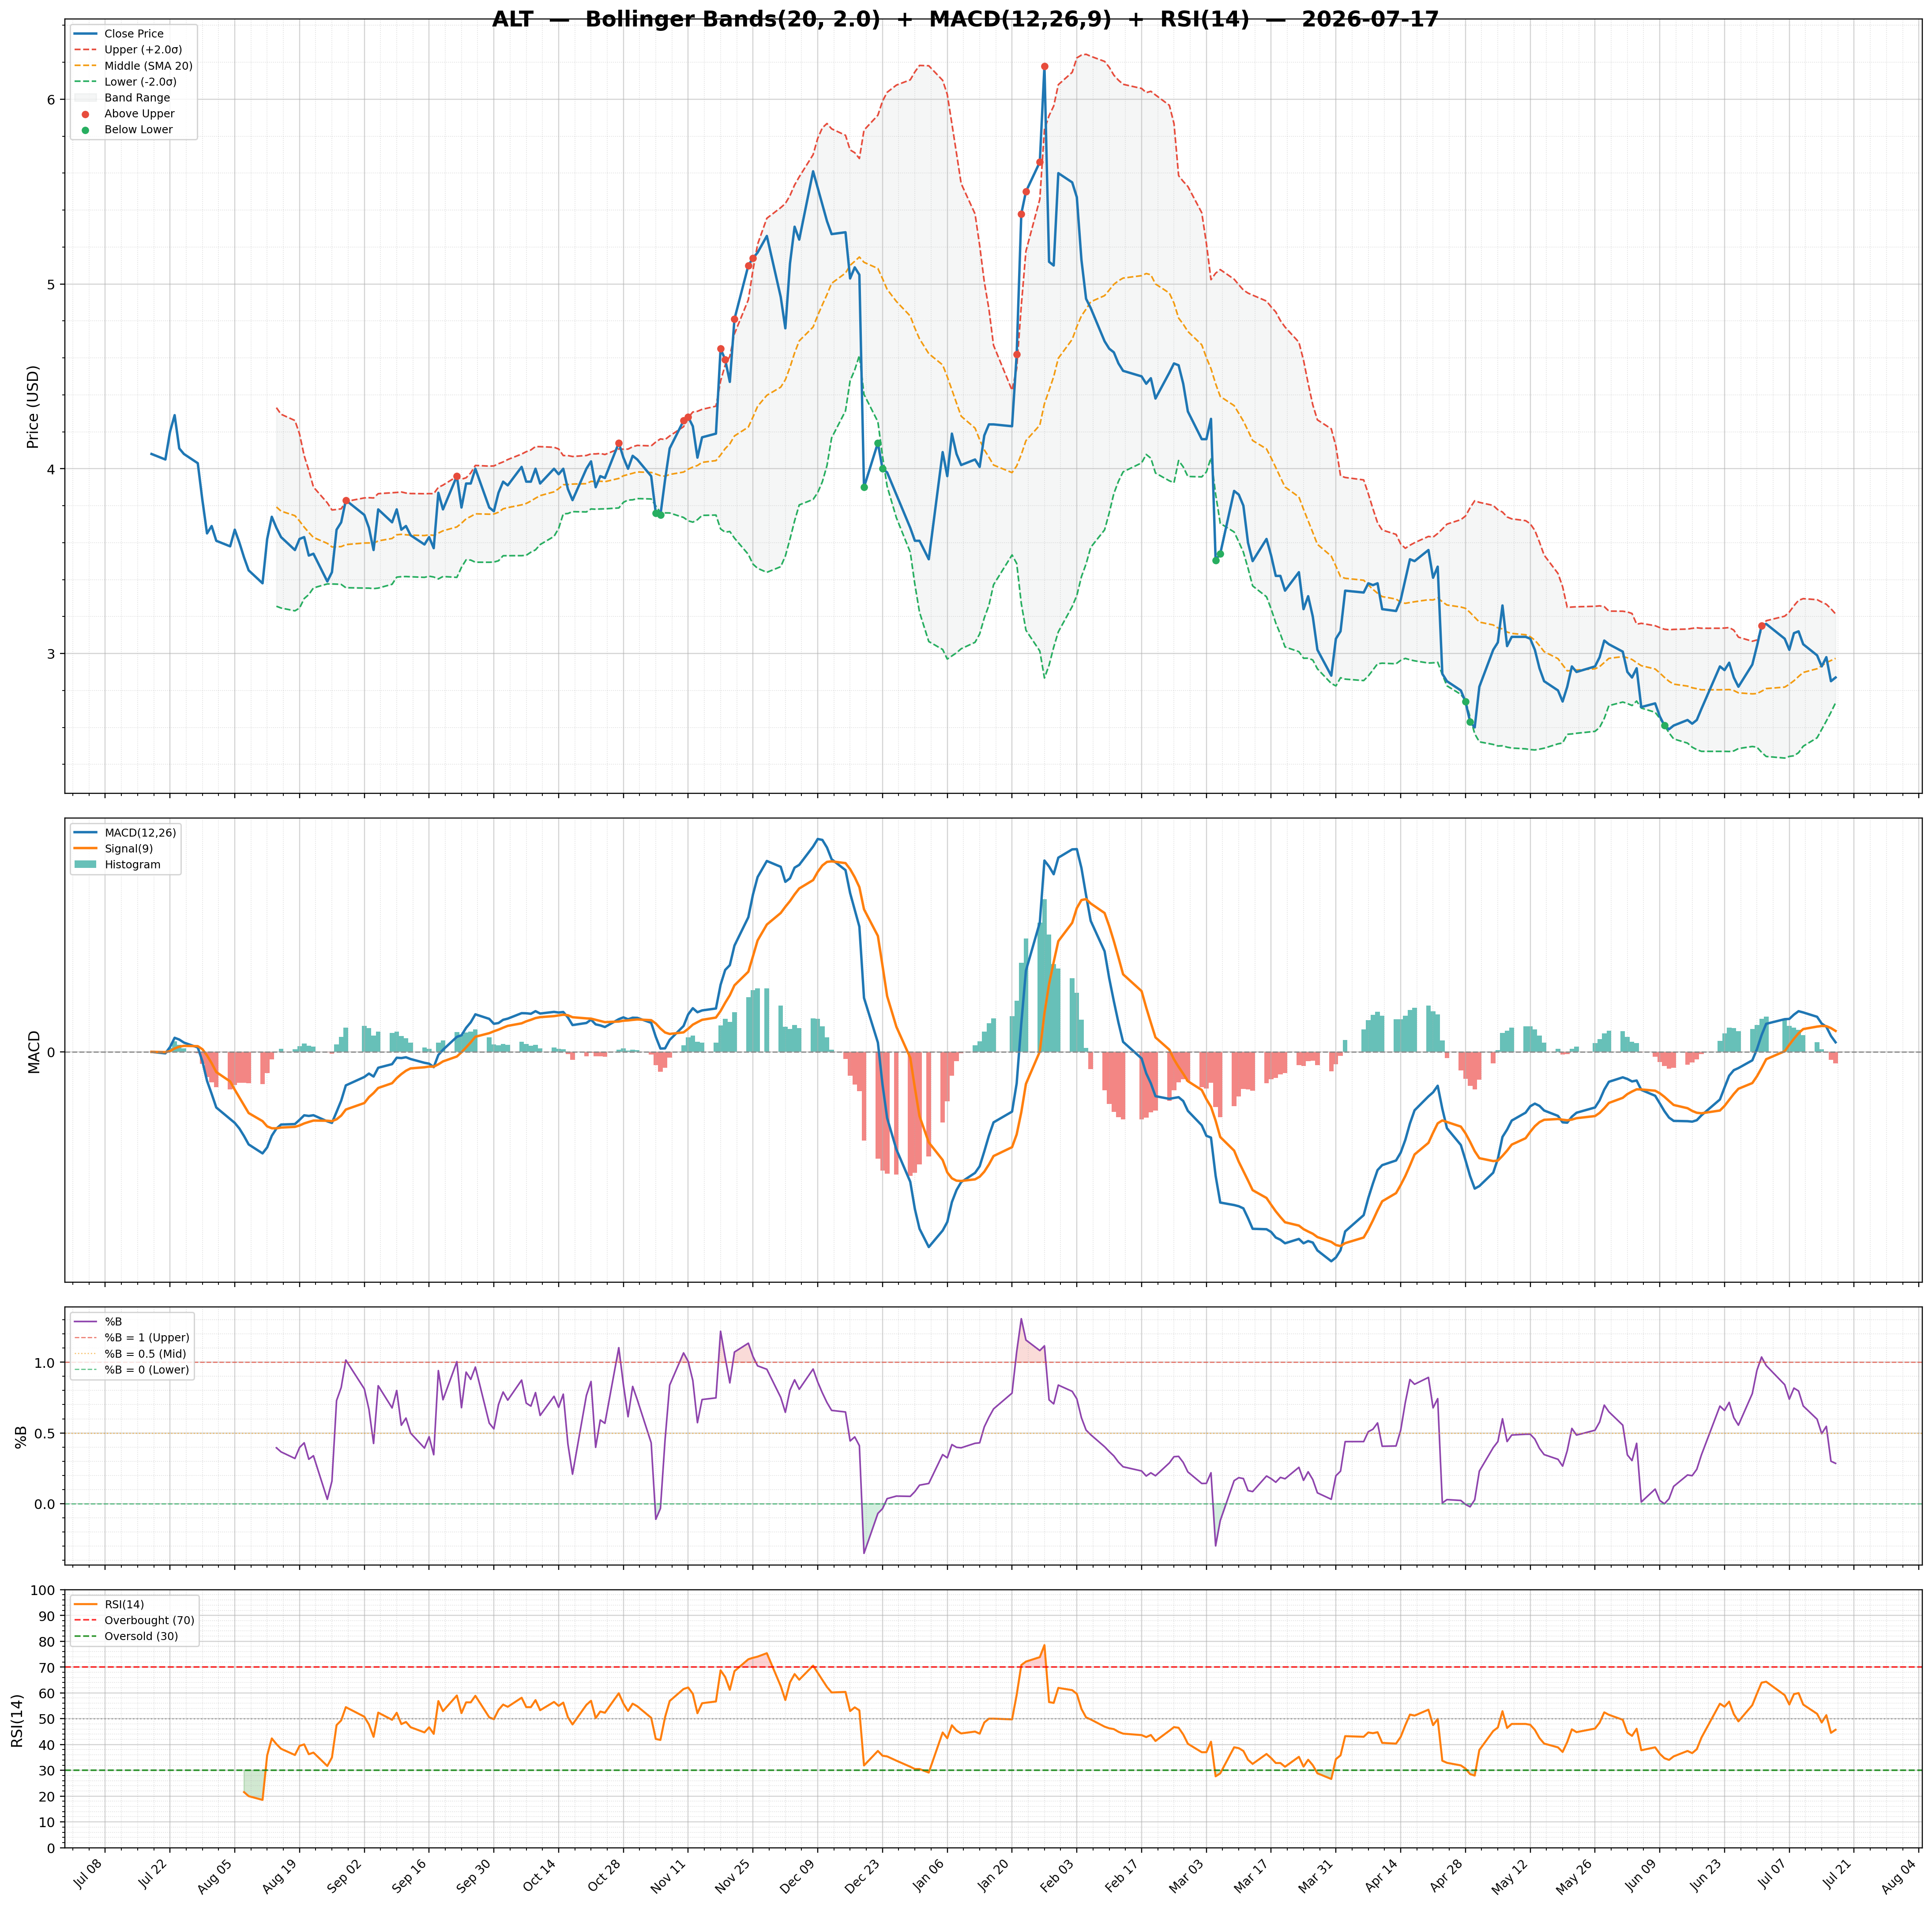
| 2026-07-17 | ALT | 2.87 | / | 7.80% | buy | 2,962,450/4,898,365 | 16.17/0.28 | 45.72/-0.0200 | -0.25 | 0.02/0.03 | Chart 3M 🌐 |
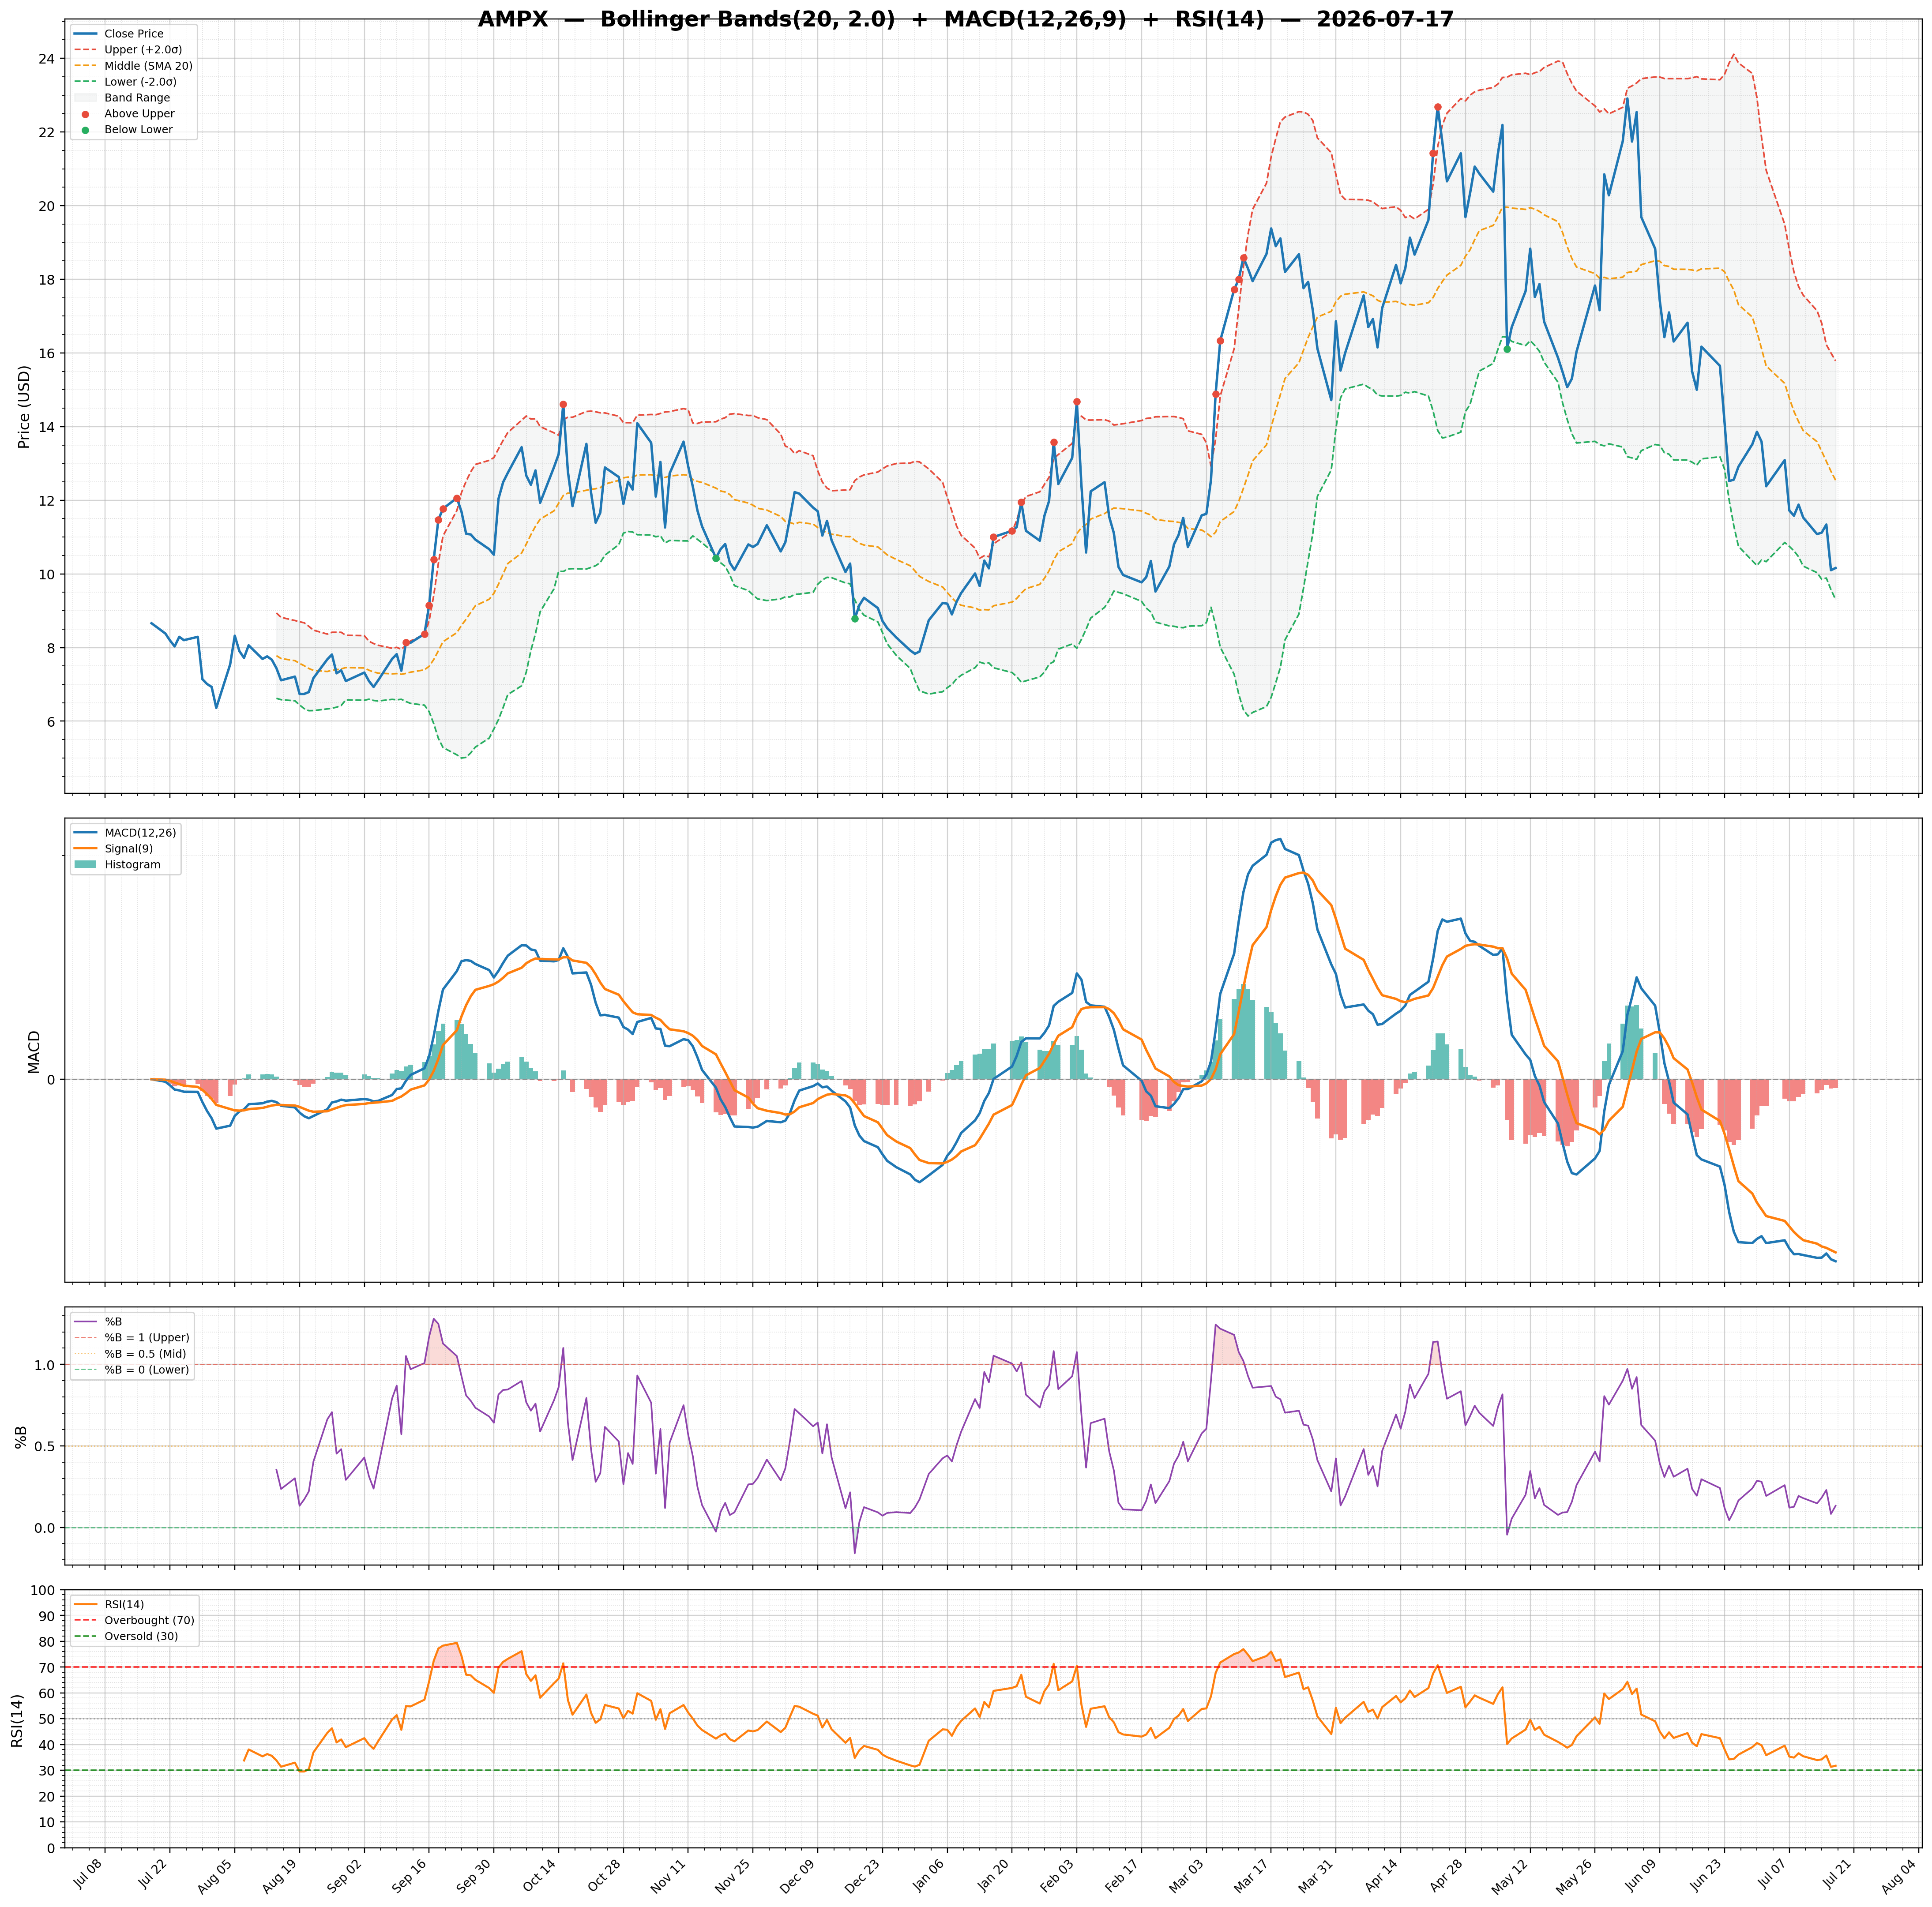
| 2026-07-17 | AMPX | 10.16 | / | 22.96% | strong_buy | 5,345,148/7,420,917 | 51.66/0.13 | 31.78/-0.0800 | -0.20 | -1.63/-1.55 | Chart 3M 🌐 |
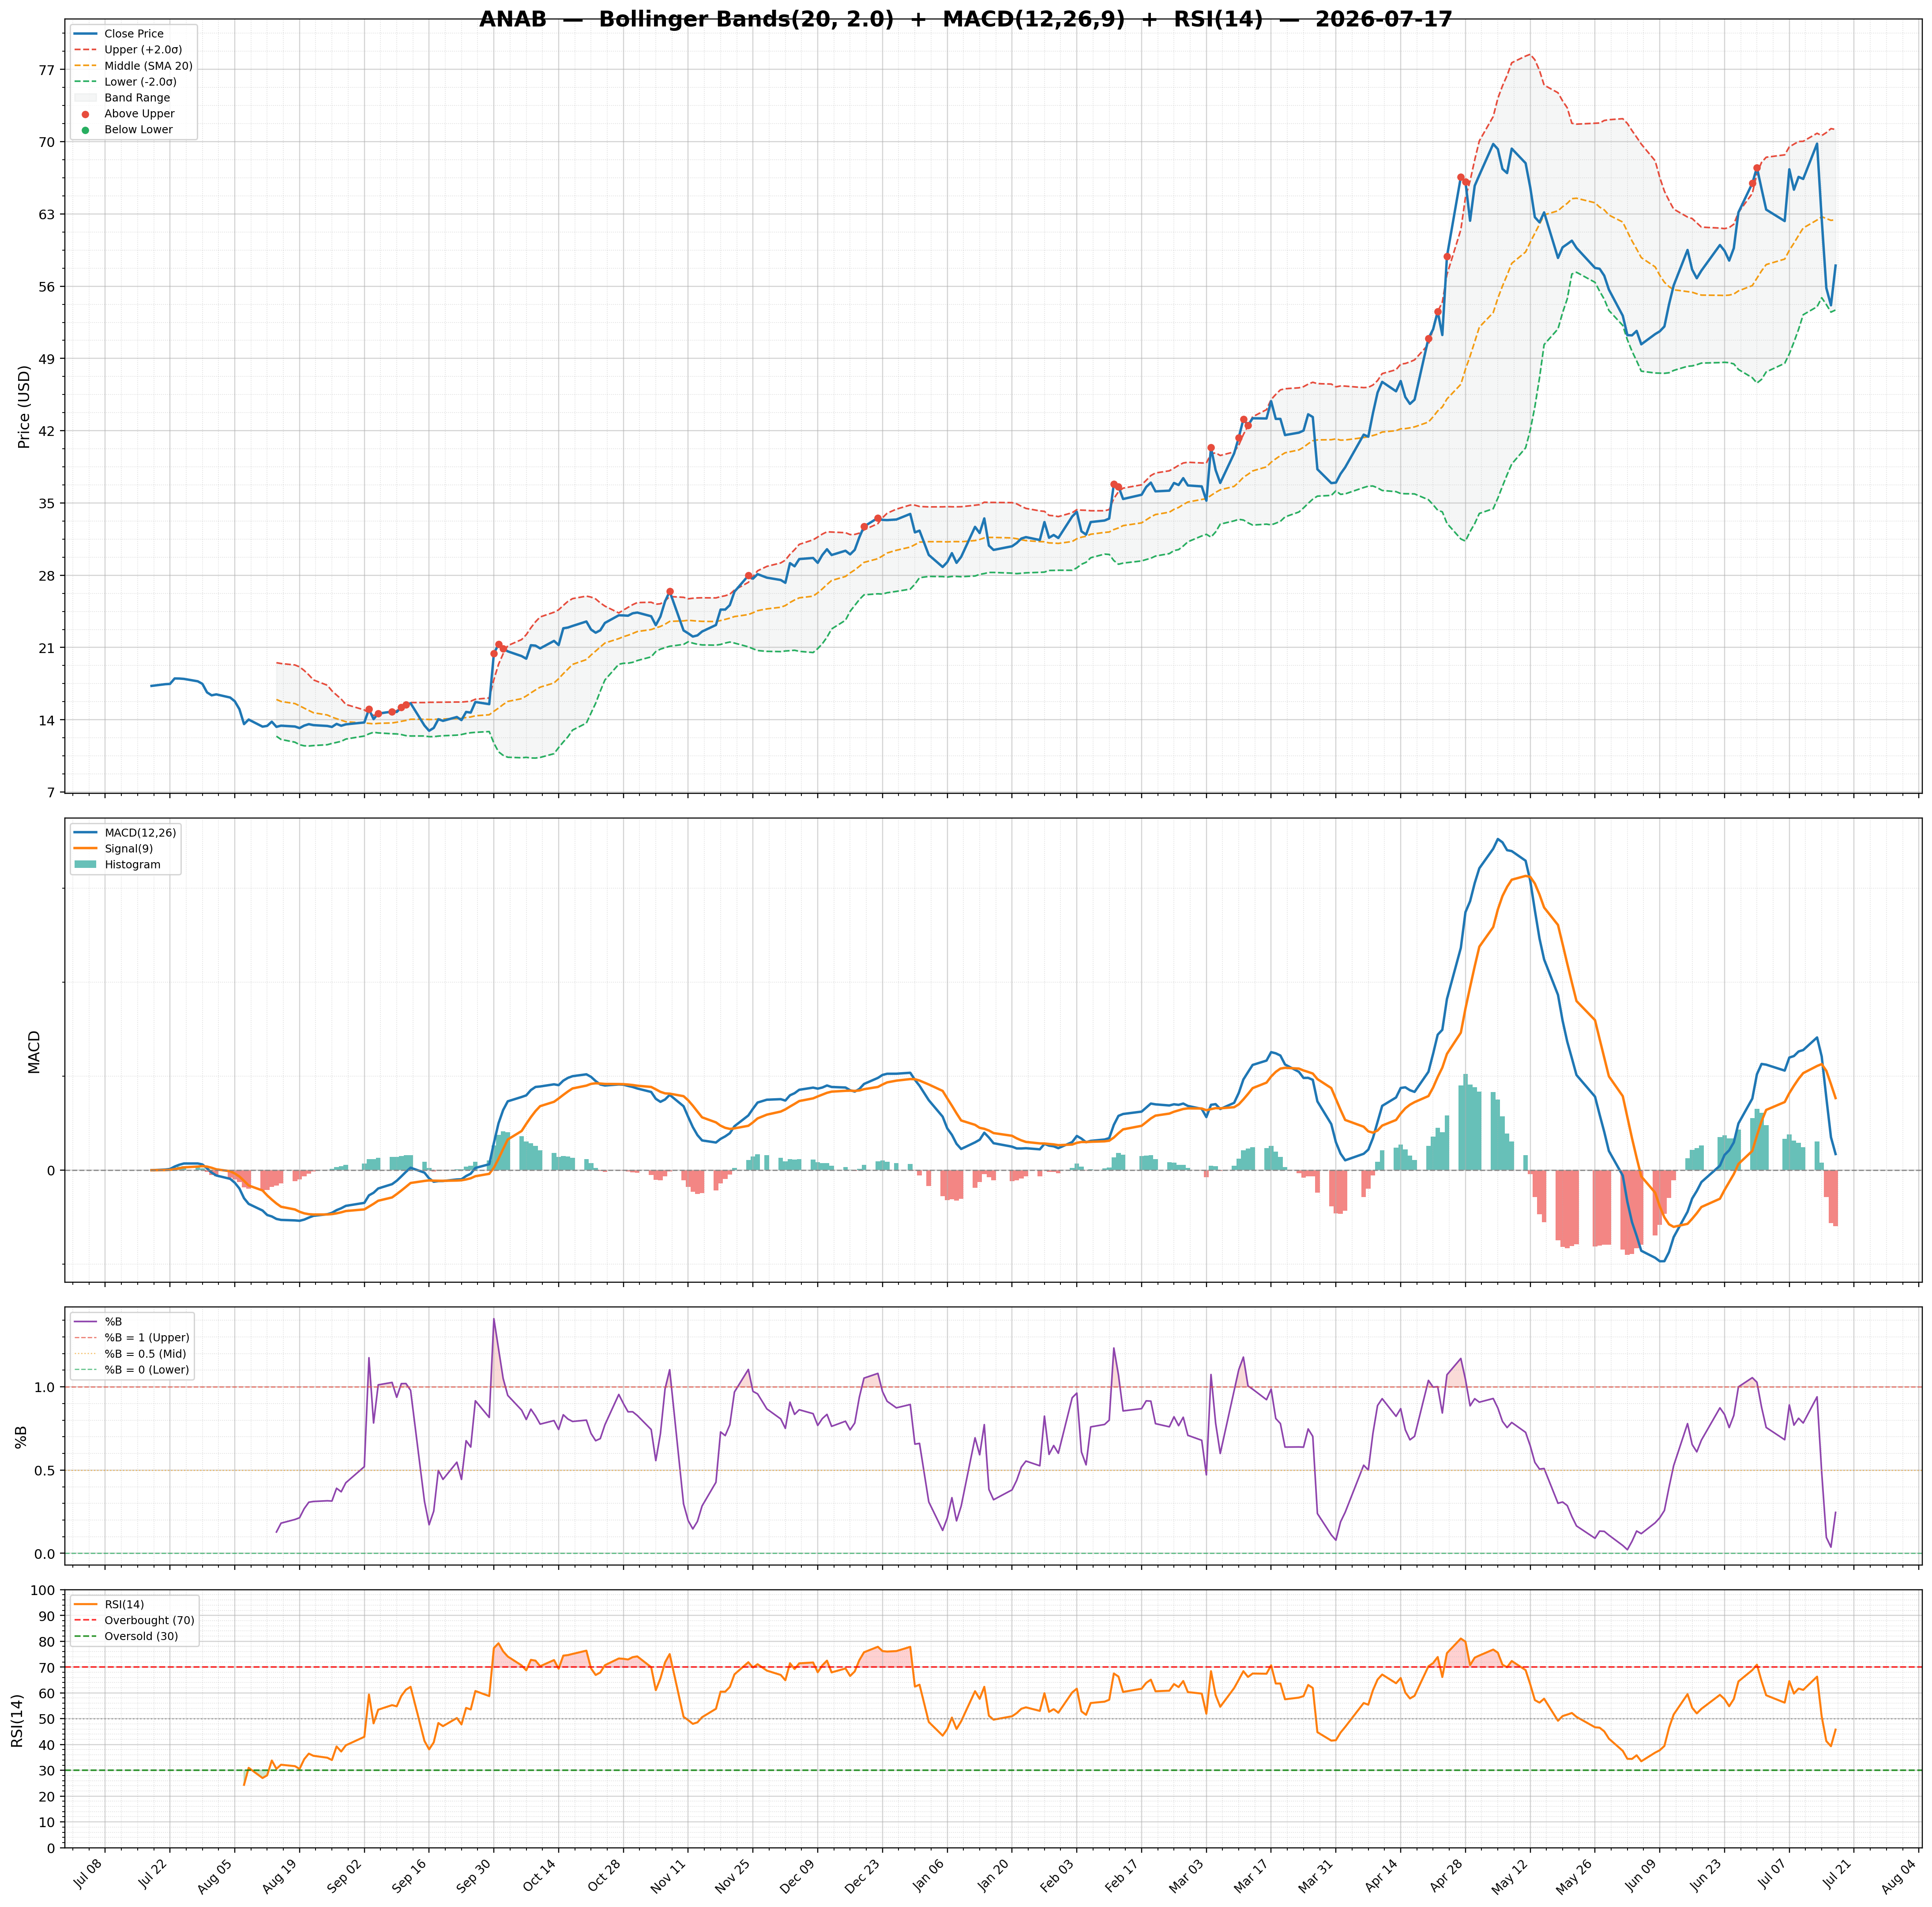
| 2026-07-17 | ANAB | 58.00 | / | 79.24% | strong_buy | 727,387/773,434 | 28.00/0.25 | 45.78/-1.1900 | 1.08 | 0.34/1.53 | Chart 3M 🌐 |
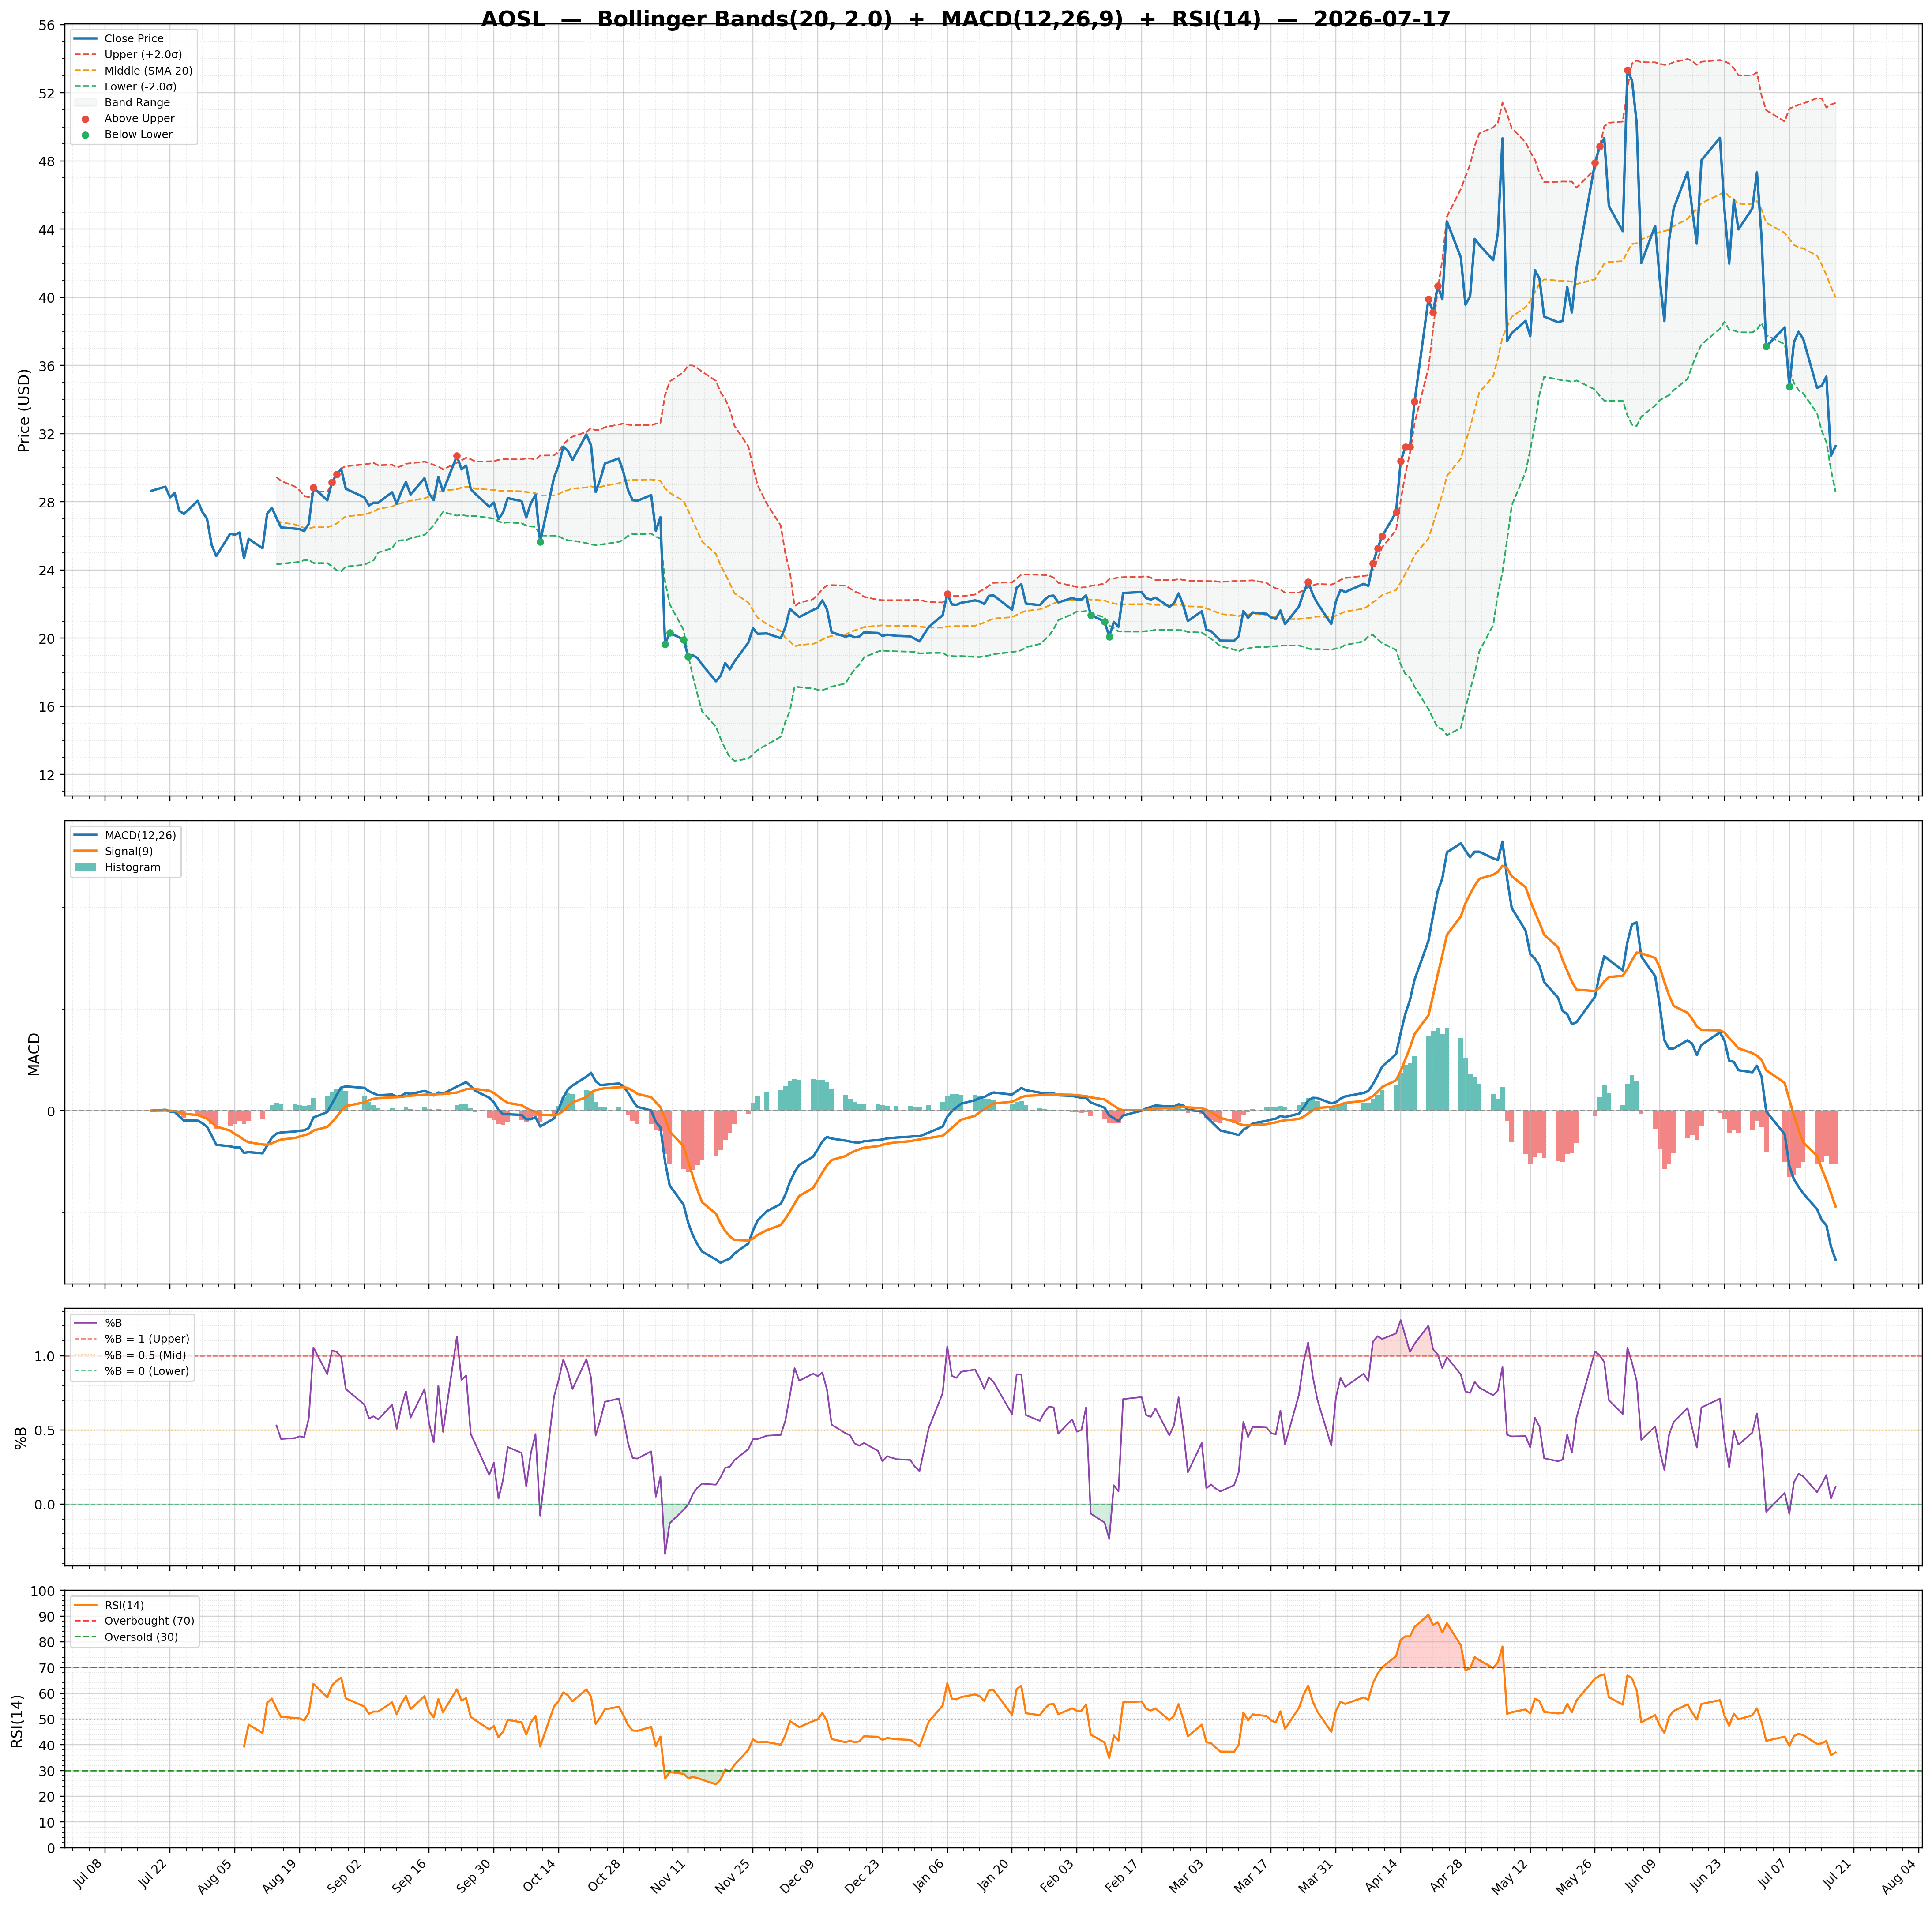
| 2026-07-17 | AOSL | 31.27 | / | 38.49% | none | 870,290/832,110 | 57.05/0.12 | 37.05/-1.0400 | 0.11 | -2.93/-1.89 | Chart 3M 🌐 |
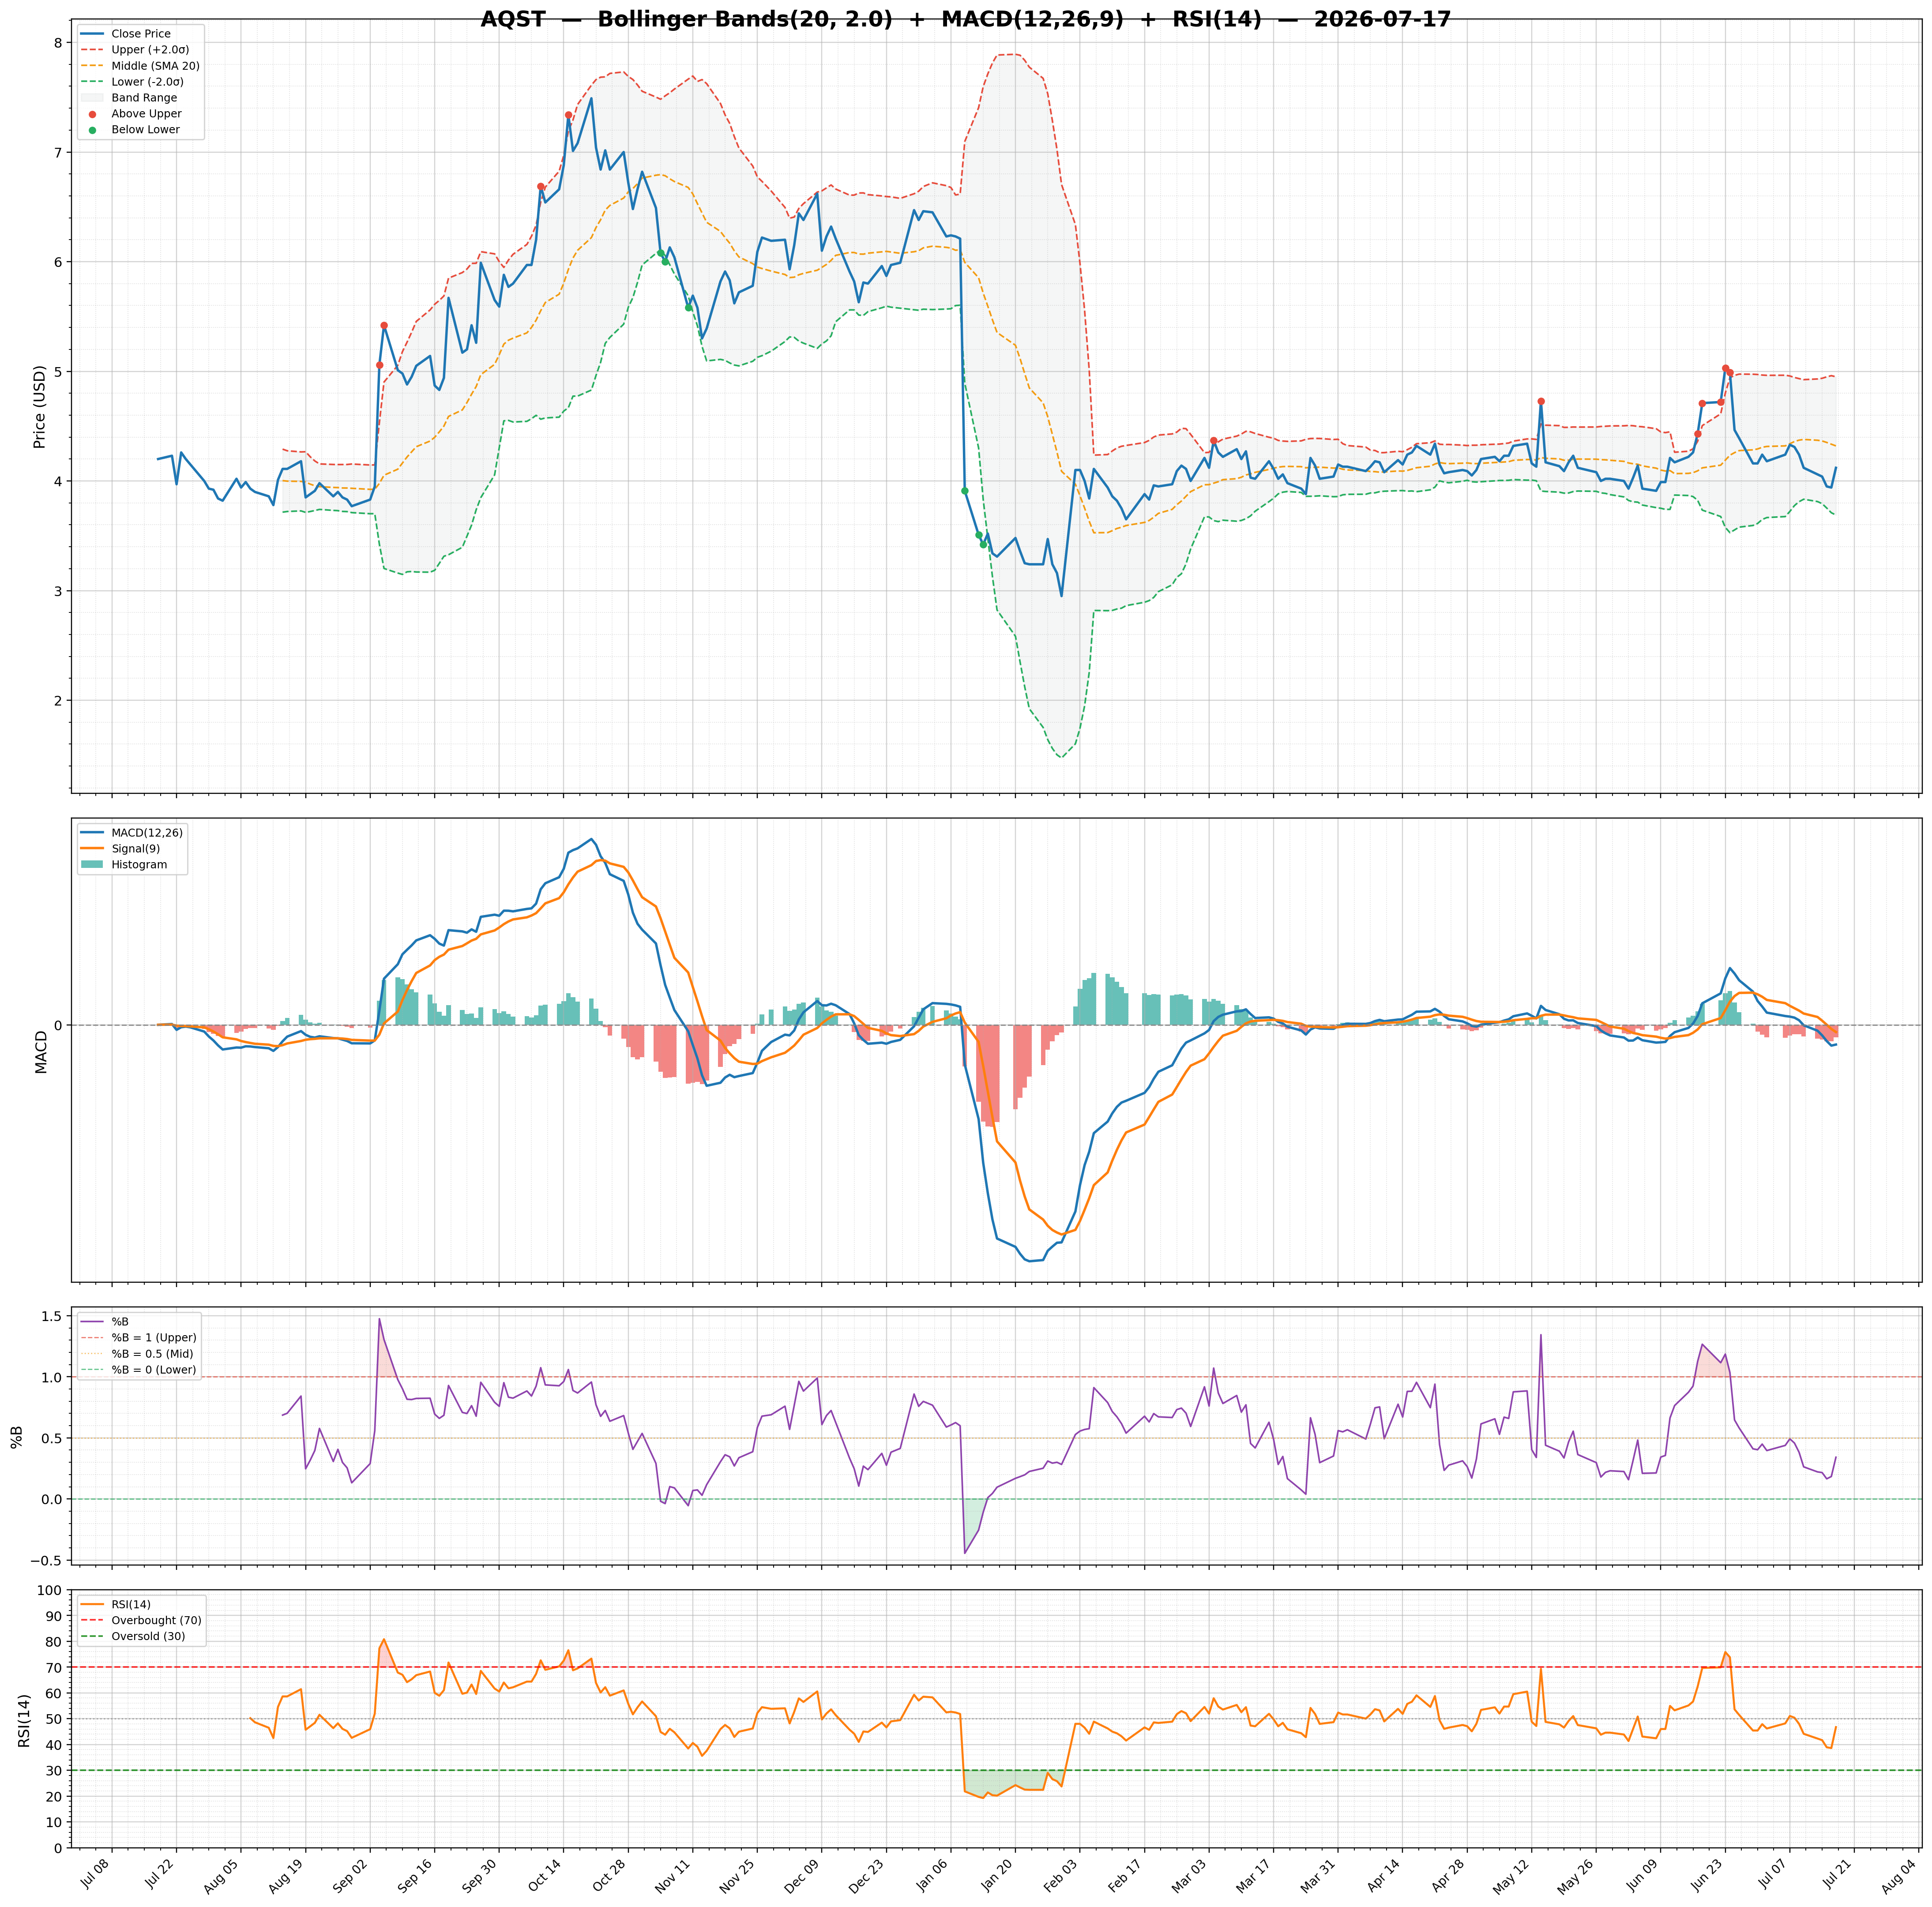
| 2026-07-17 | AQST | 4.12 | / | 25.77% | none | 2,348,118/2,365,806 | 29.19/0.34 | 46.75/-0.0400 | -0.06 | -0.06/-0.02 | Chart 3M 🌐 |
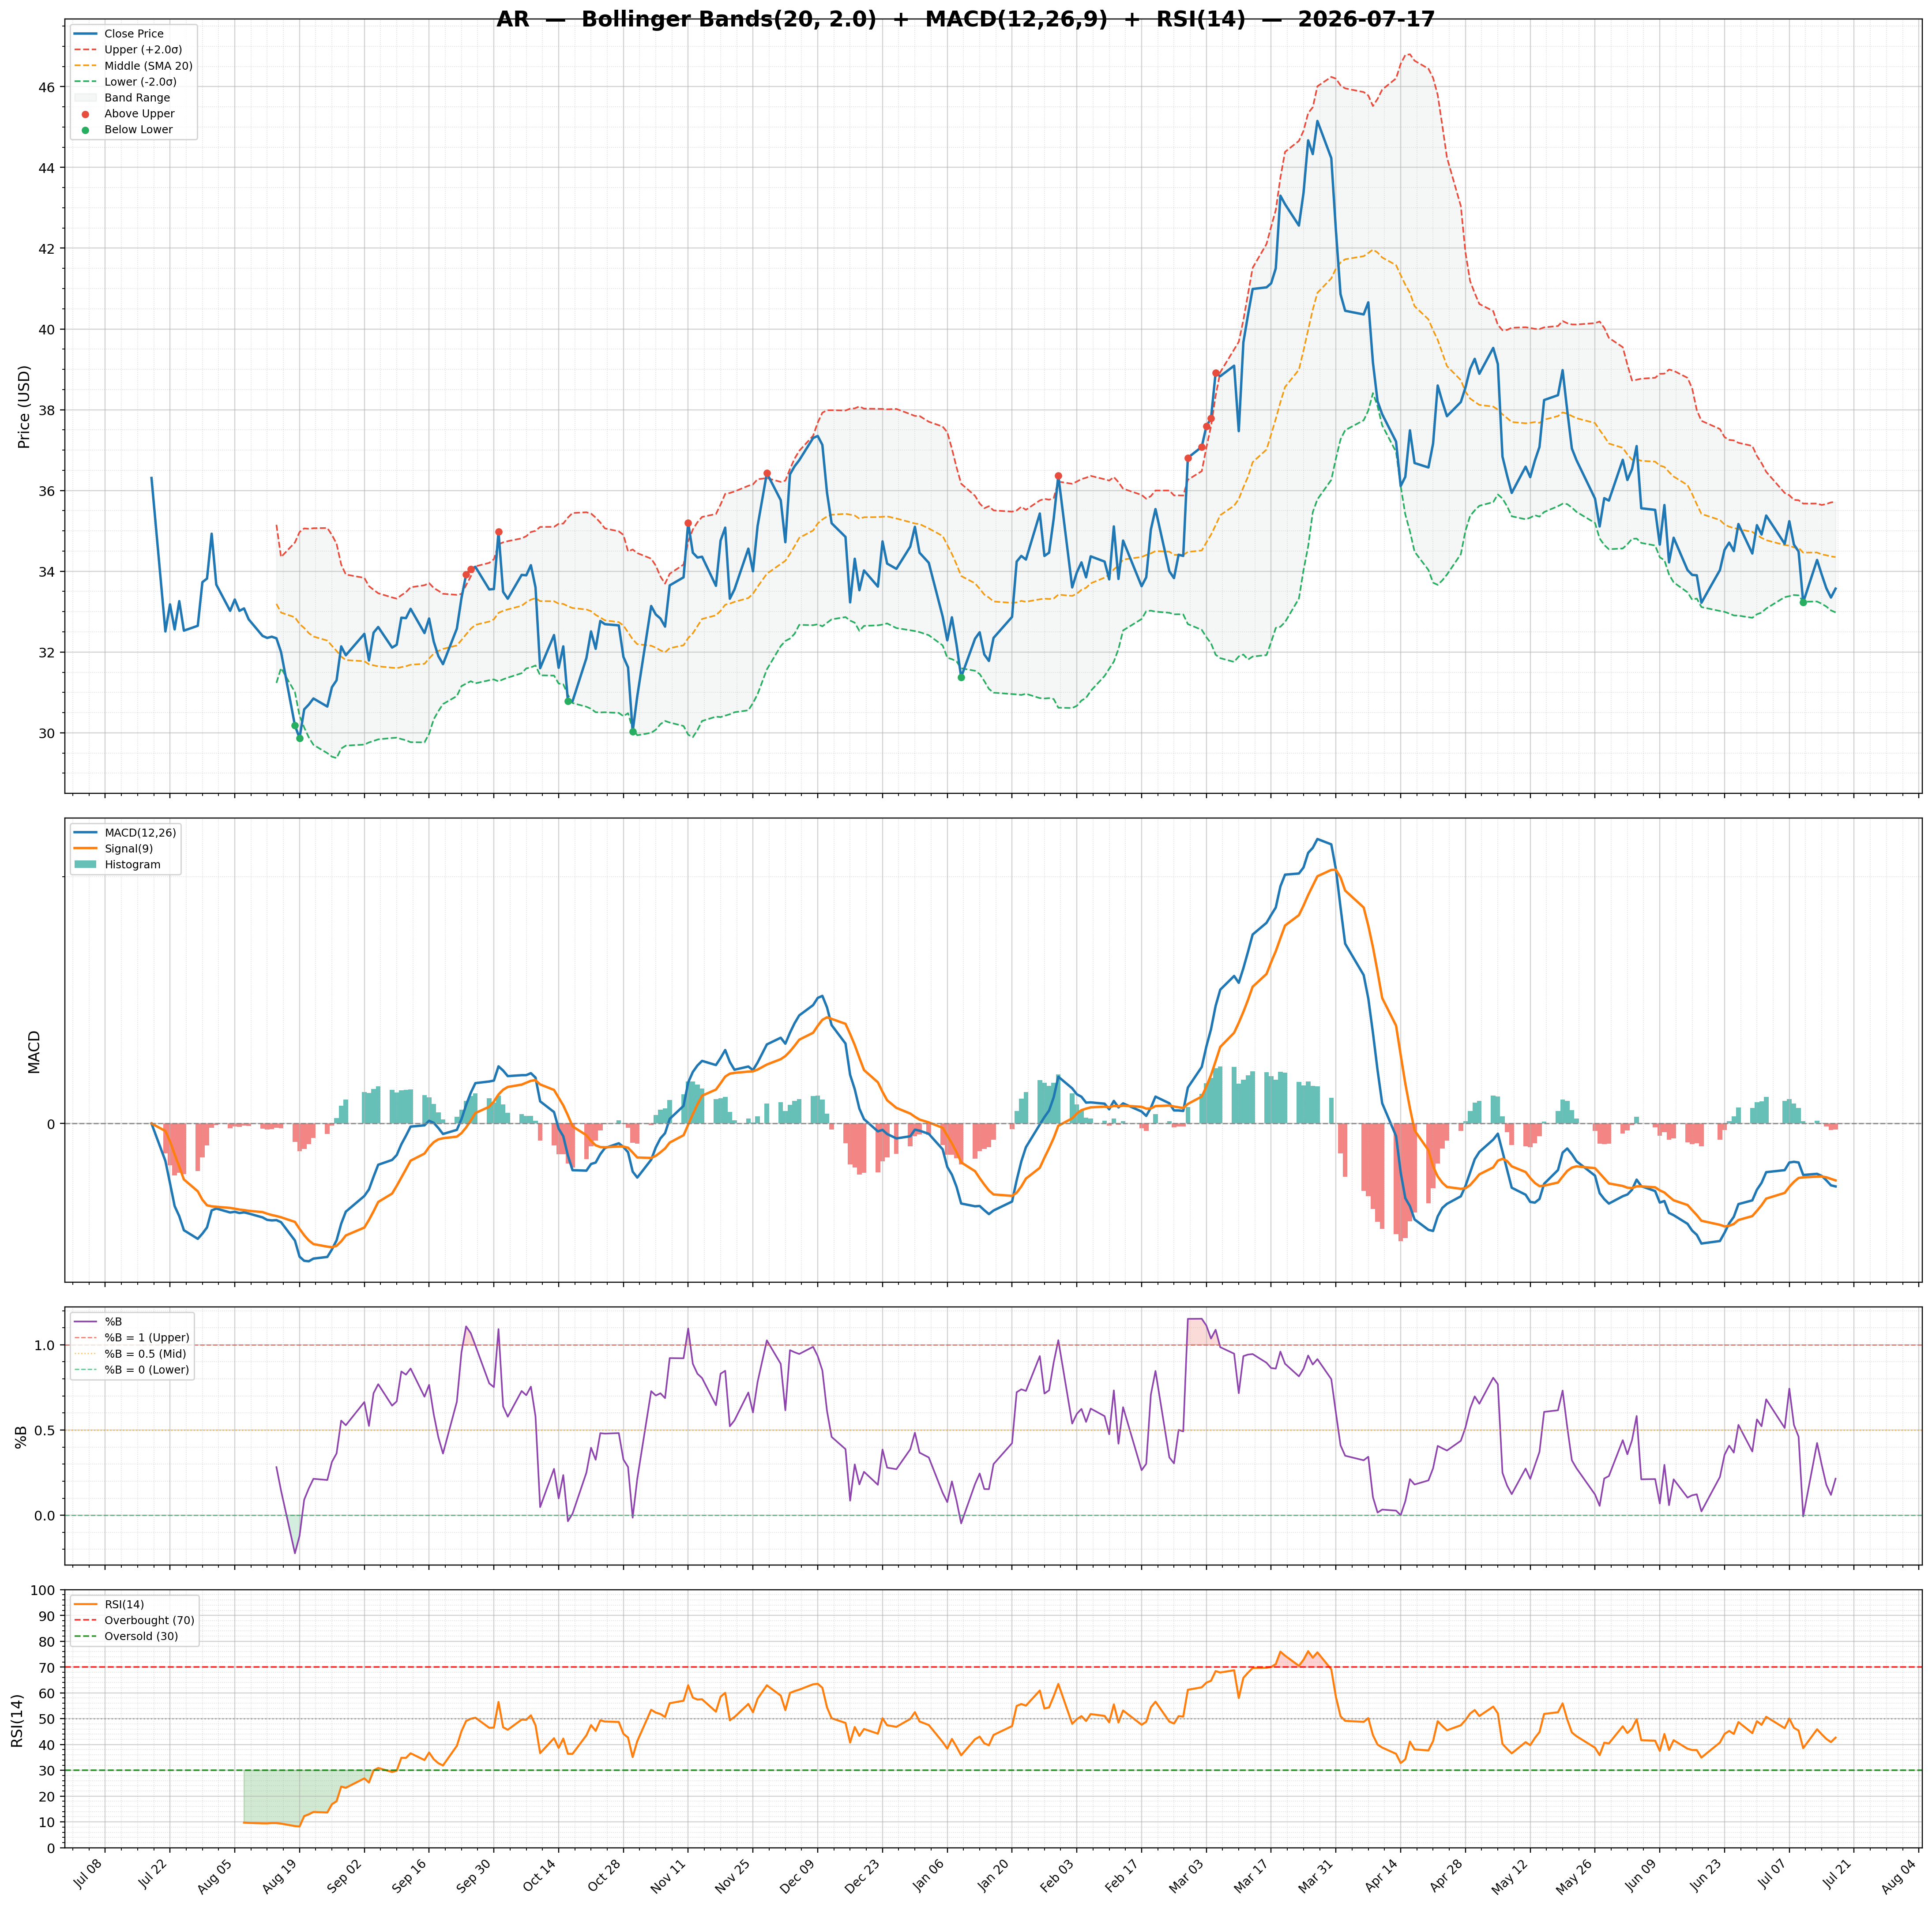
| 2026-07-17 | AR | 33.57 | / | 24.21% | buy | 4,454,388/4,837,319 | 7.97/0.22 | 42.65/-0.0500 | -0.01 | -0.51/-0.46 | Chart 3M 🌐 |
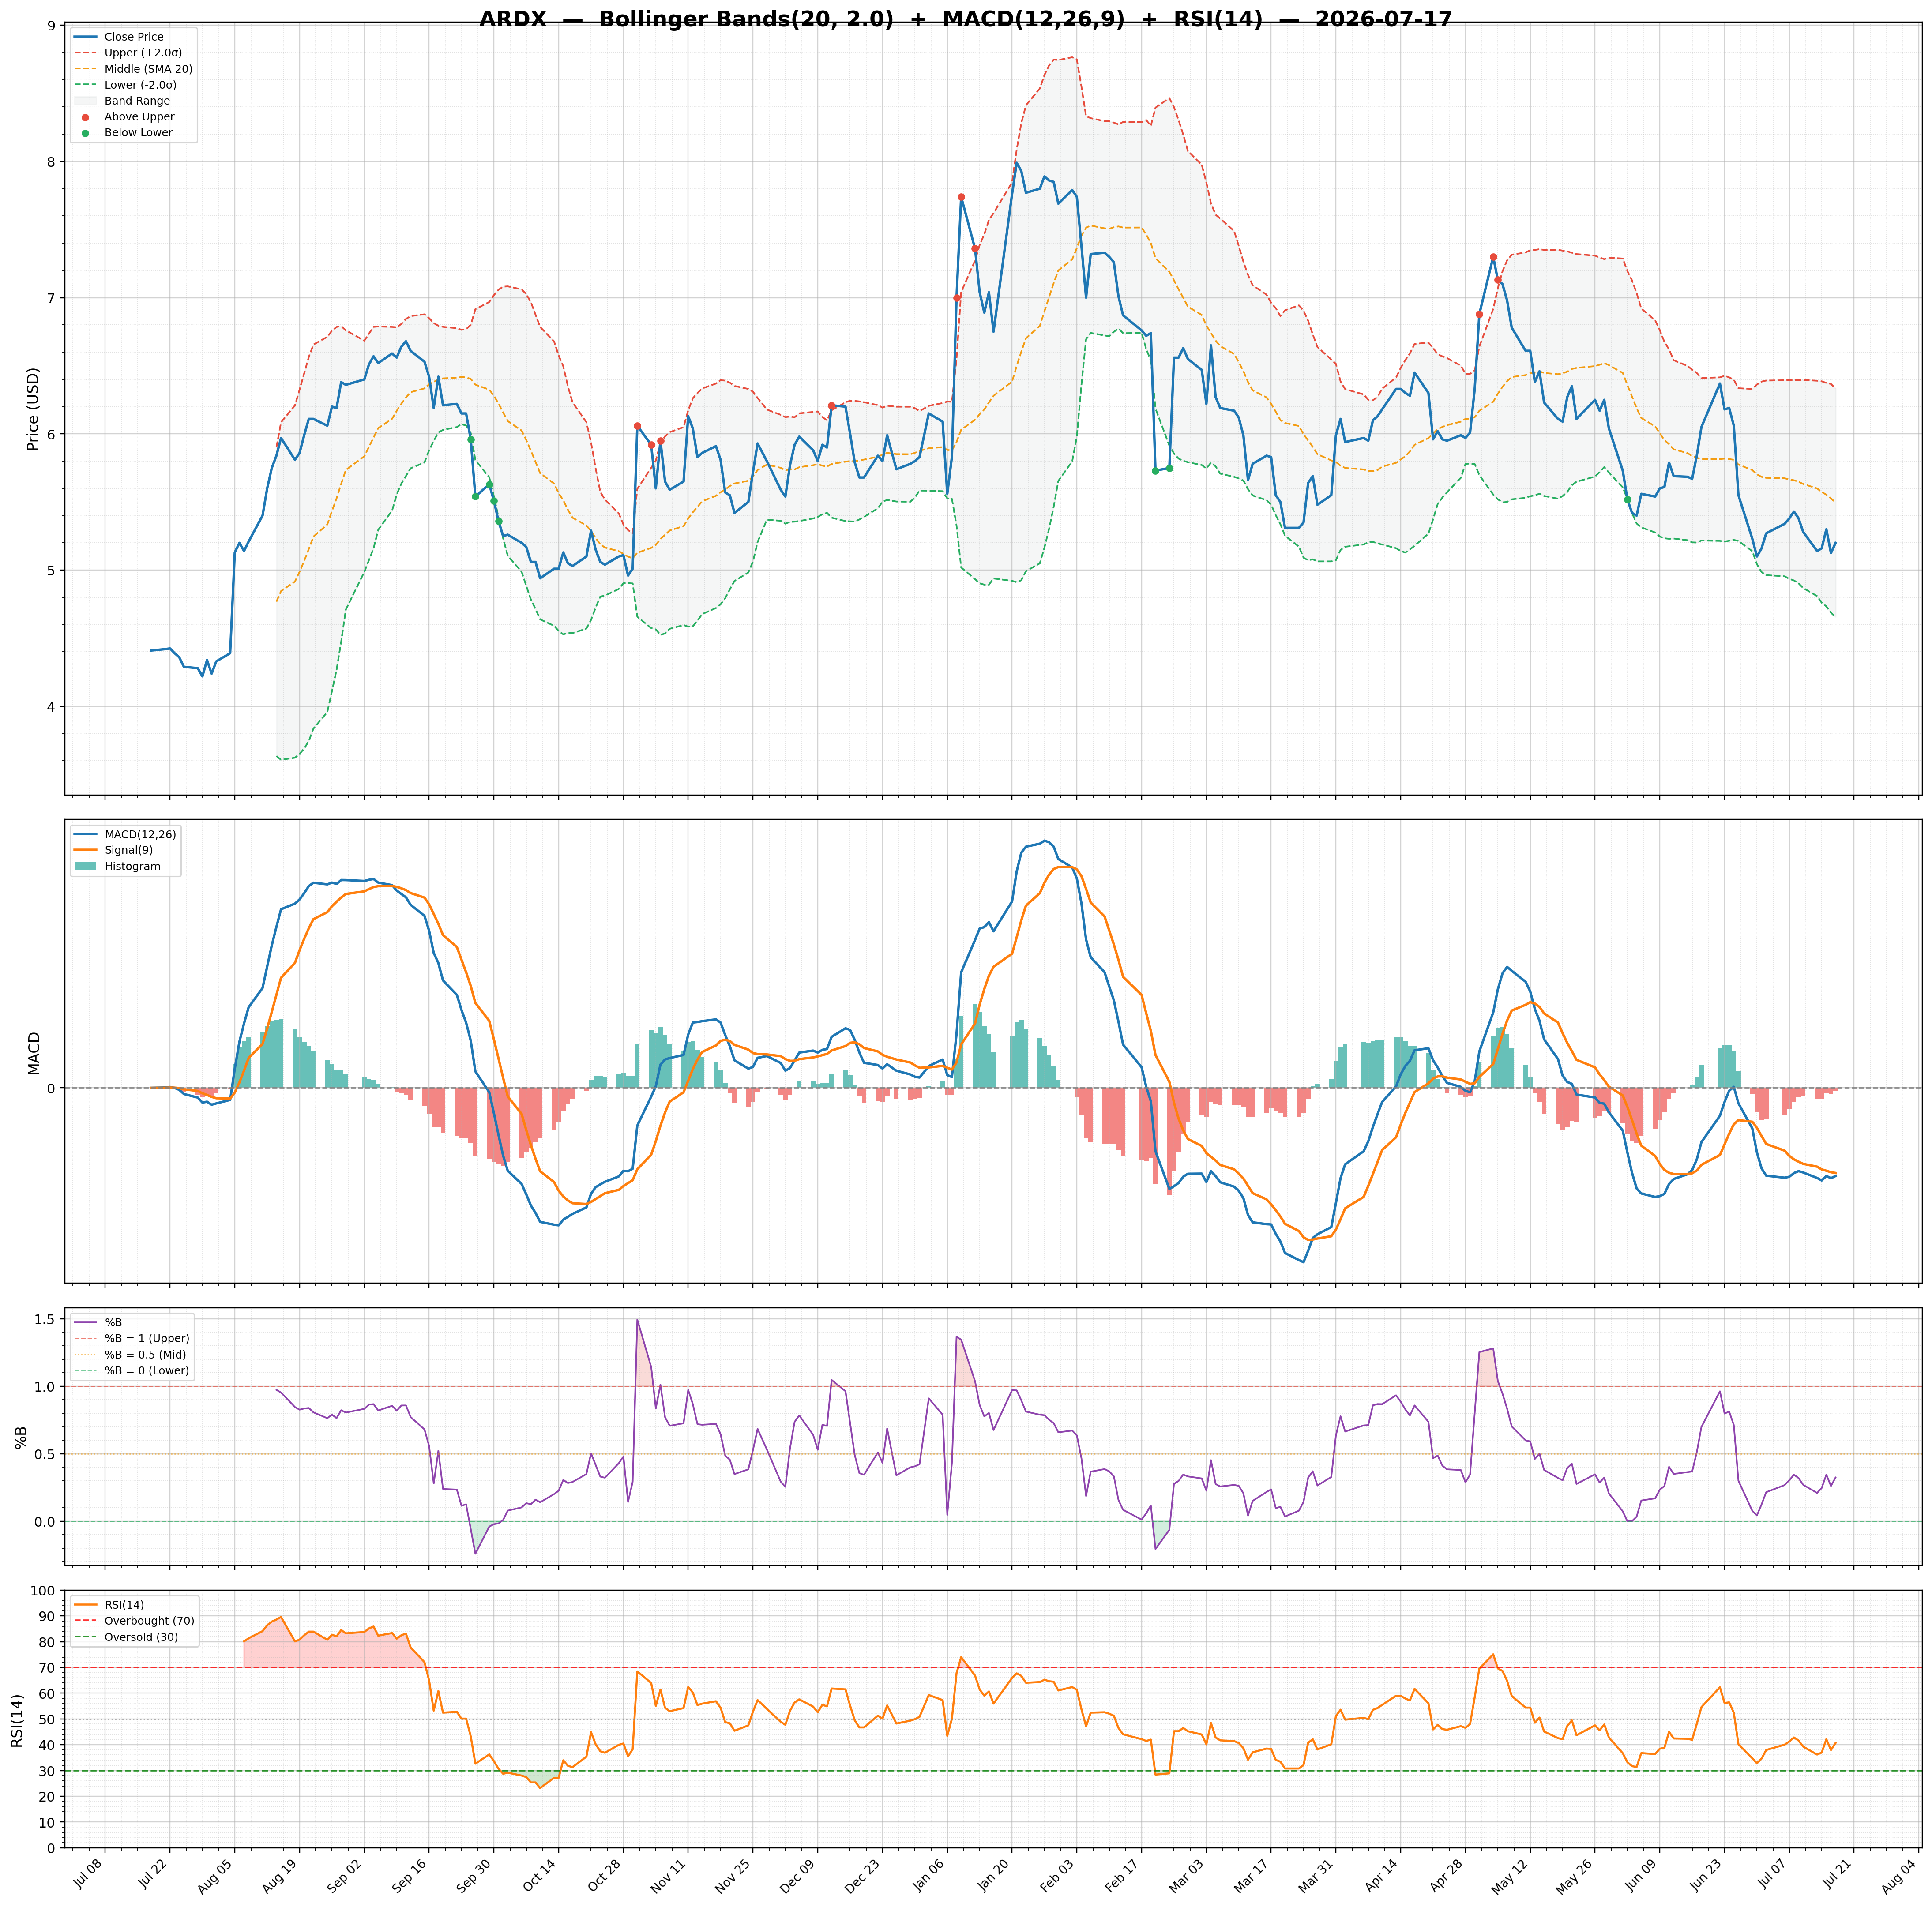
| 2026-07-17 | ARDX | 5.20 | / | 25.99% | strong_buy | 3,260,404/4,768,580 | 30.51/0.32 | 40.67/-0.0100 | -0.07 | -0.18/-0.18 | Chart 3M 🌐 |
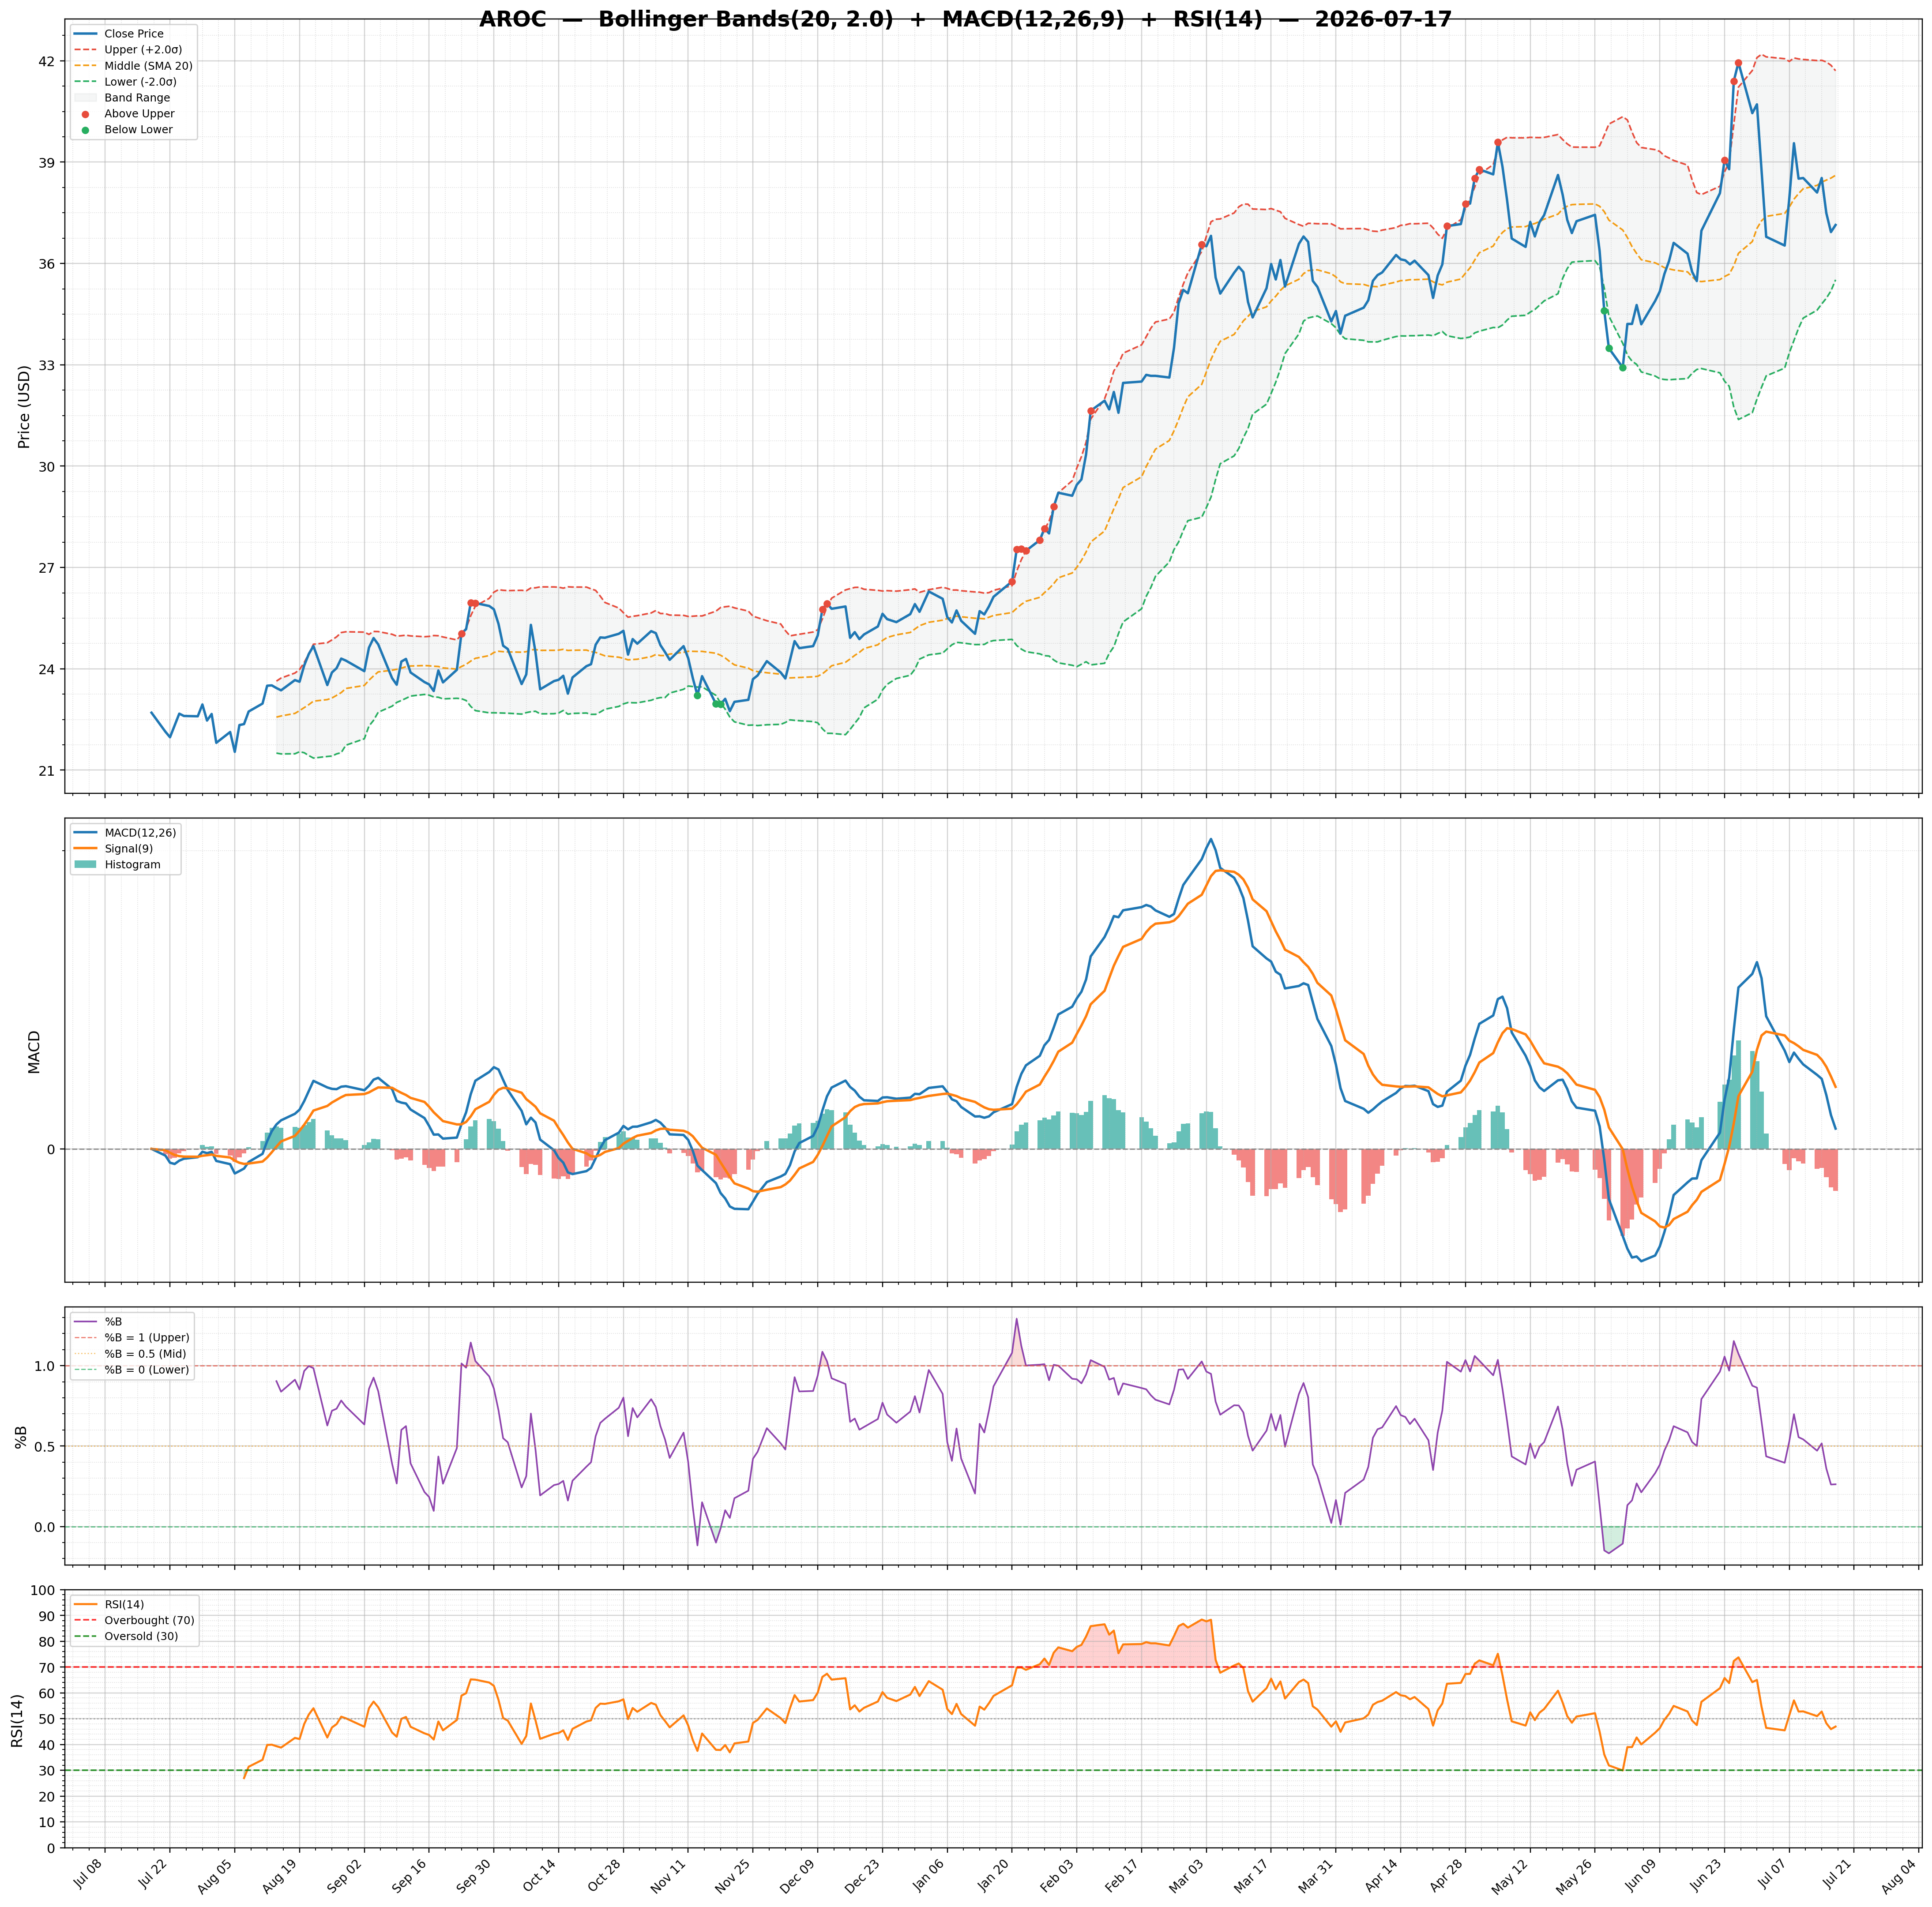
| 2026-07-17 | AROC | 37.14 | / | 76.43% | strong_buy | 749,502/2,335,380 | 16.03/0.26 | 46.96/-0.2800 | 0.35 | 0.14/0.42 | Chart 3M 🌐 |
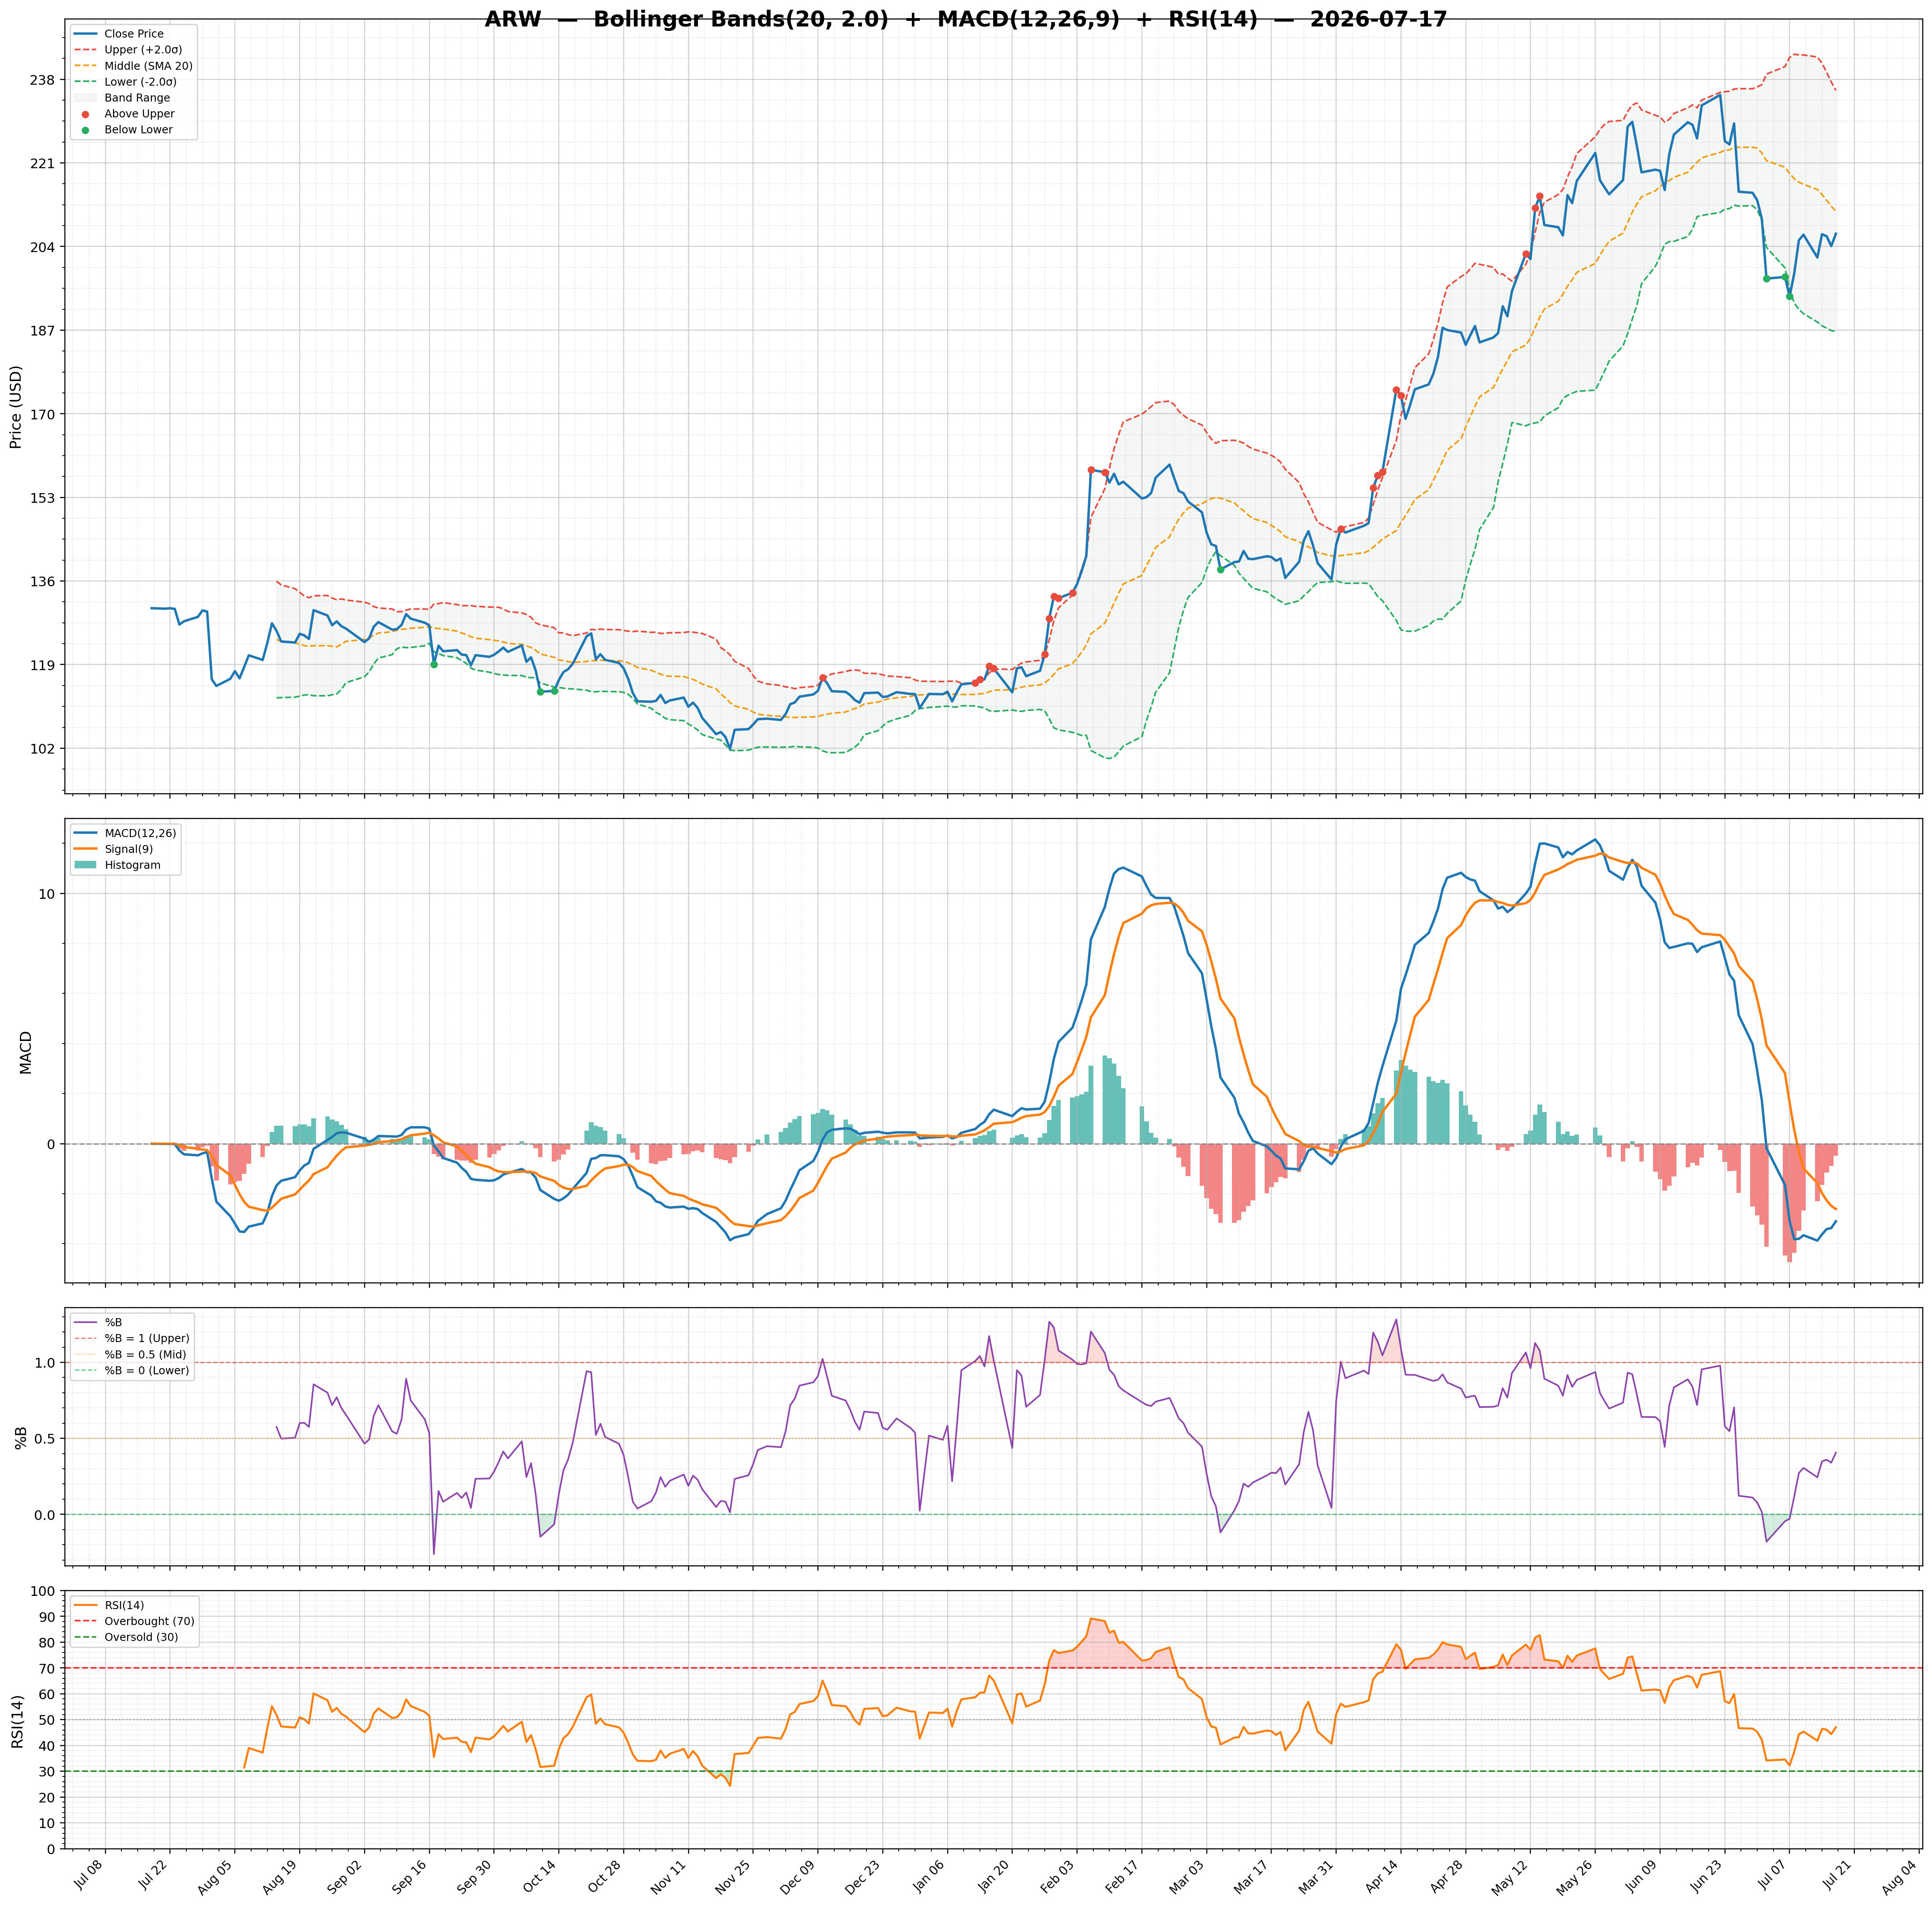
| 2026-07-17 | ARW | 206.61 | / | 78.78% | none | 351,822/628,736 | 23.22/0.41 | 47.03/-0.4900 | 0.51 | -3.10/-2.61 | Chart 3M 🌐 |
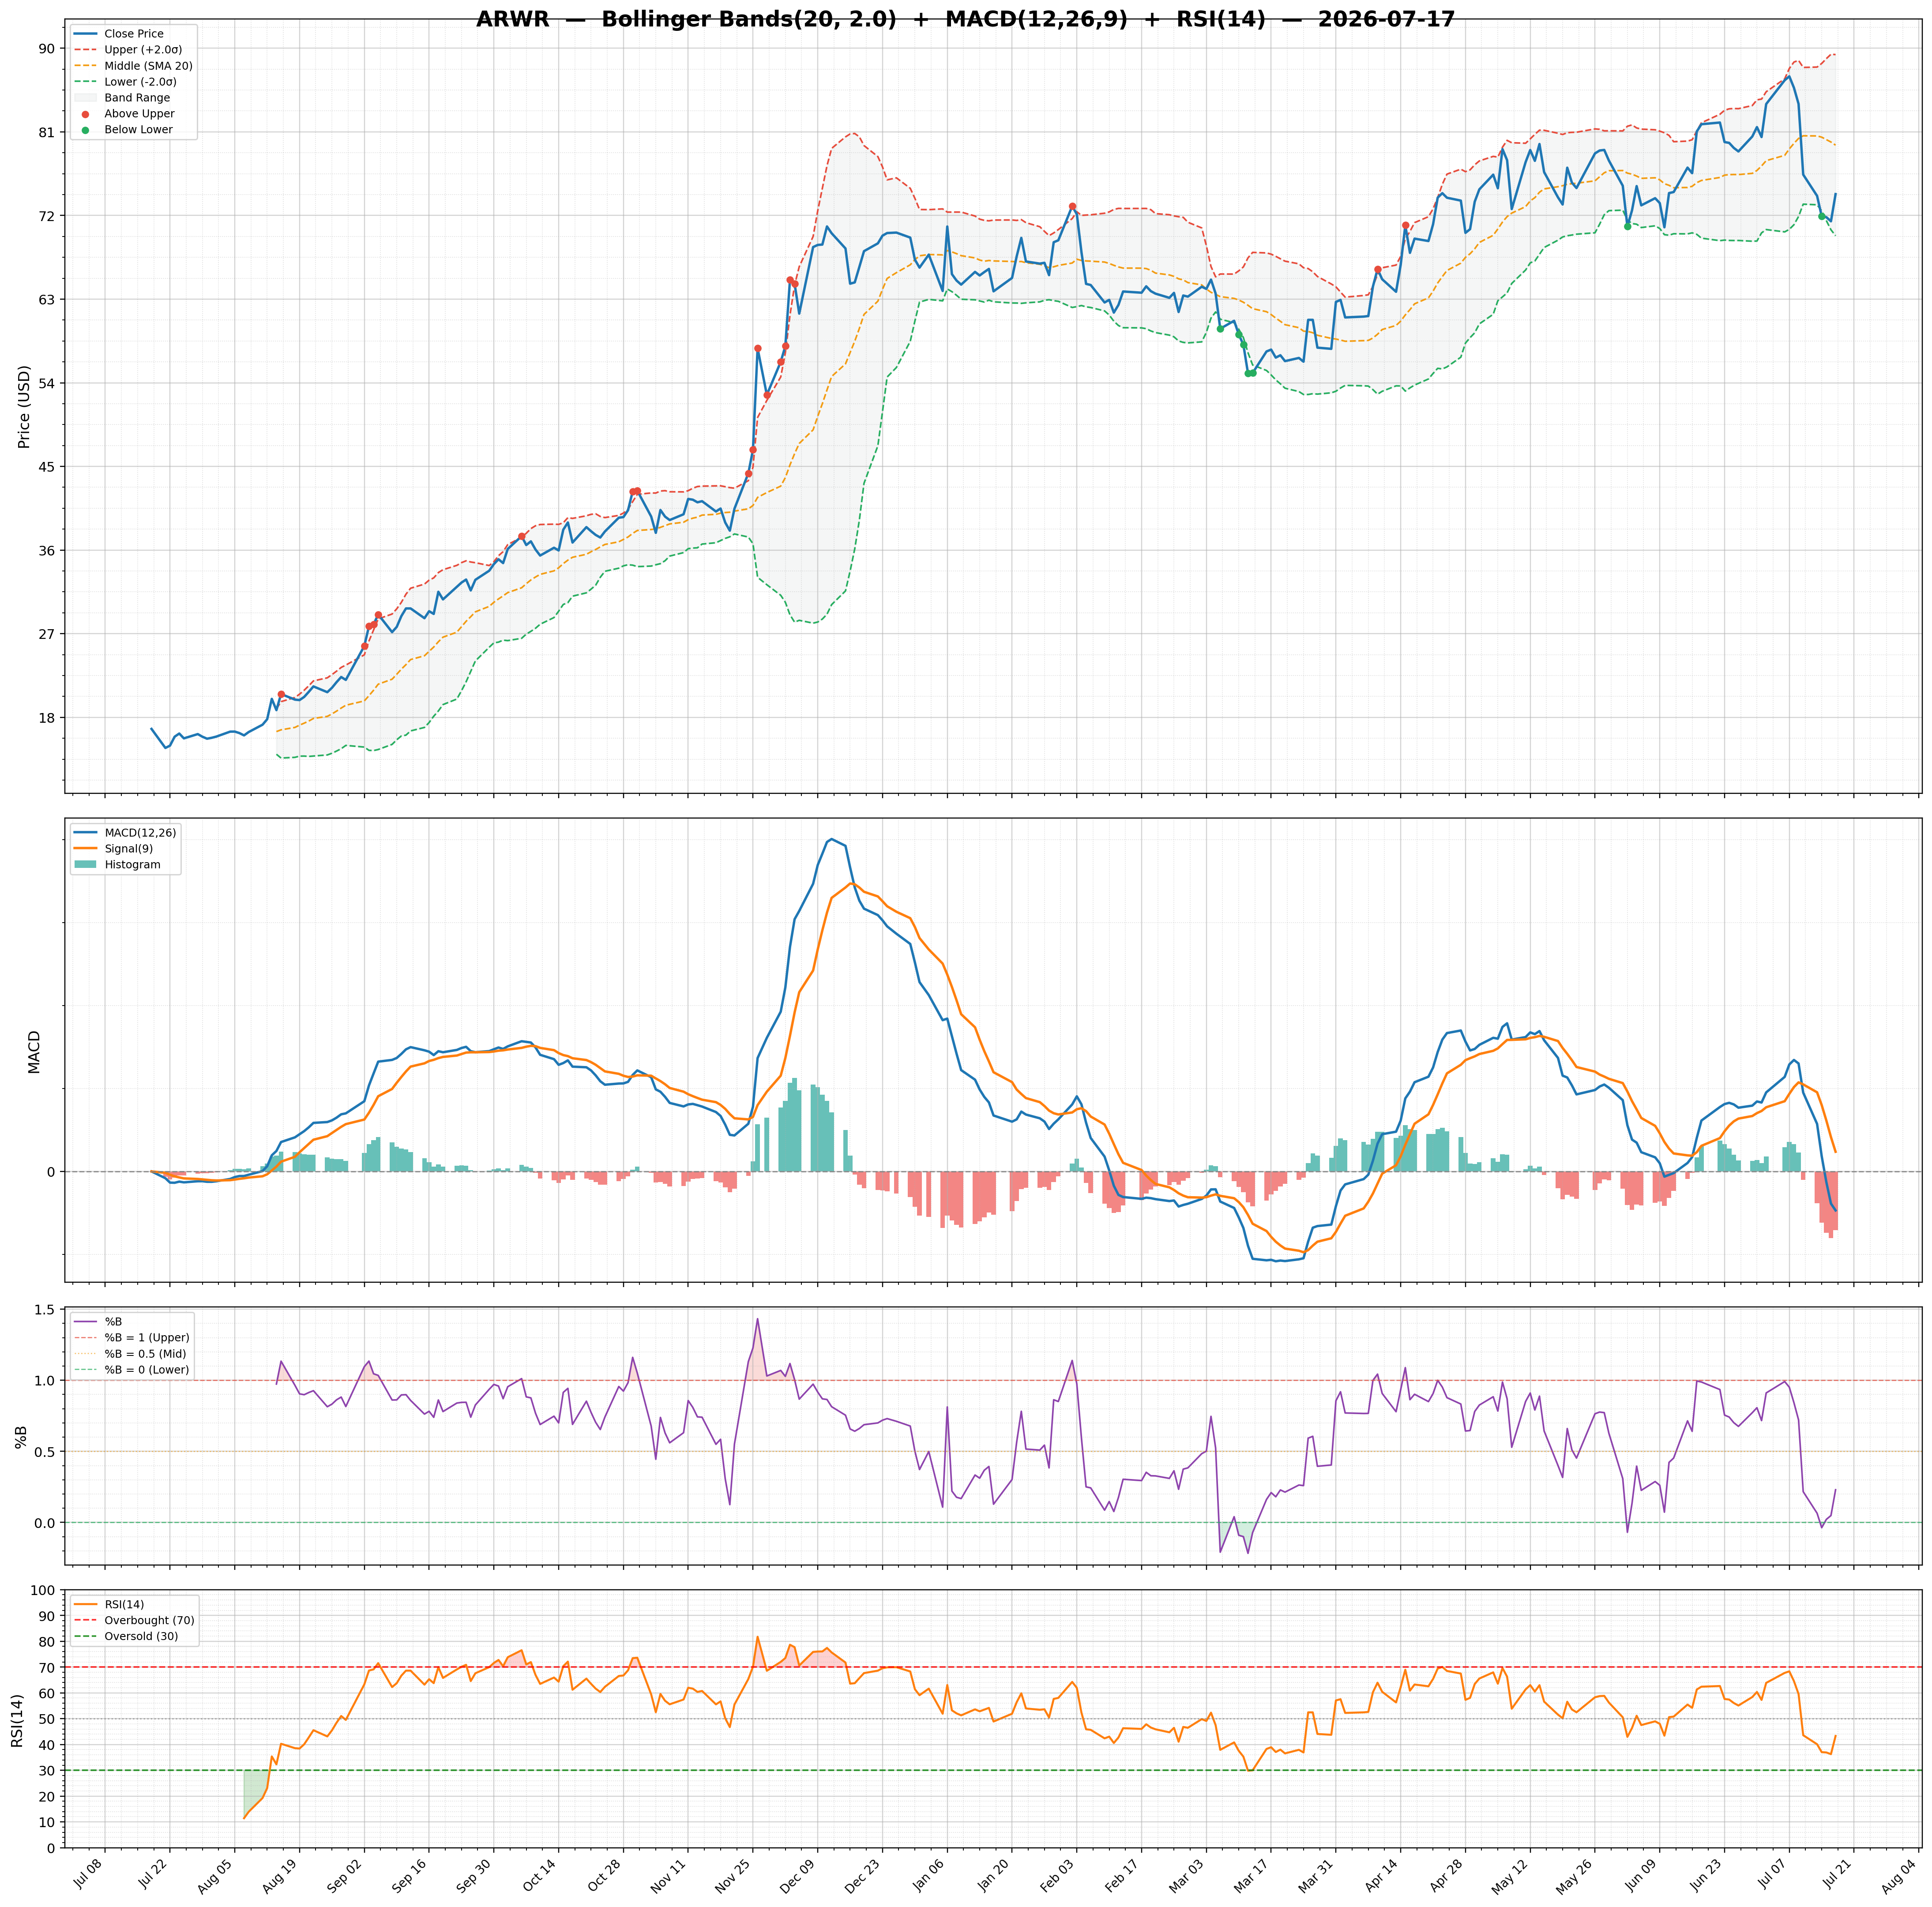
| 2026-07-17 | ARWR | 74.30 | / | 82.47% | strong_buy | 3,775,028/3,047,200 | 24.50/0.23 | 43.31/-1.4200 | 1.09 | -0.94/0.47 | Chart 3M 🌐 |
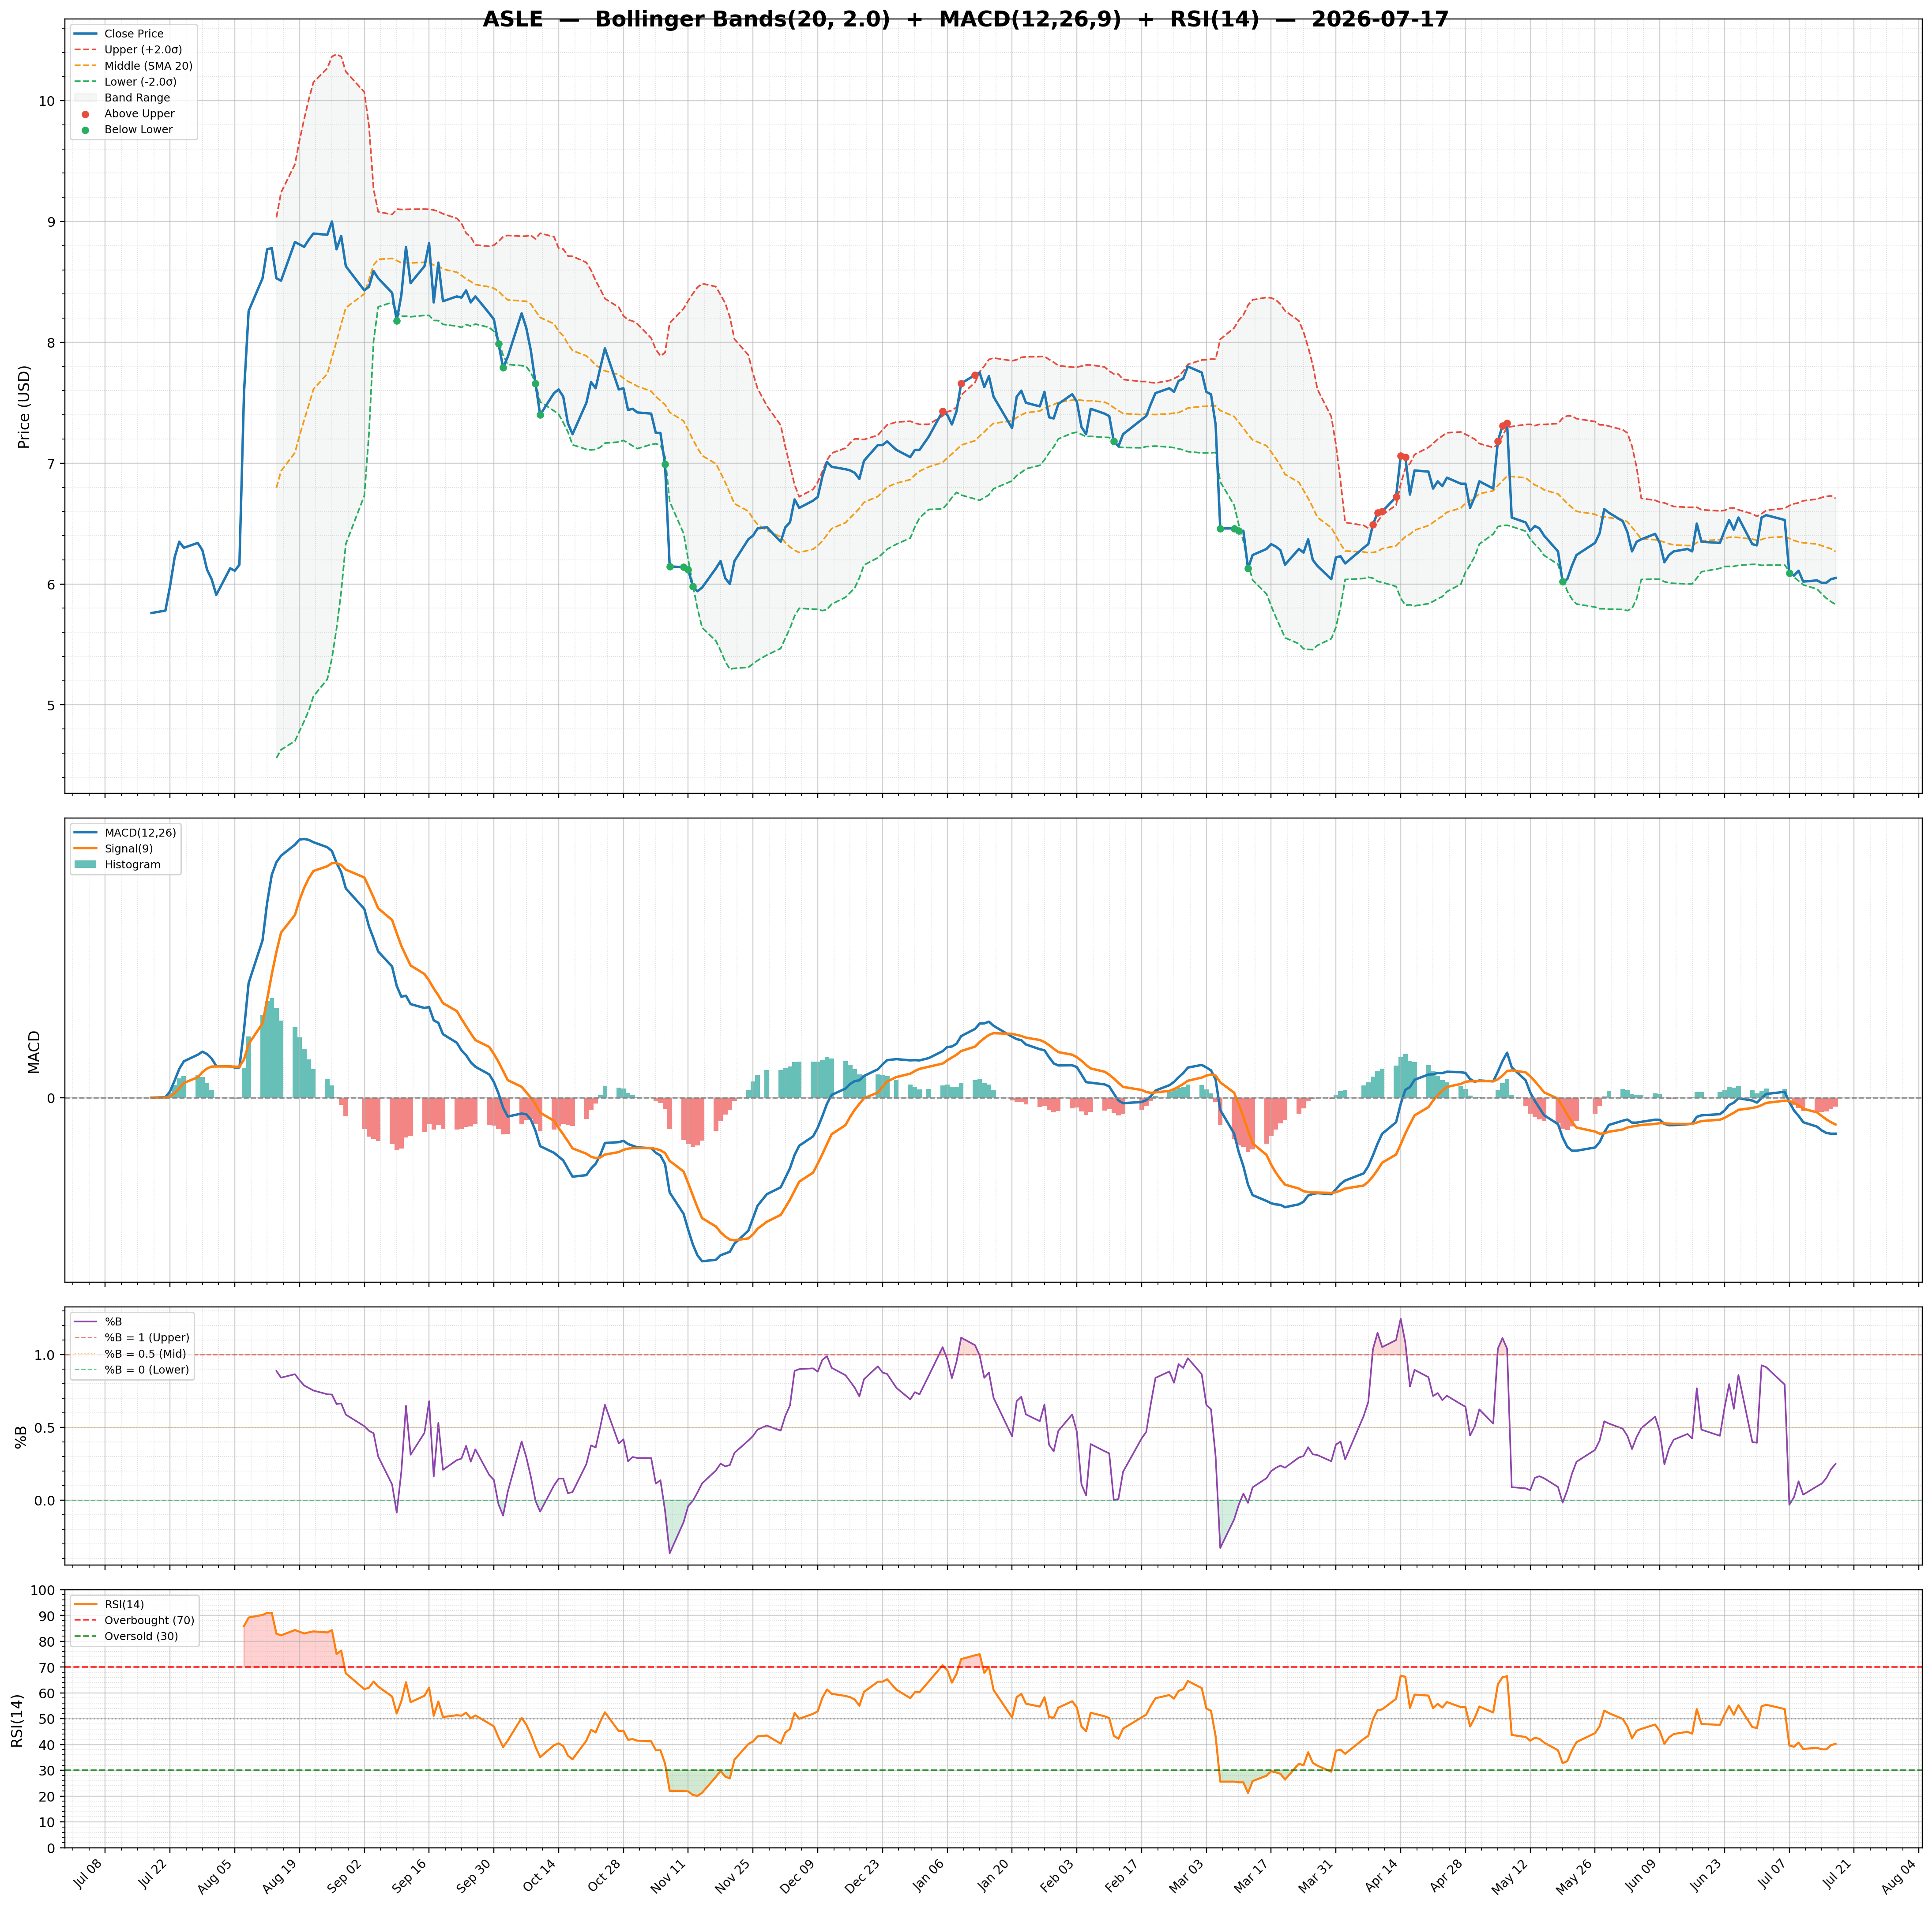
| 2026-07-17 | ASLE | 6.05 | / | 8.95% | none | 256,846/491,347 | 14.00/0.25 | 40.28/-0.0300 | -0.11 | -0.11/-0.08 | Chart 3M 🌐 |
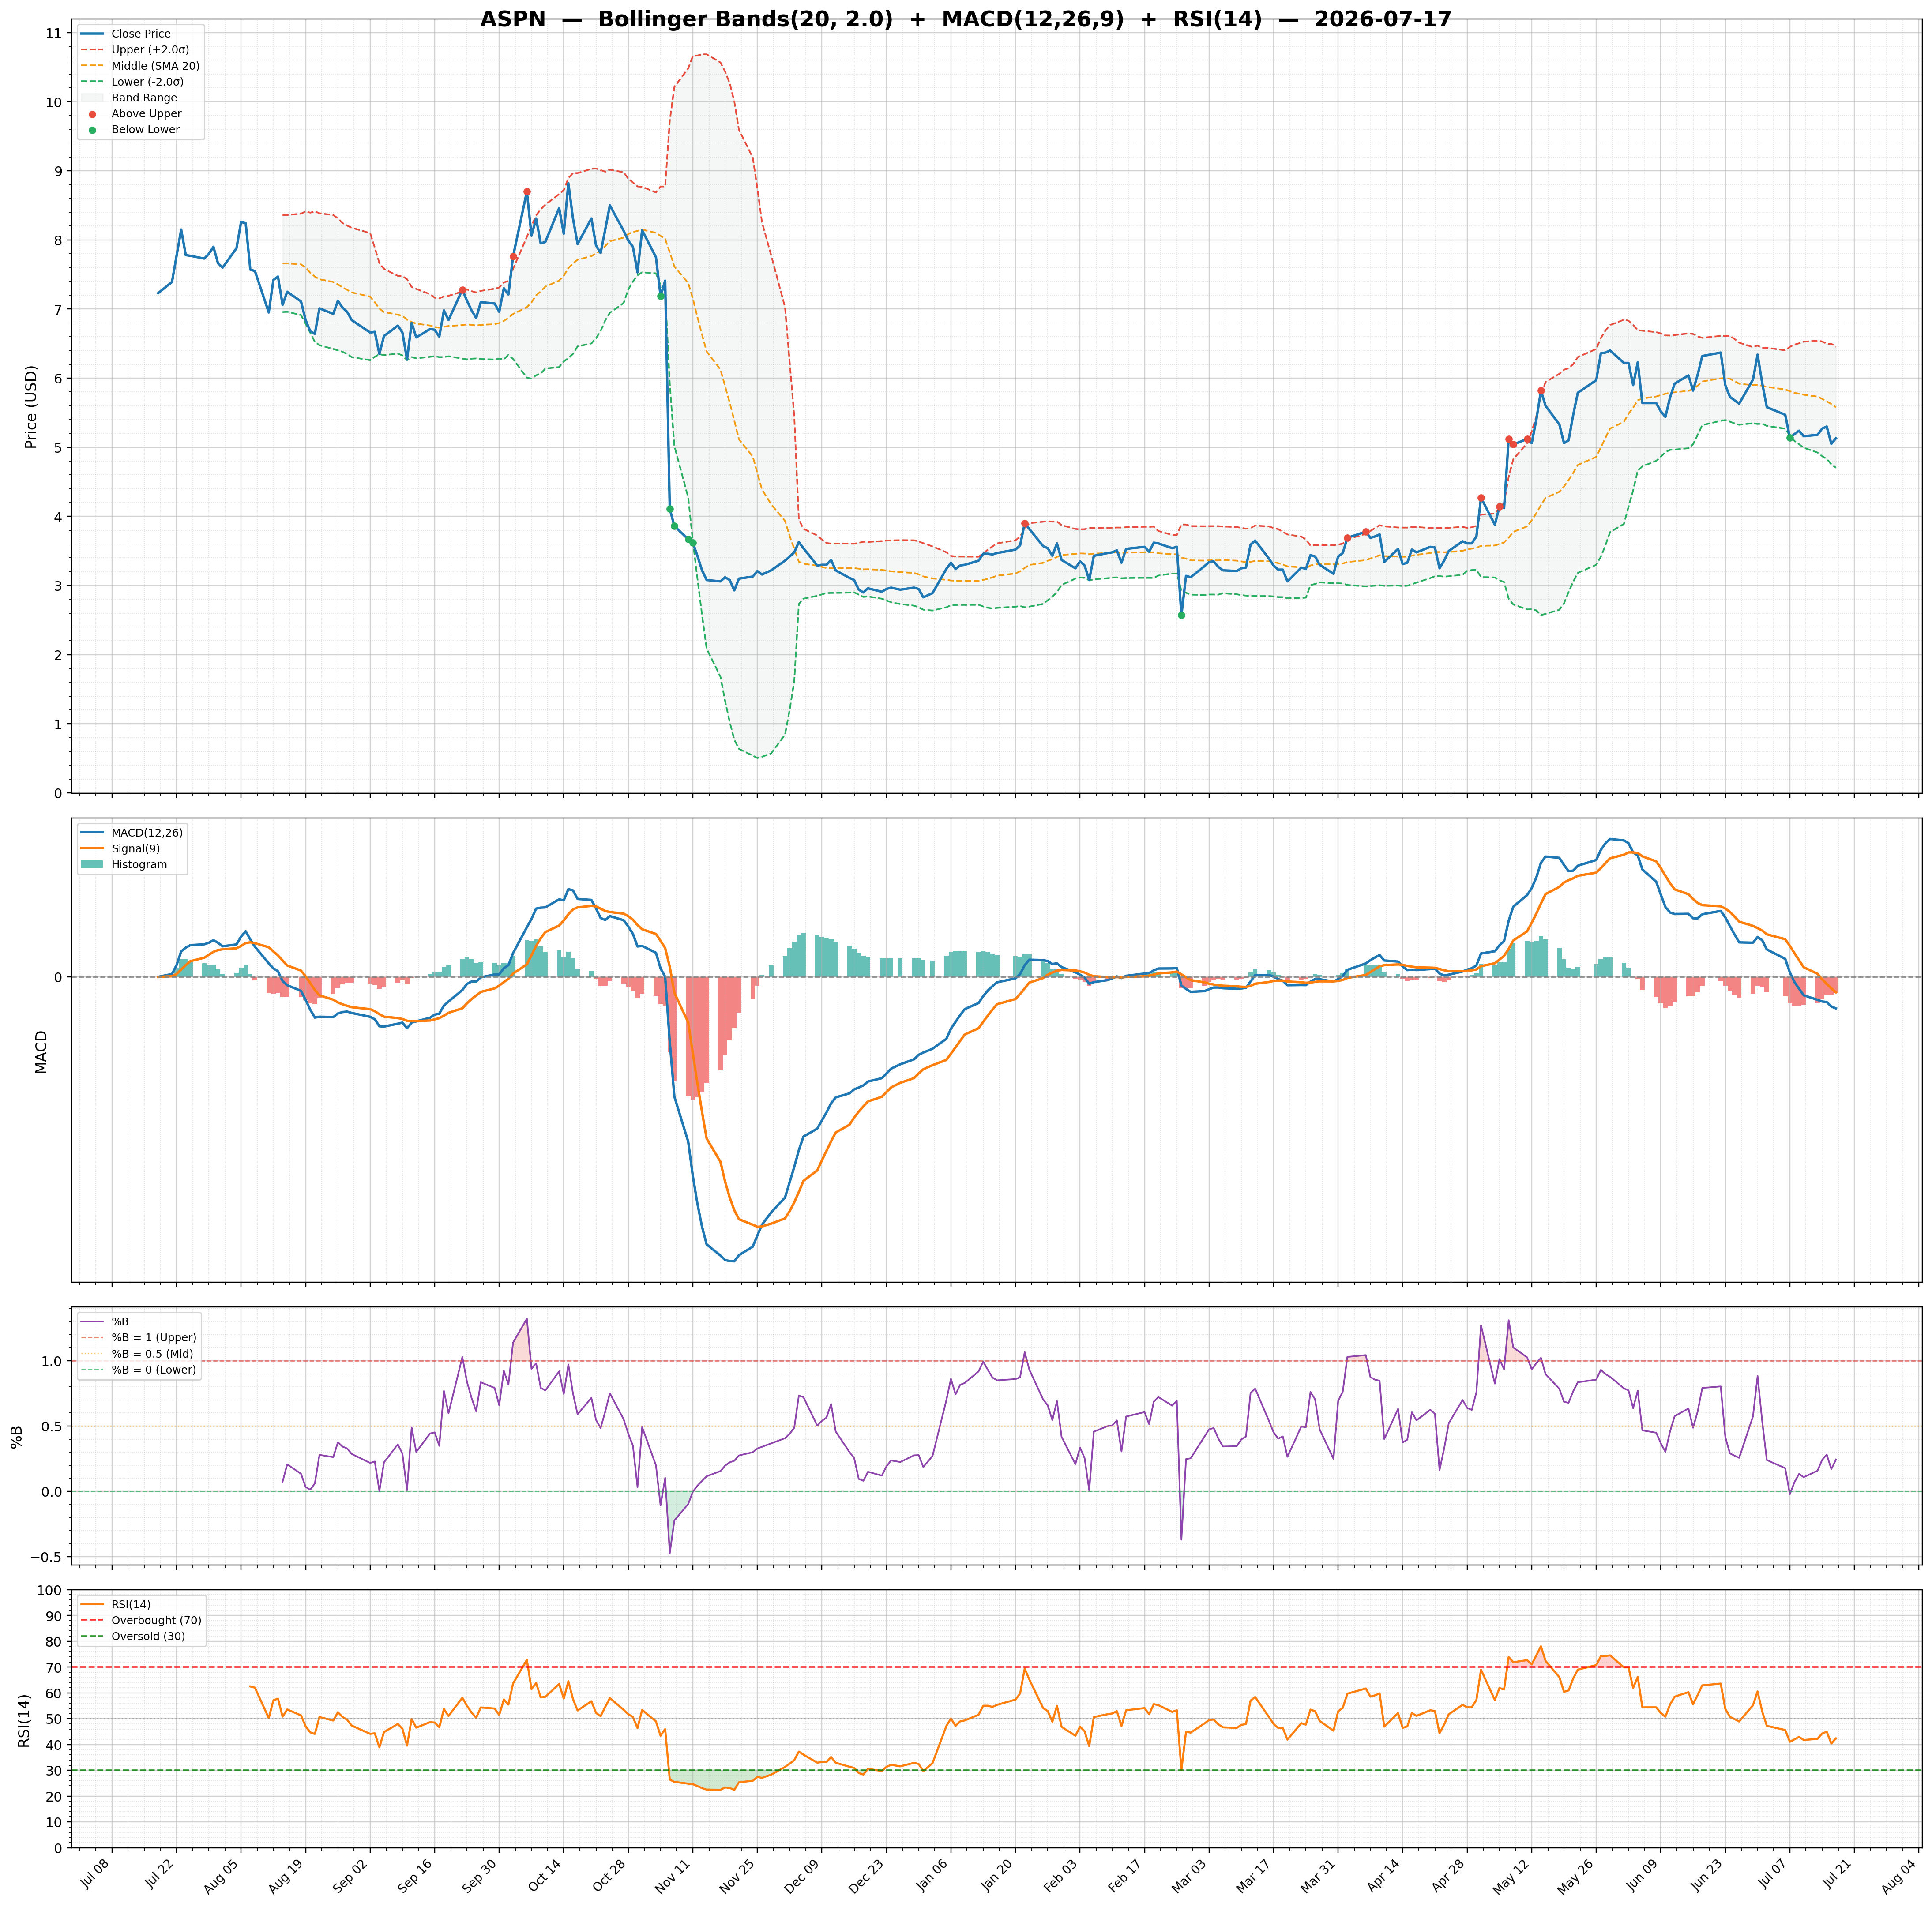
| 2026-07-17 | ASPN | 5.13 | / | 40.96% | buy | 764,976/1,343,374 | 31.37/0.24 | 42.40/-0.0700 | 0.15 | -0.14/-0.07 | Chart 3M 🌐 |
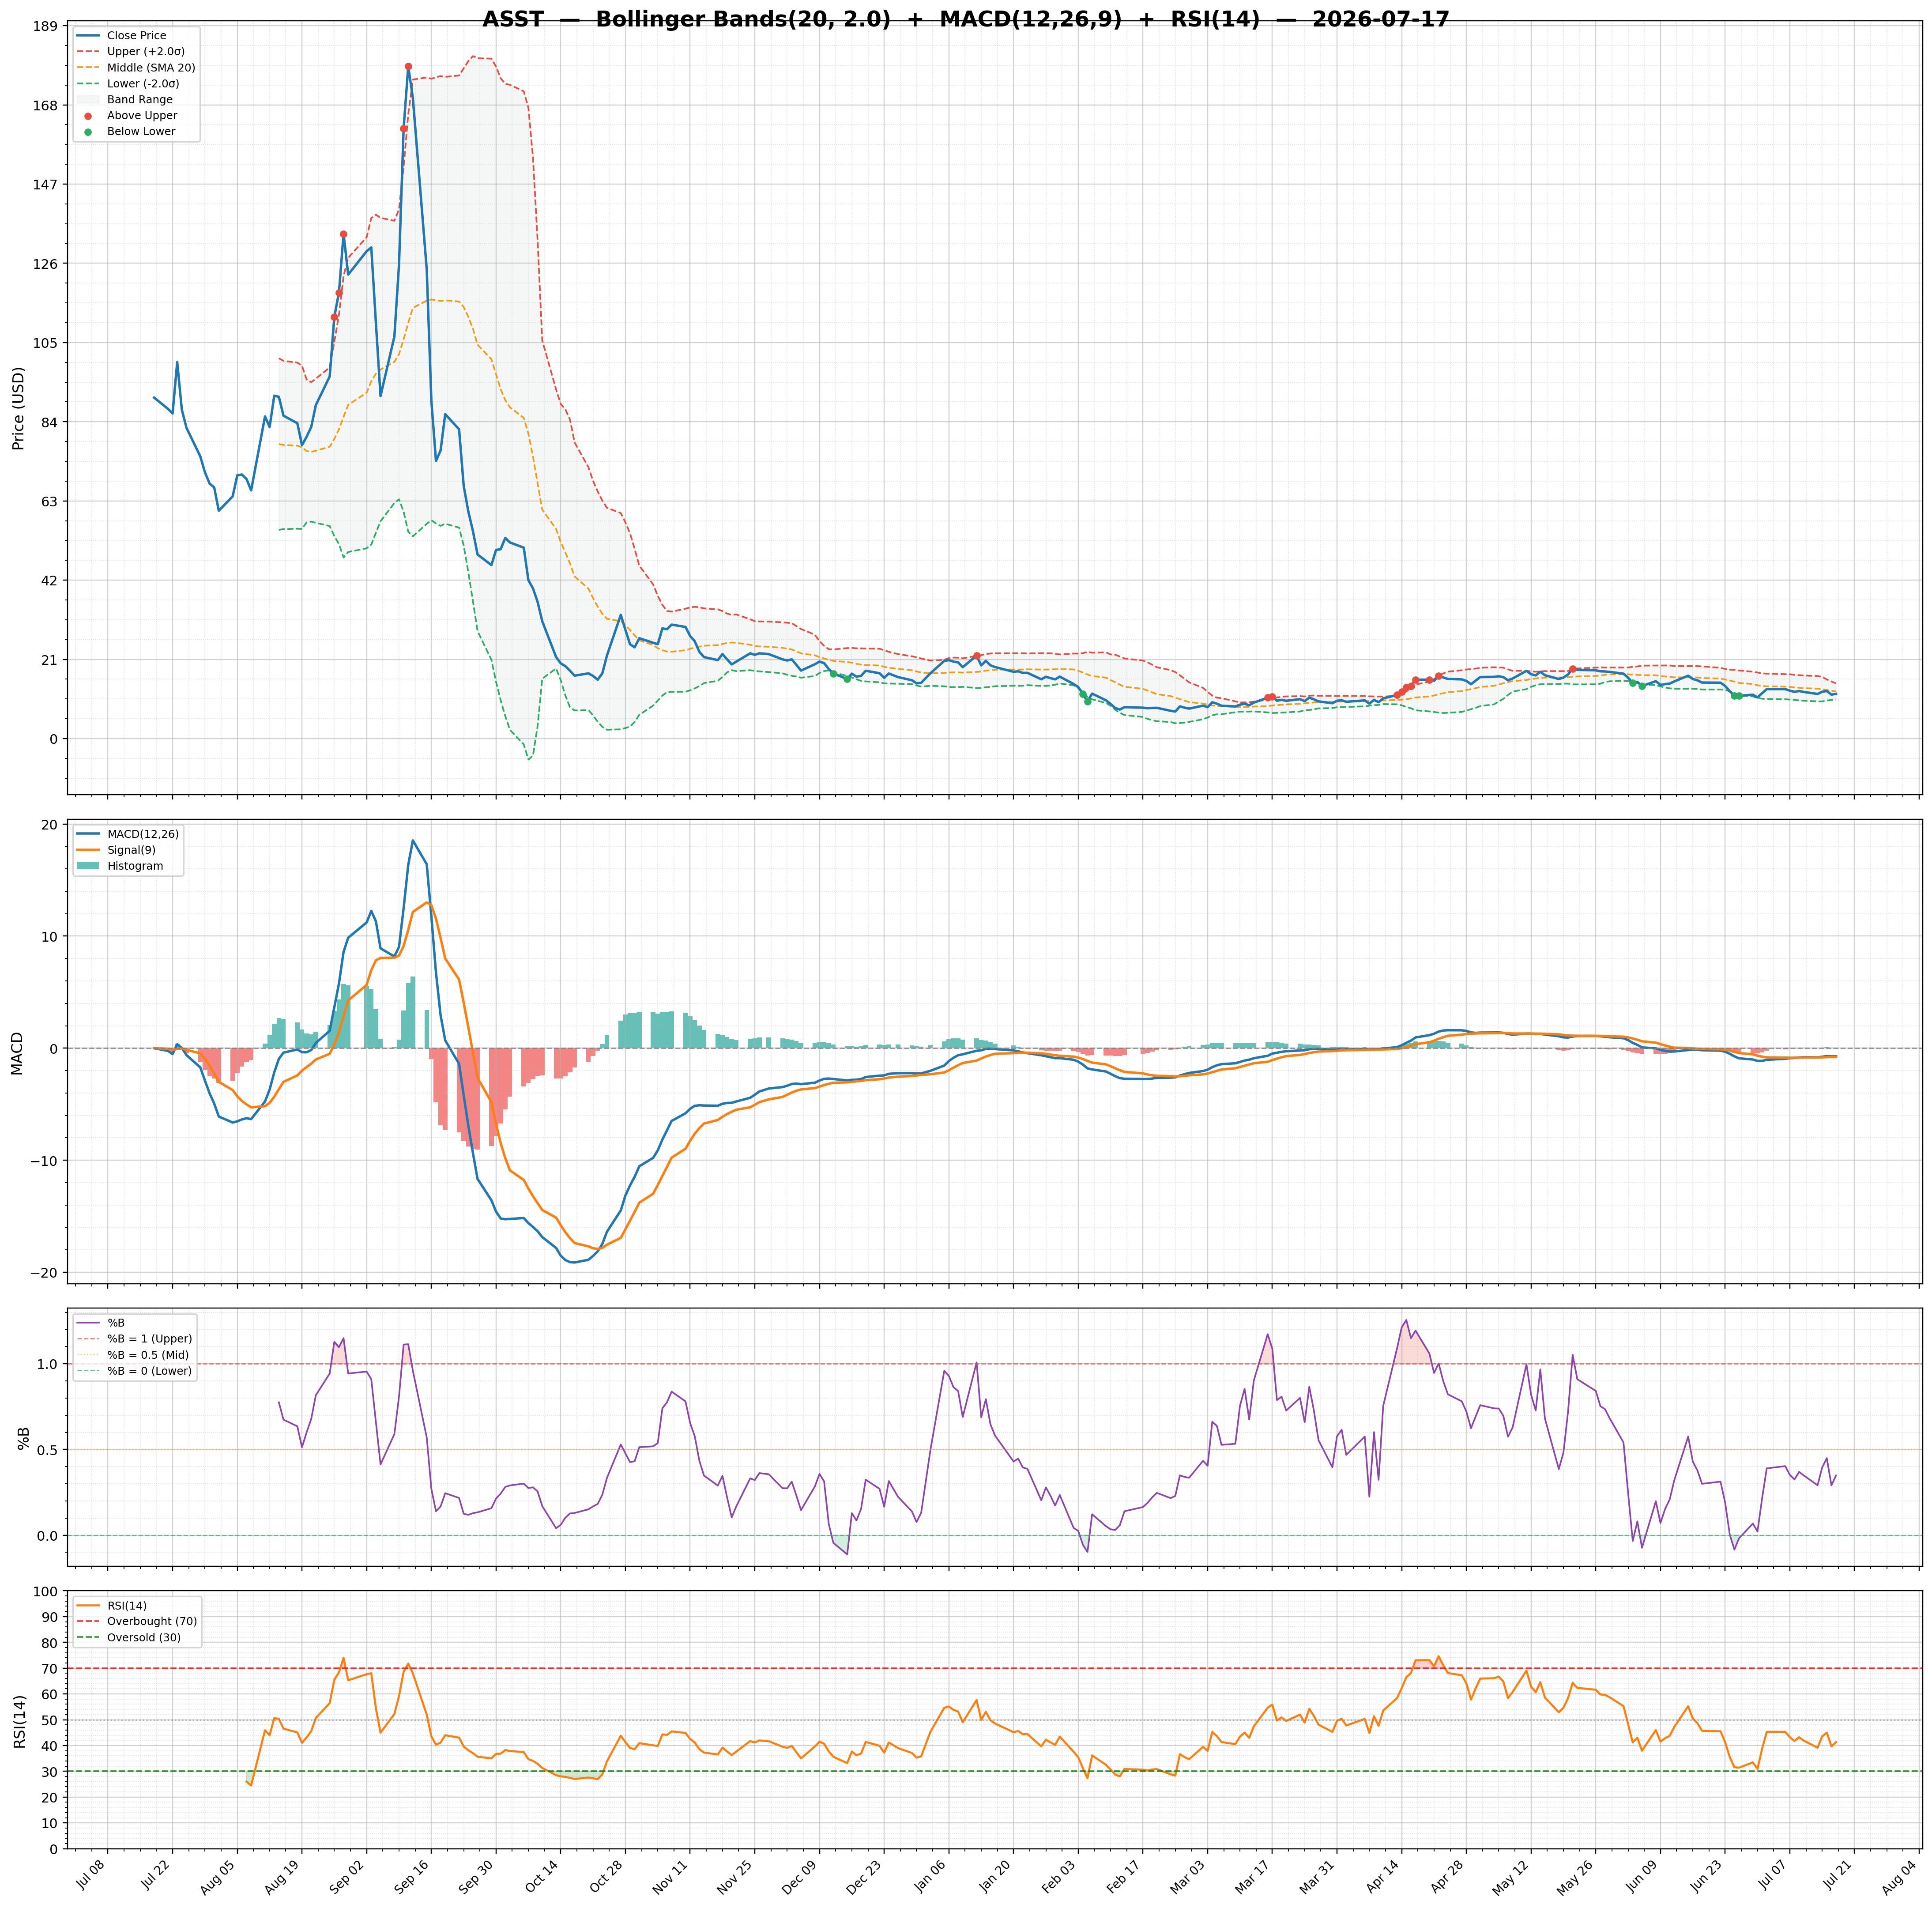
| 2026-07-17 | ASST | 11.86 | / | 2.75% | none | 2,623,390/4,076,784 | 34.01/0.35 | 41.31/0.0500 | -0.40 | -0.72/-0.77 | Chart 3M 🌐 |
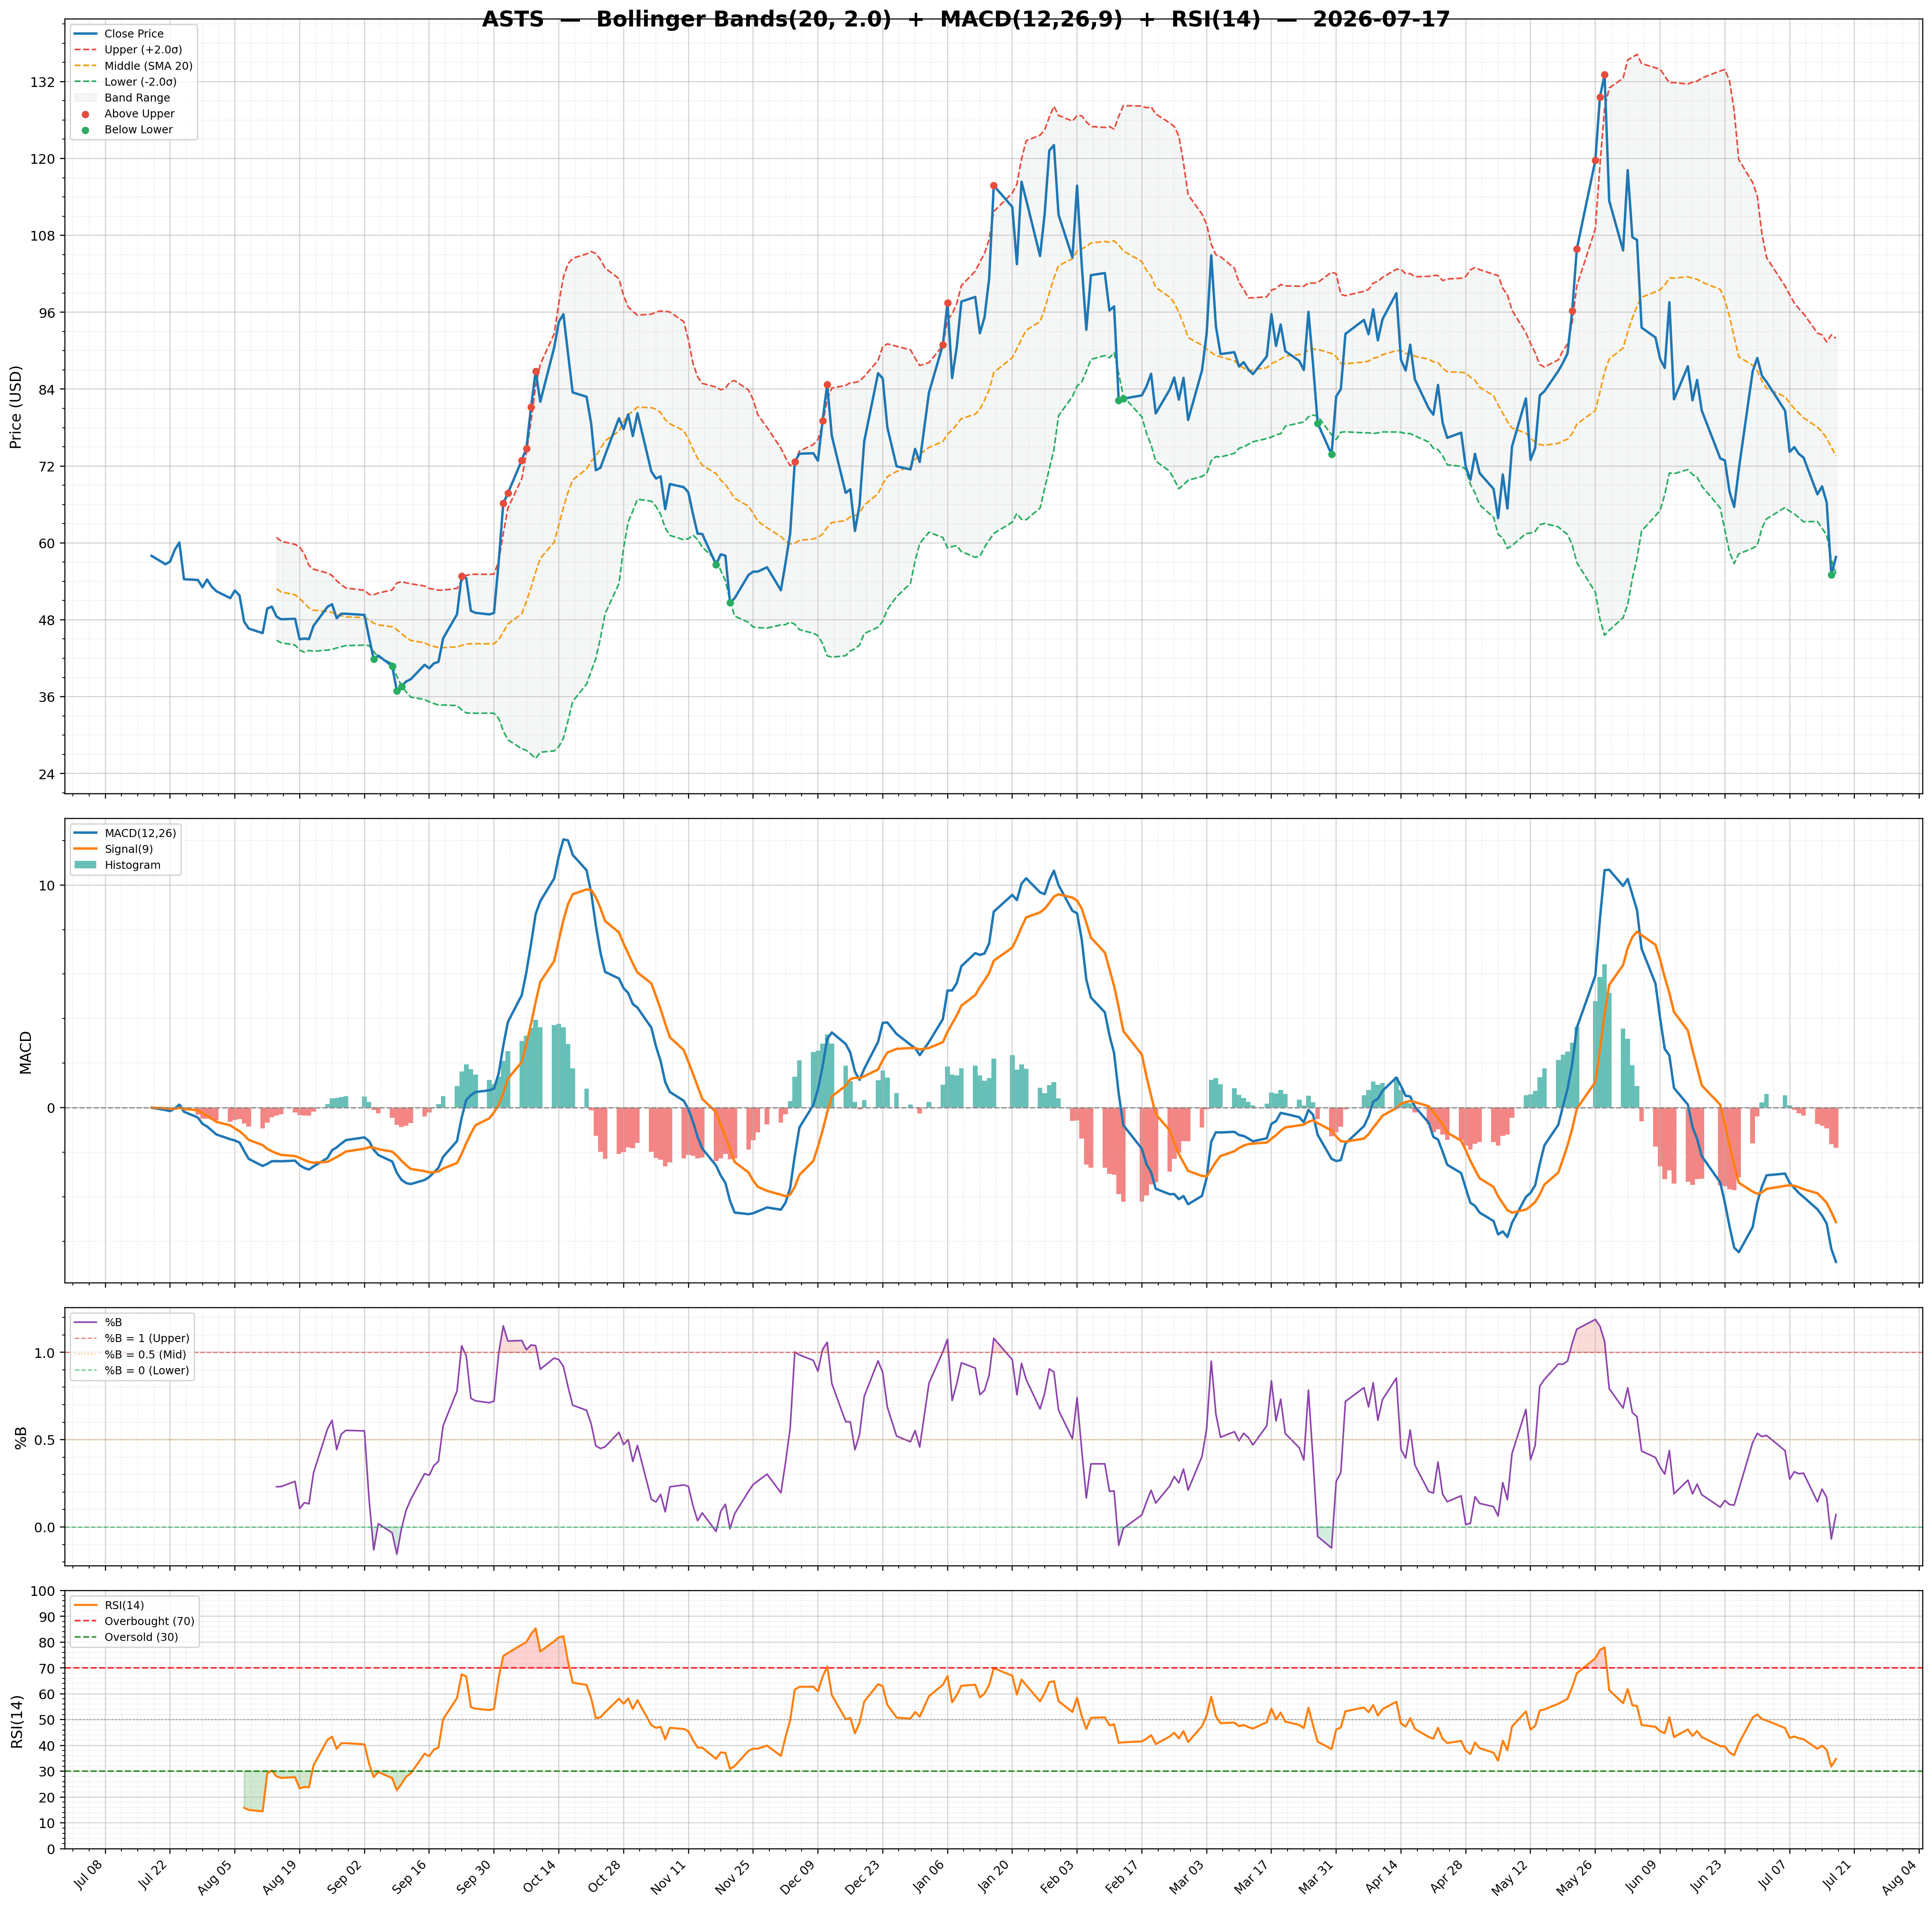
| 2026-07-17 | ASTS | 57.80 | / | 21.72% | hold | 30,102,131/20,667,317 | 49.98/0.07 | 34.73/-1.7900 | -0.30 | -6.92/-5.13 | Chart 3M 🌐 |
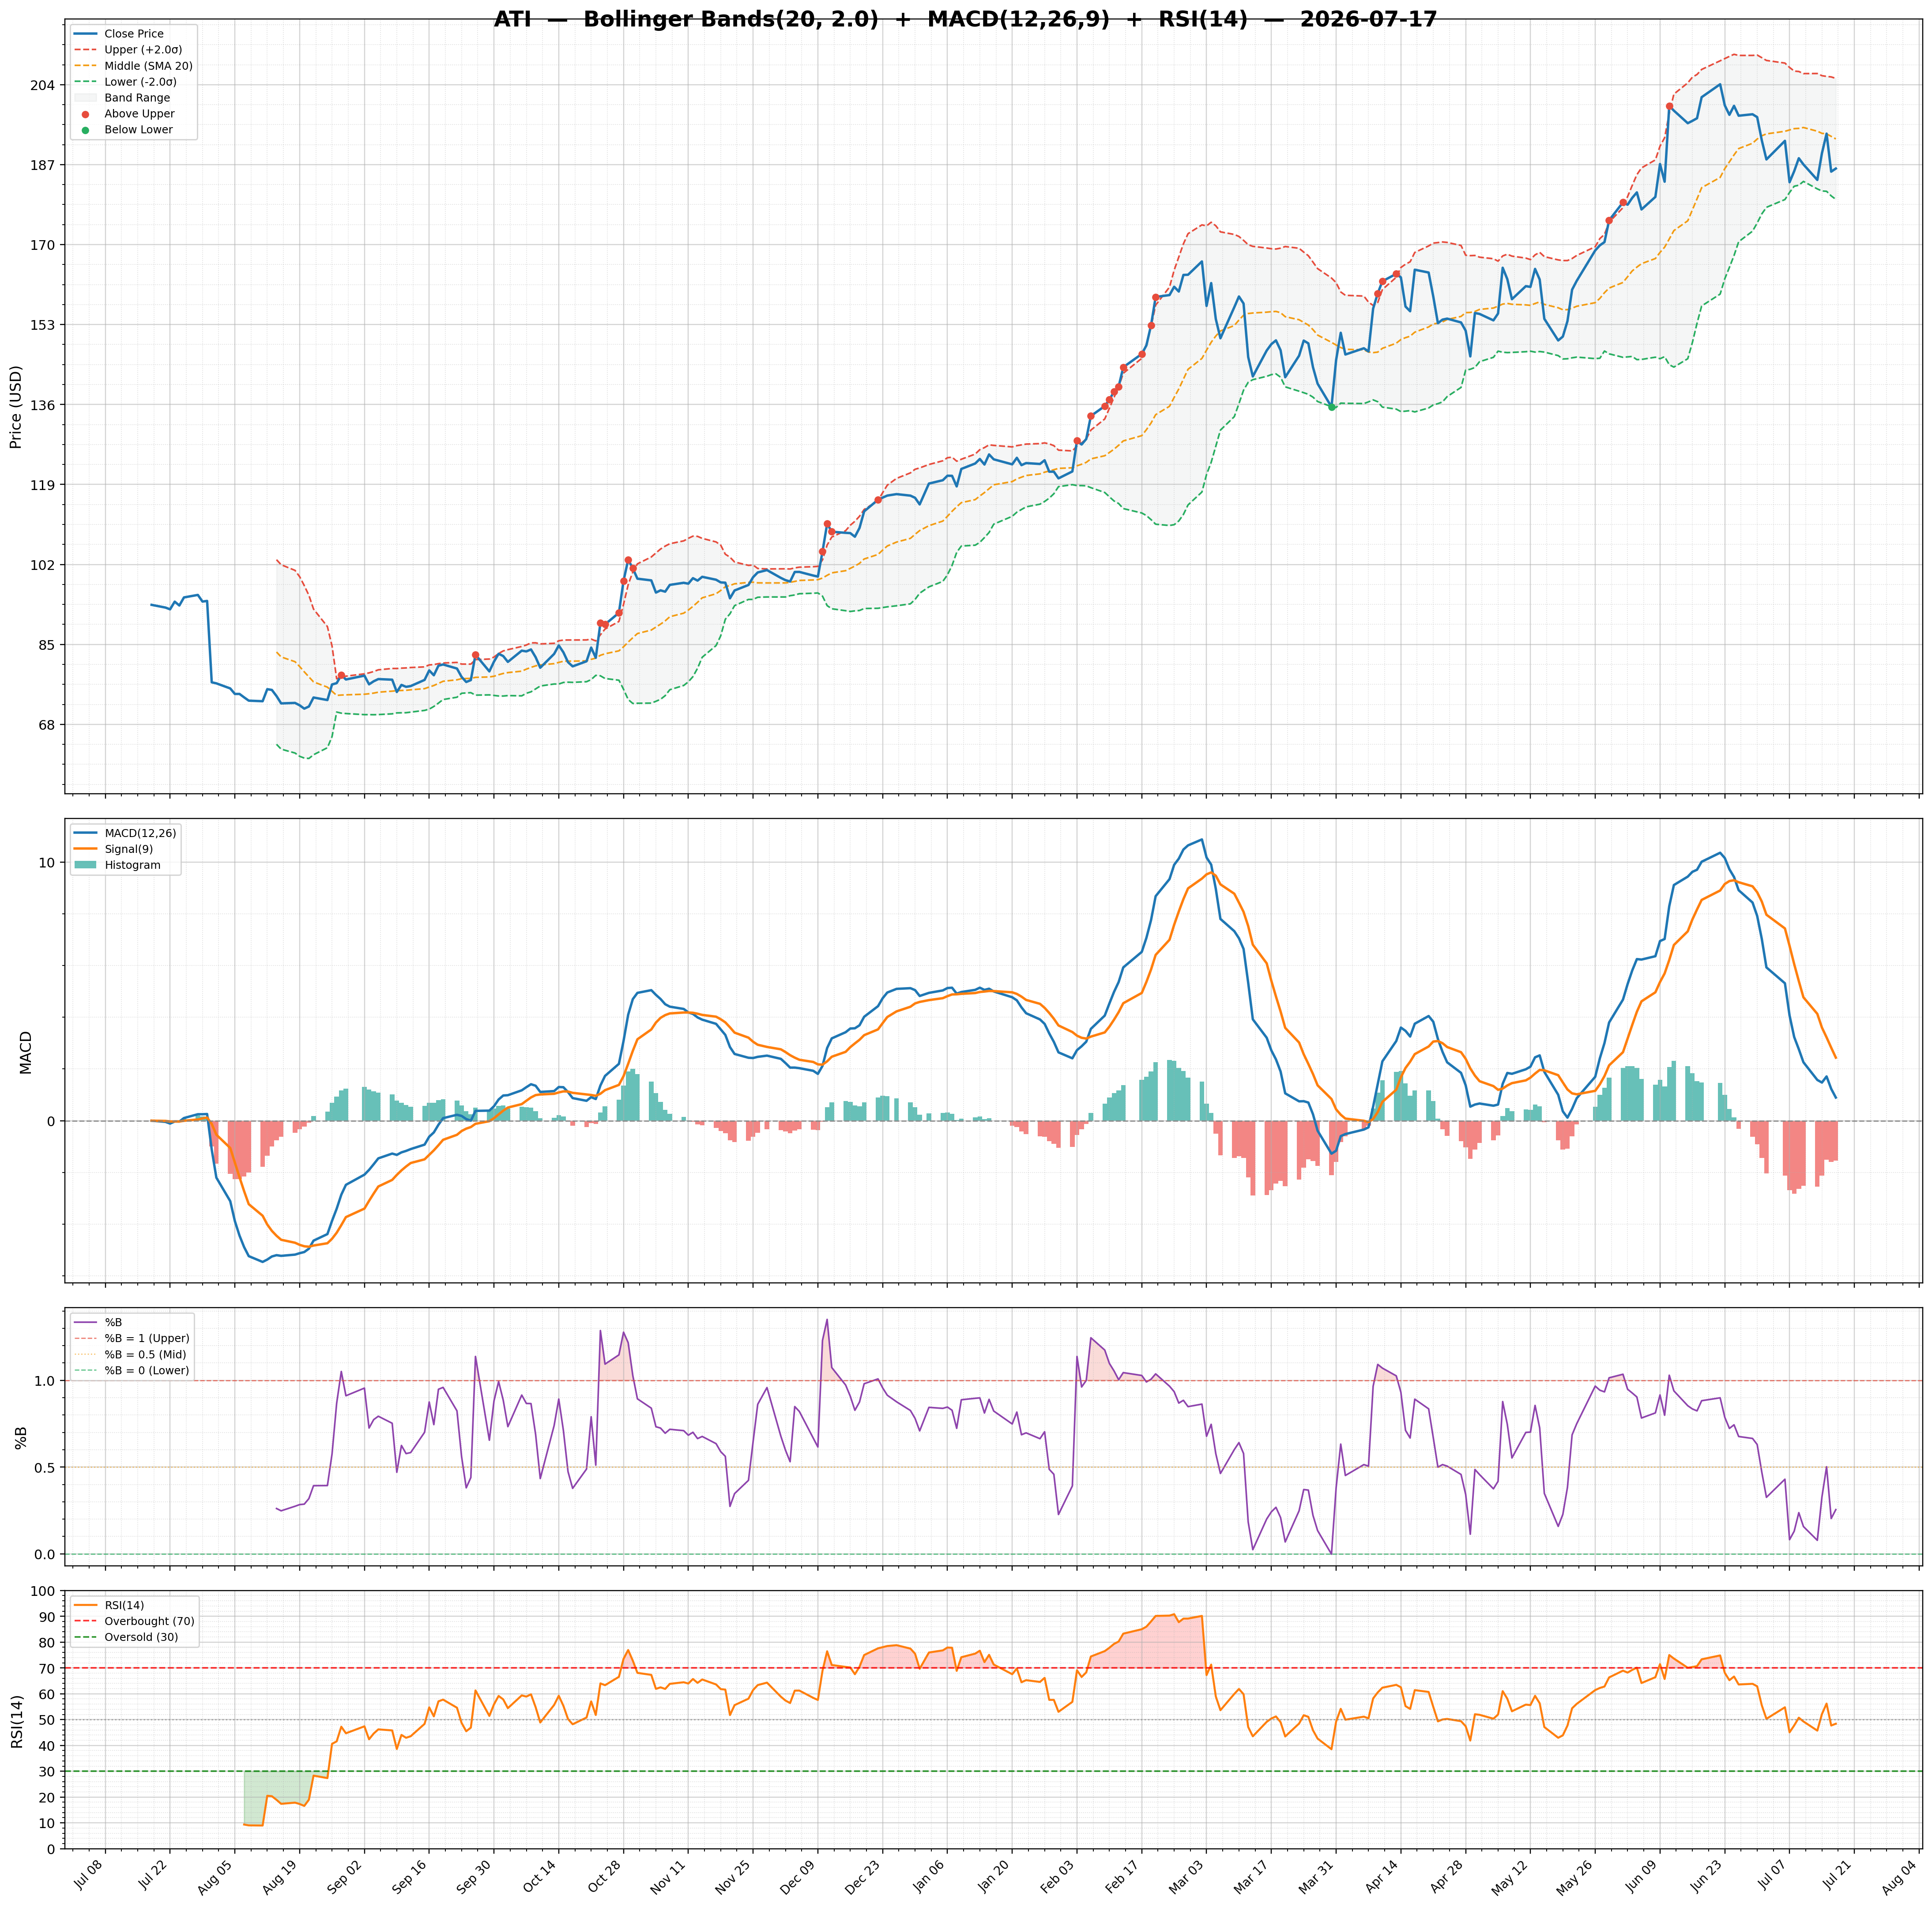
| 2026-07-17 | ATI | 186.17 | / | 86.50% | strong_buy | 1,224,932/1,722,212 | 13.36/0.26 | 48.40/-1.5400 | 0.62 | 0.90/2.44 | Chart 3M 🌐 |
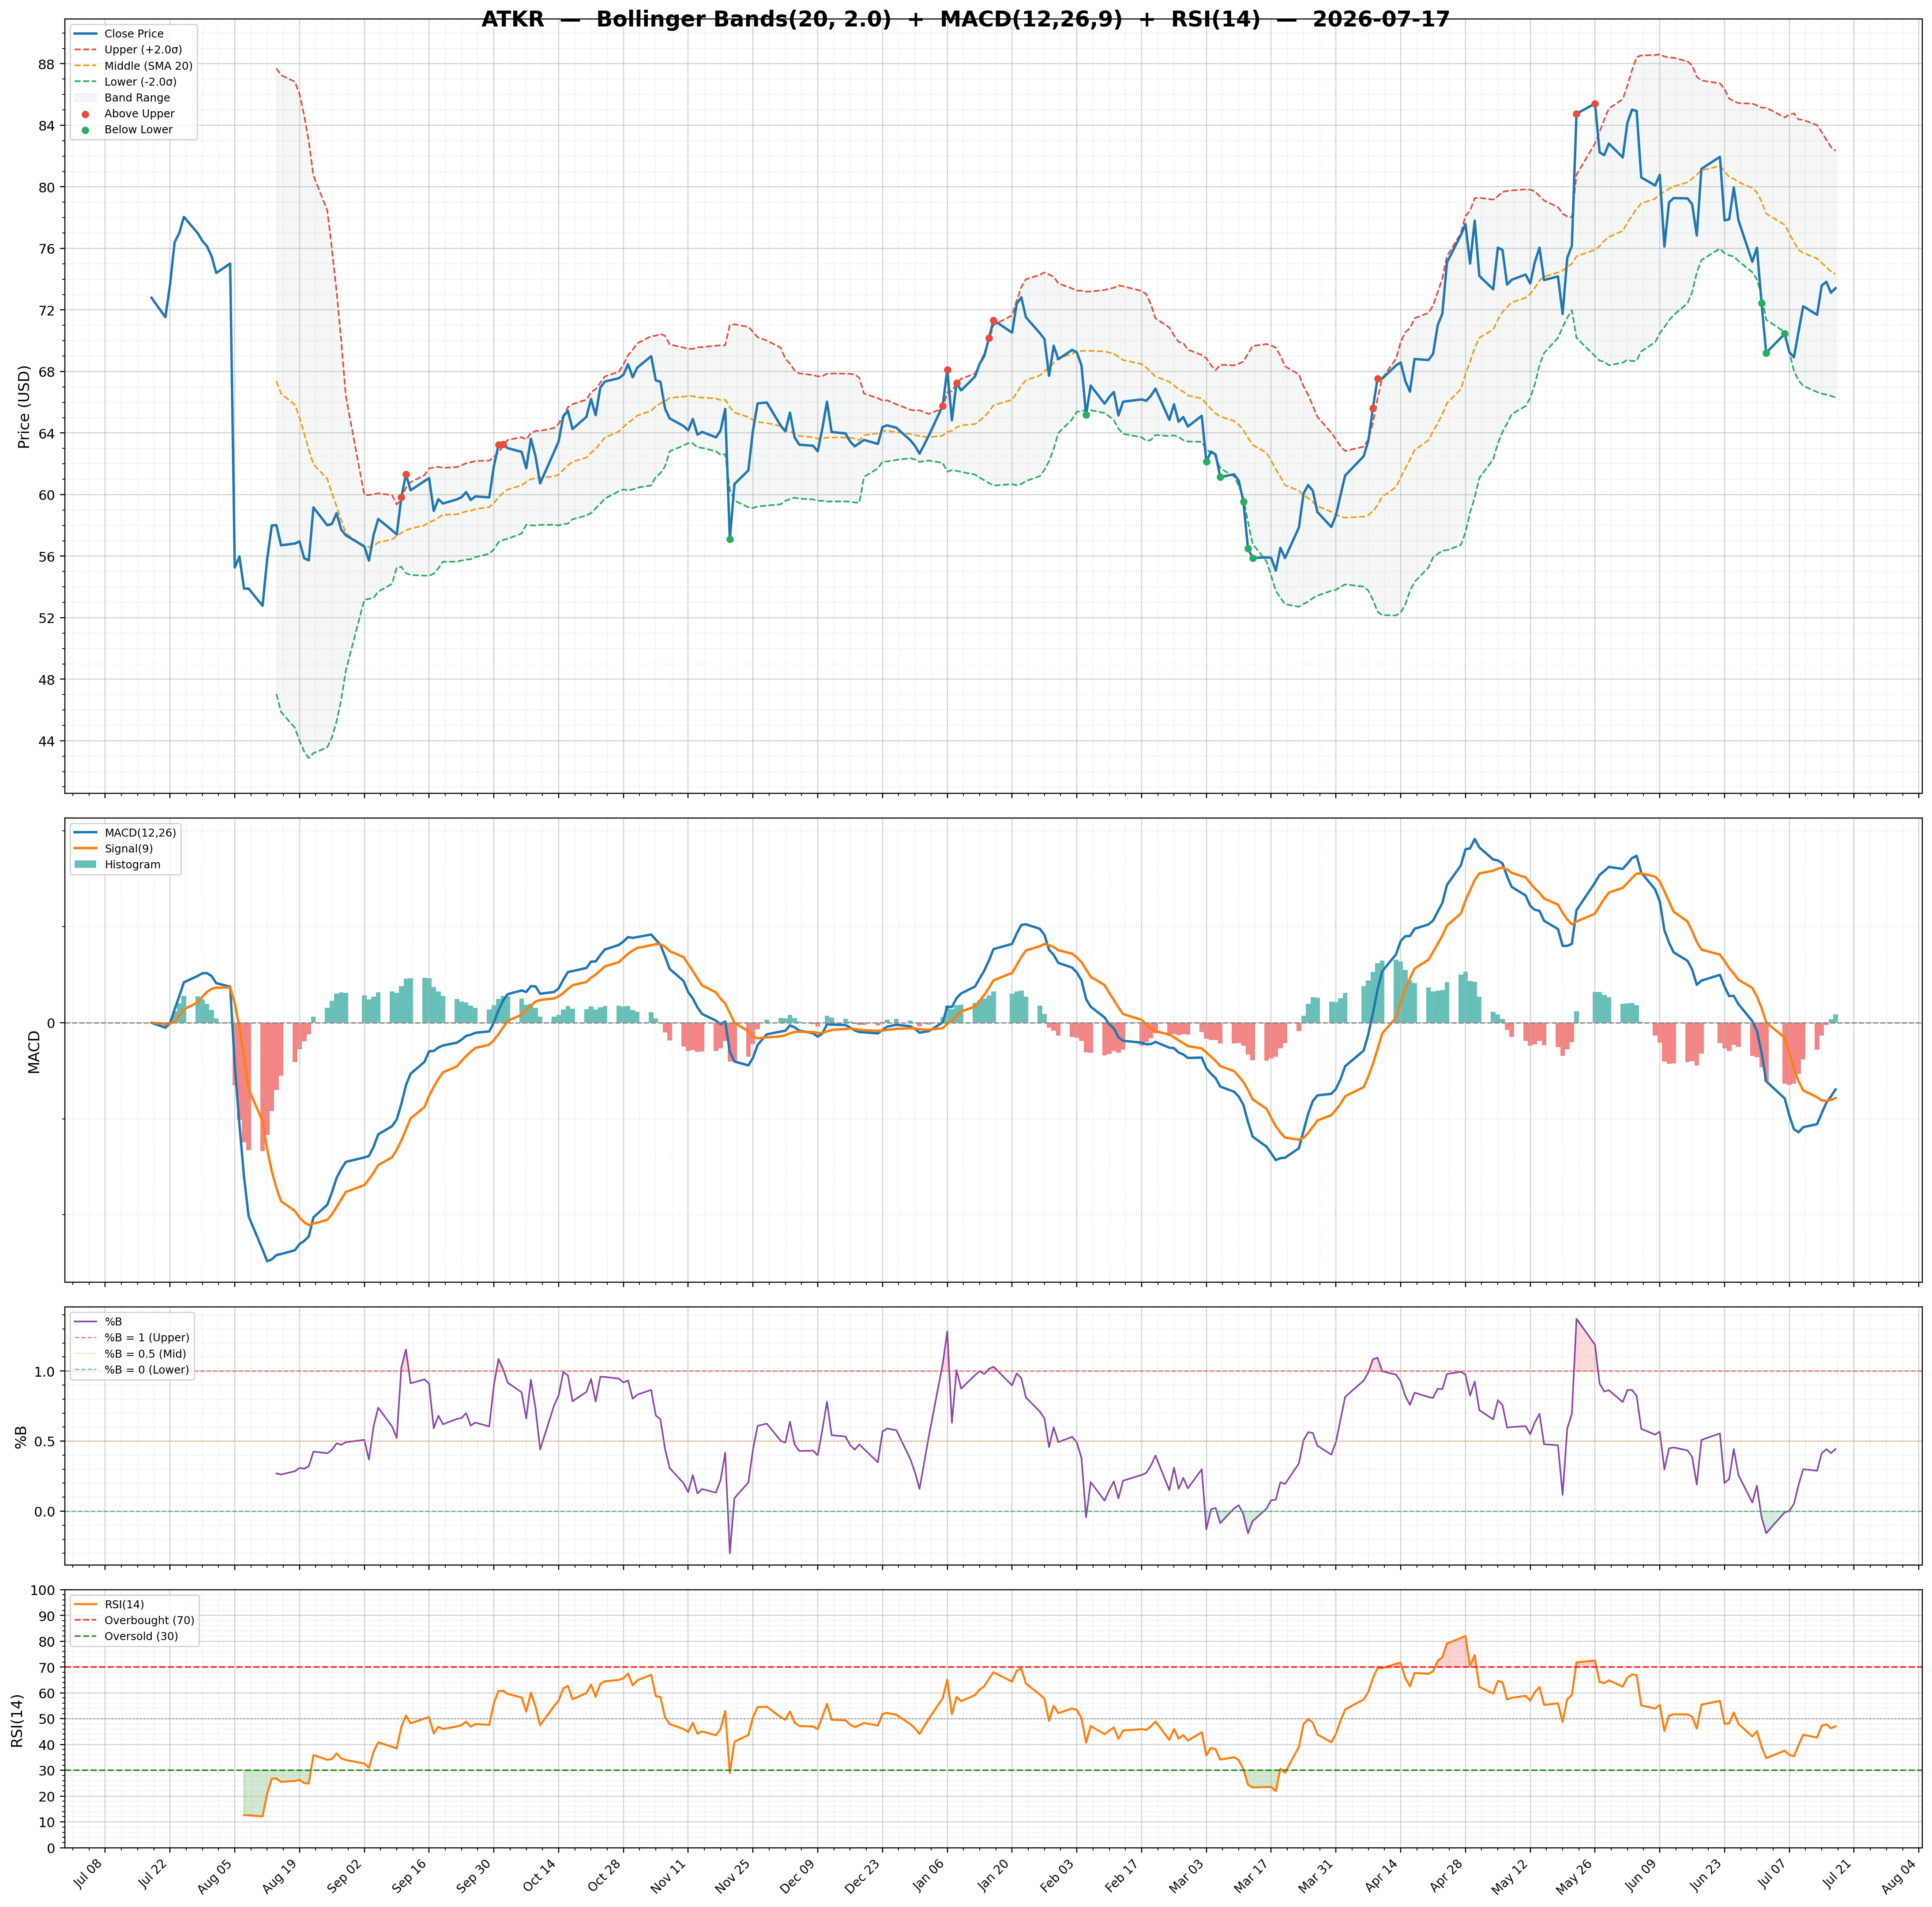
| 2026-07-17 | ATKR | 73.42 | / | 63.27% | buy | 175,484/332,724 | 21.58/0.44 | 47.07/0.1800 | 0.09 | -1.39/-1.56 | Chart 3M 🌐 |
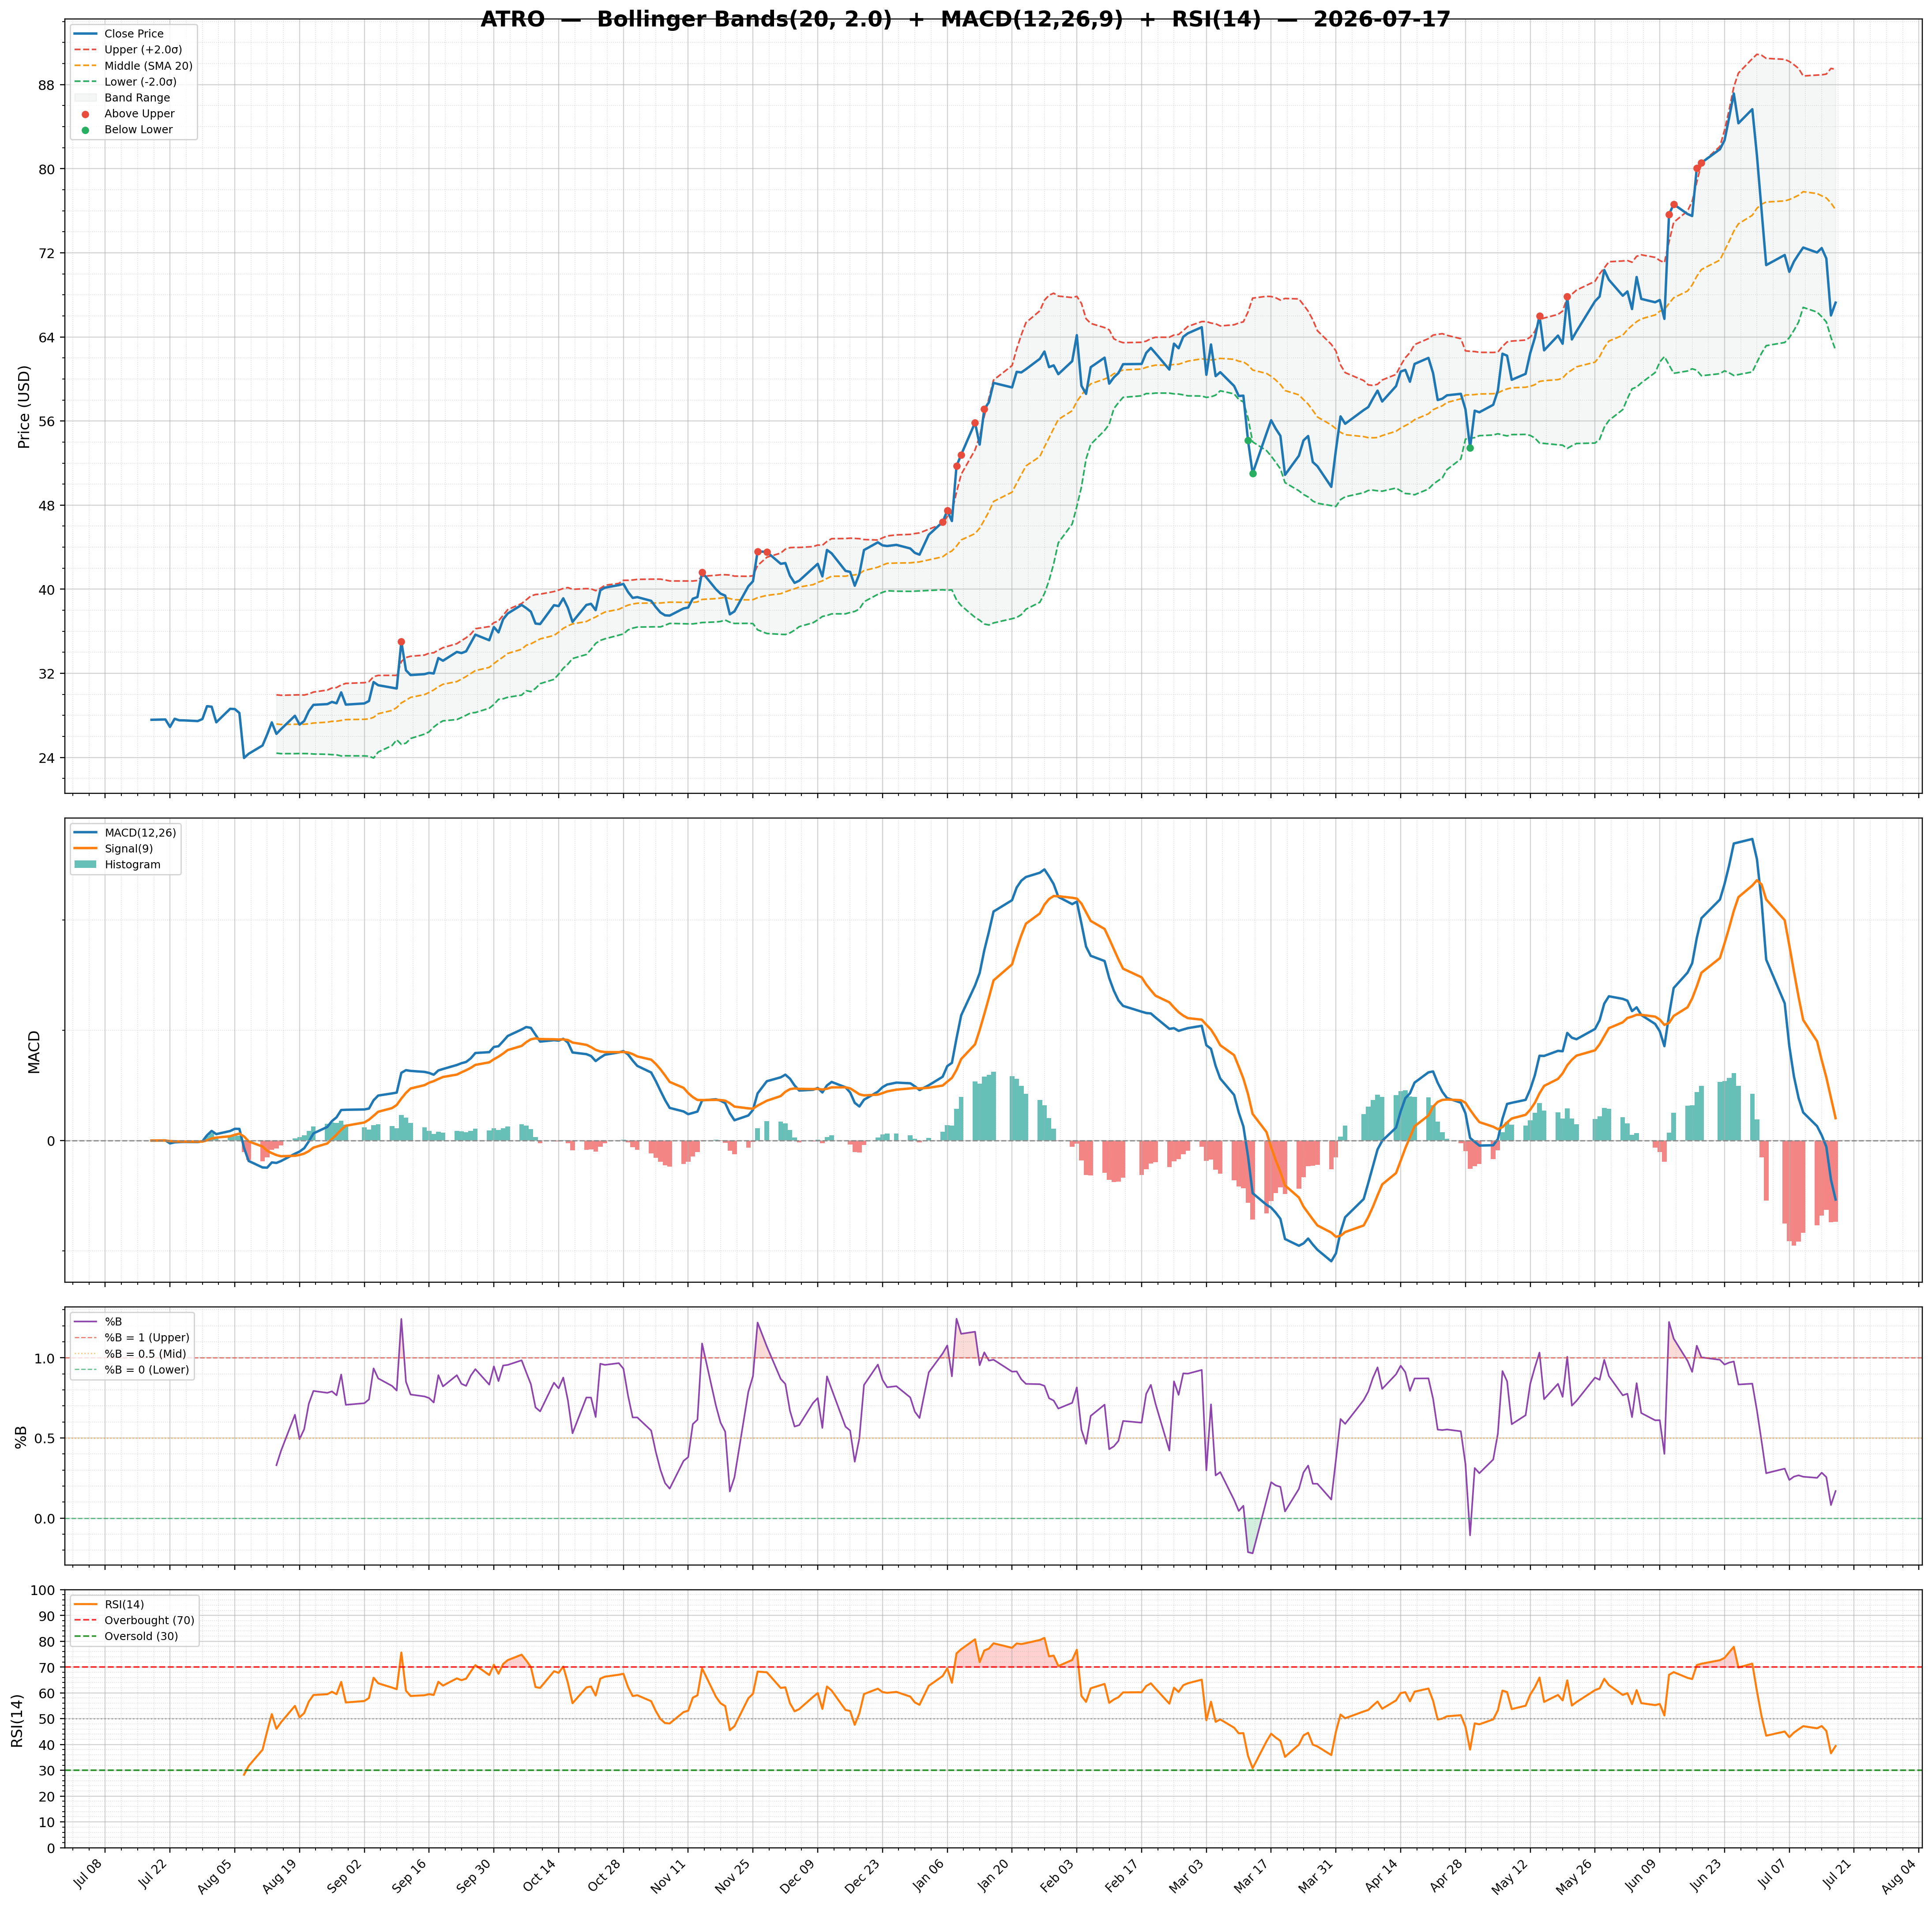
| 2026-07-17 | ATRO | 67.26 | / | 68.53% | buy | 455,015/817,391 | 35.12/0.17 | 39.41/-1.4700 | 0.52 | -1.07/0.40 | Chart 3M 🌐 |
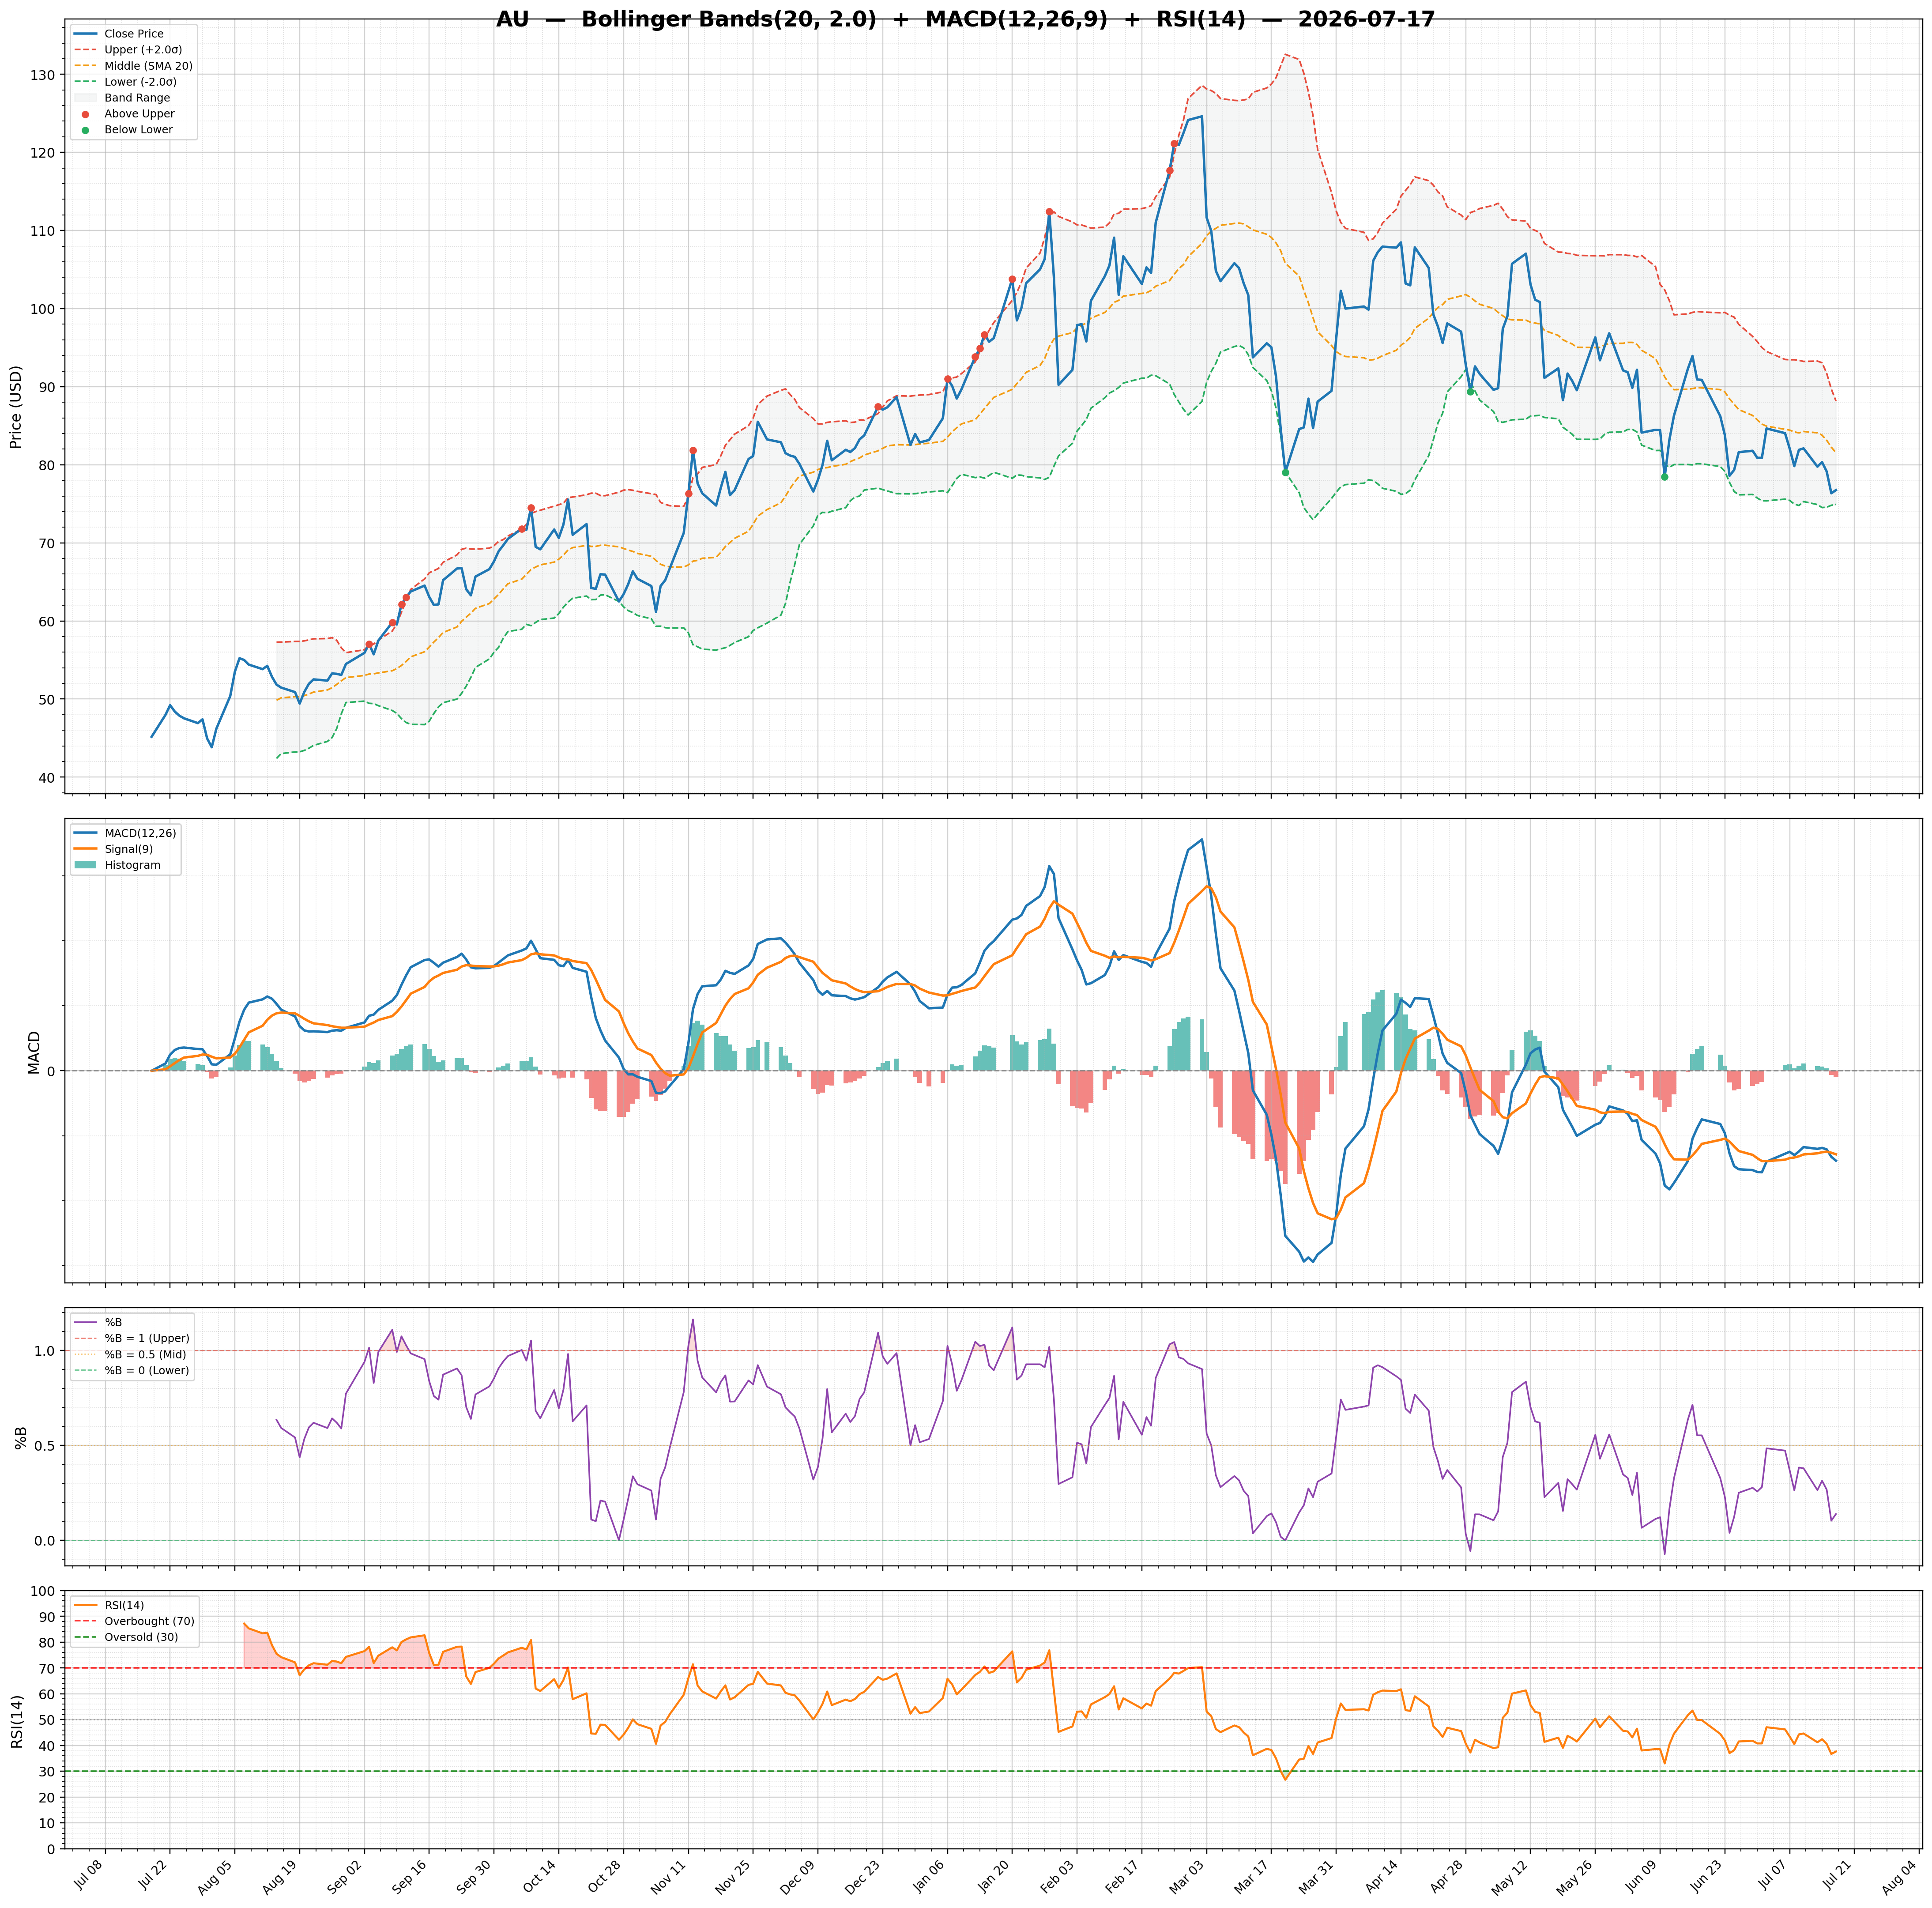
| 2026-07-17 | AU | 76.76 | / | 40.76% | buy | 2,501,232/3,824,037 | 16.24/0.14 | 37.64/-0.2000 | -0.01 | -2.77/-2.57 | Chart 3M 🌐 |
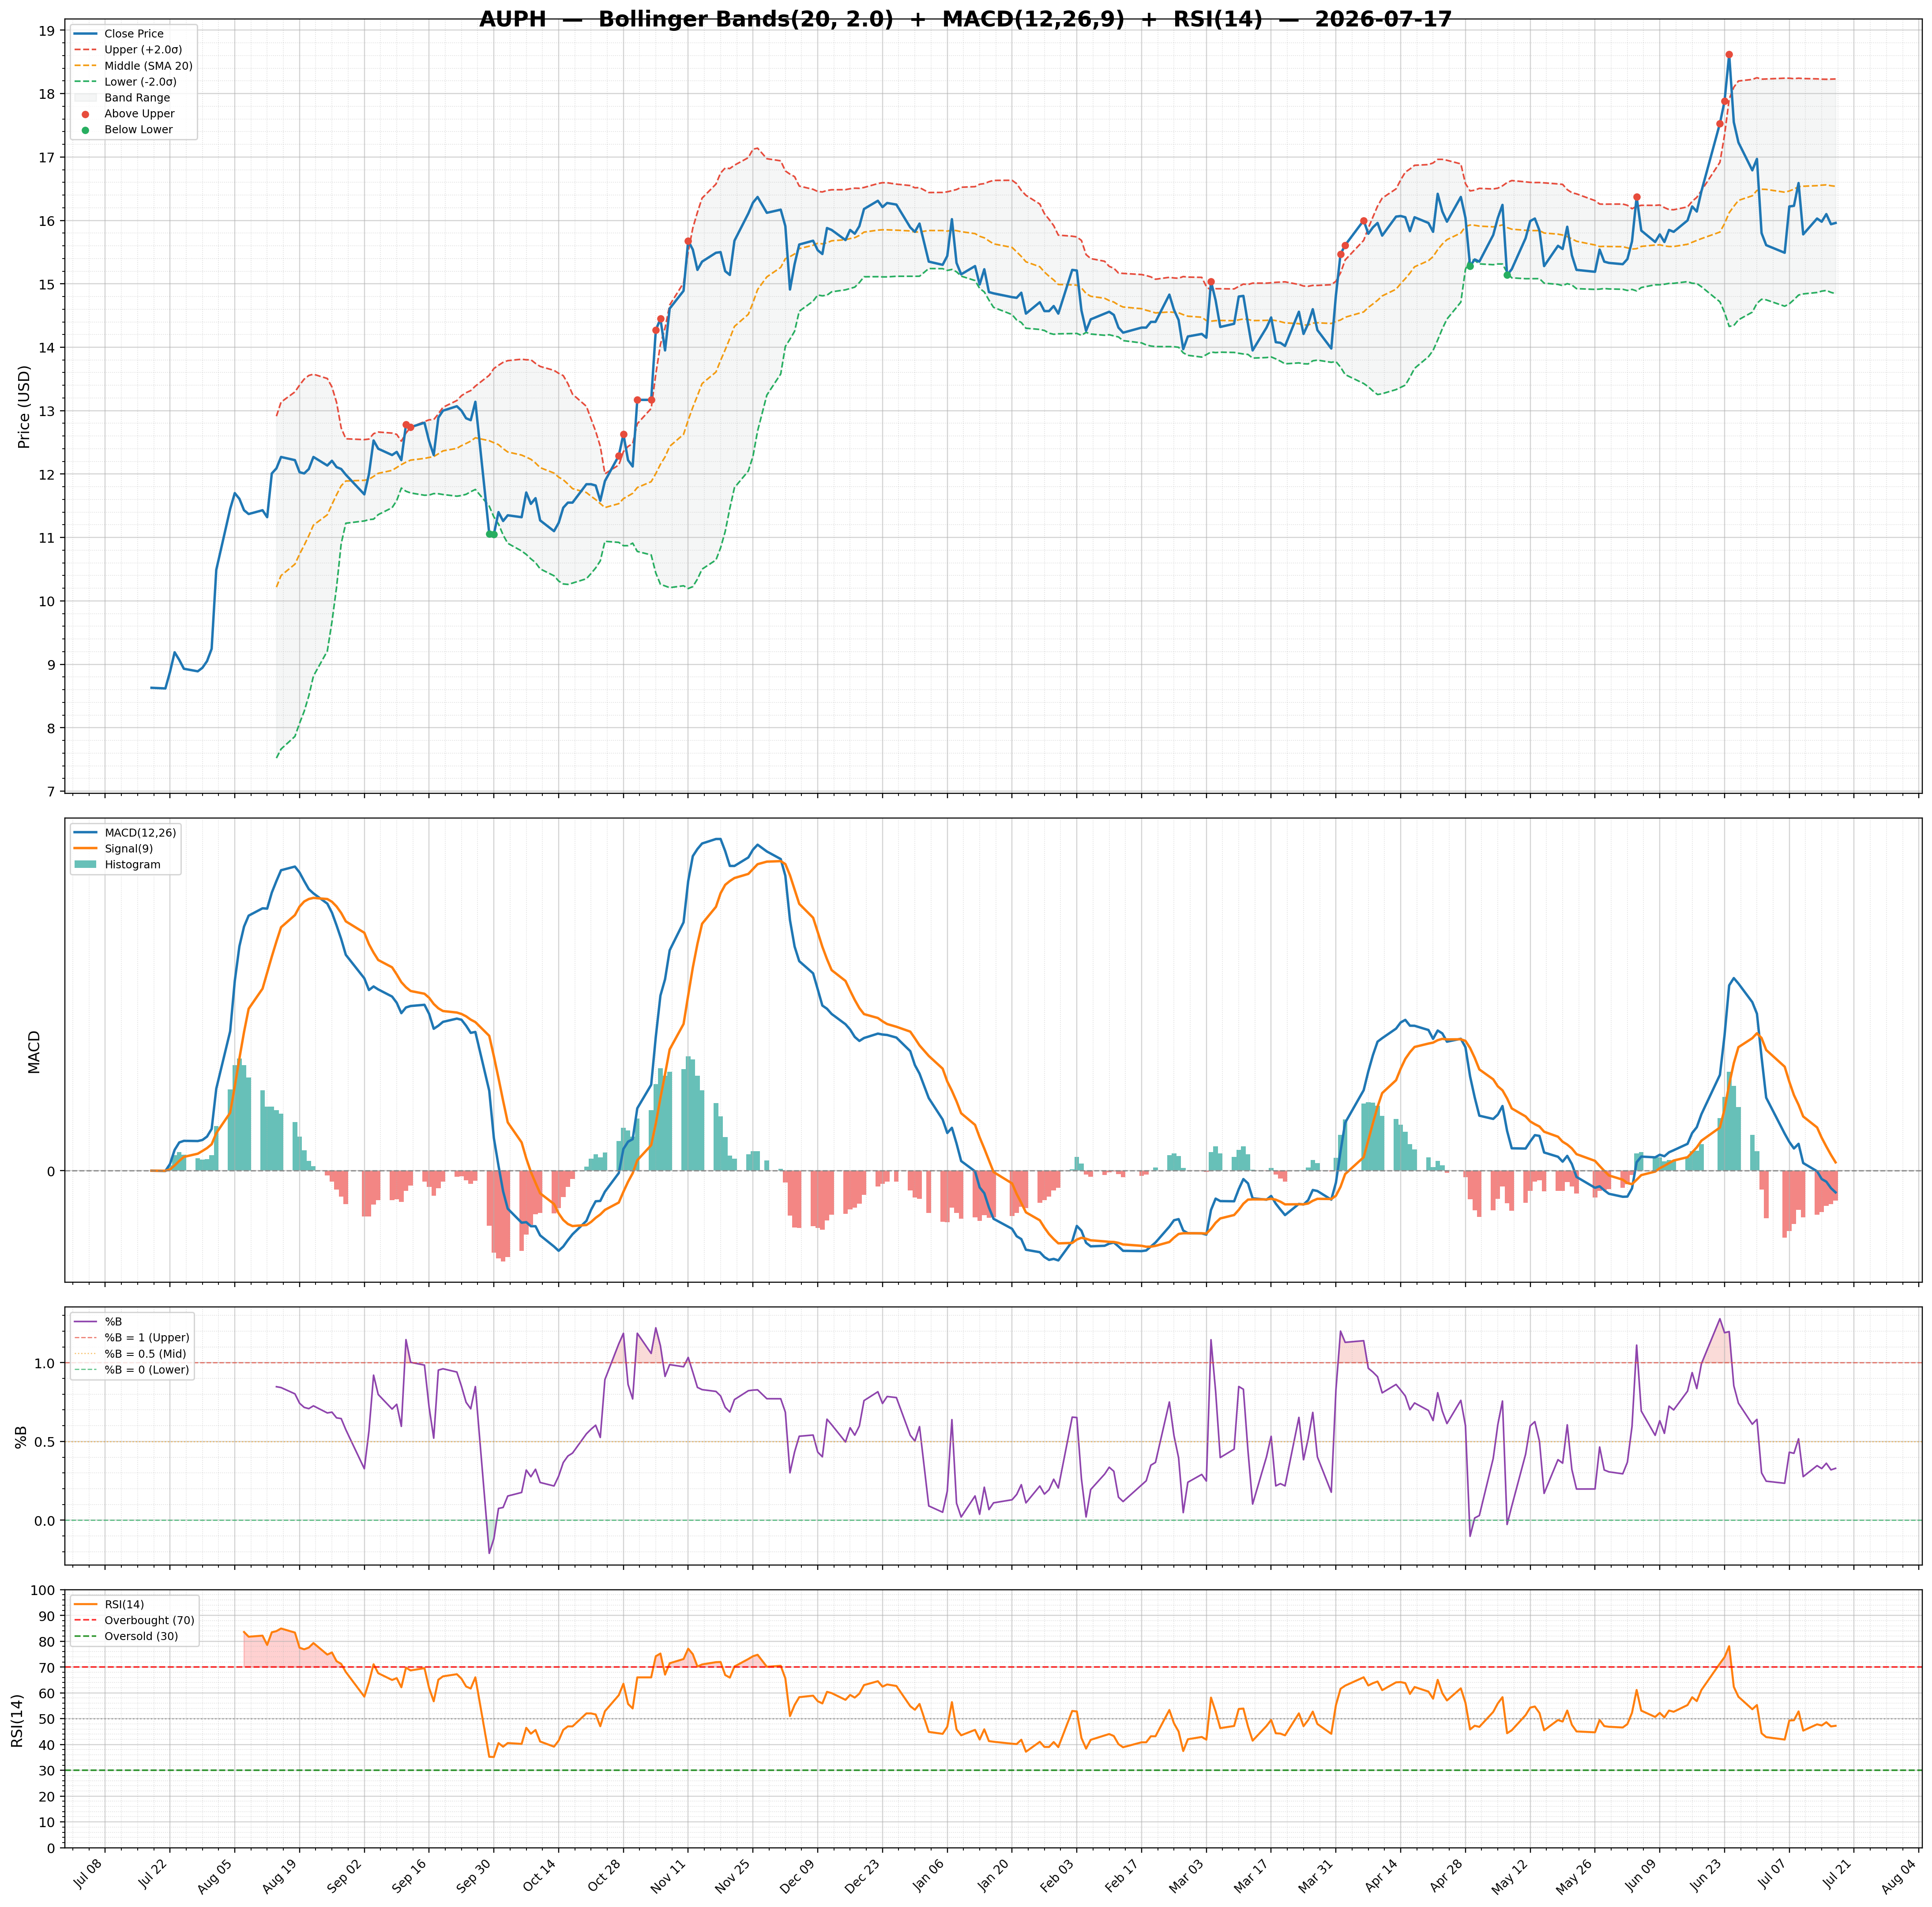
| 2026-07-17 | AUPH | 15.96 | / | 73.40% | buy | 741,047/2,082,267 | 20.47/0.33 | 47.25/-0.0900 | 0.27 | -0.06/0.02 | Chart 3M 🌐 |
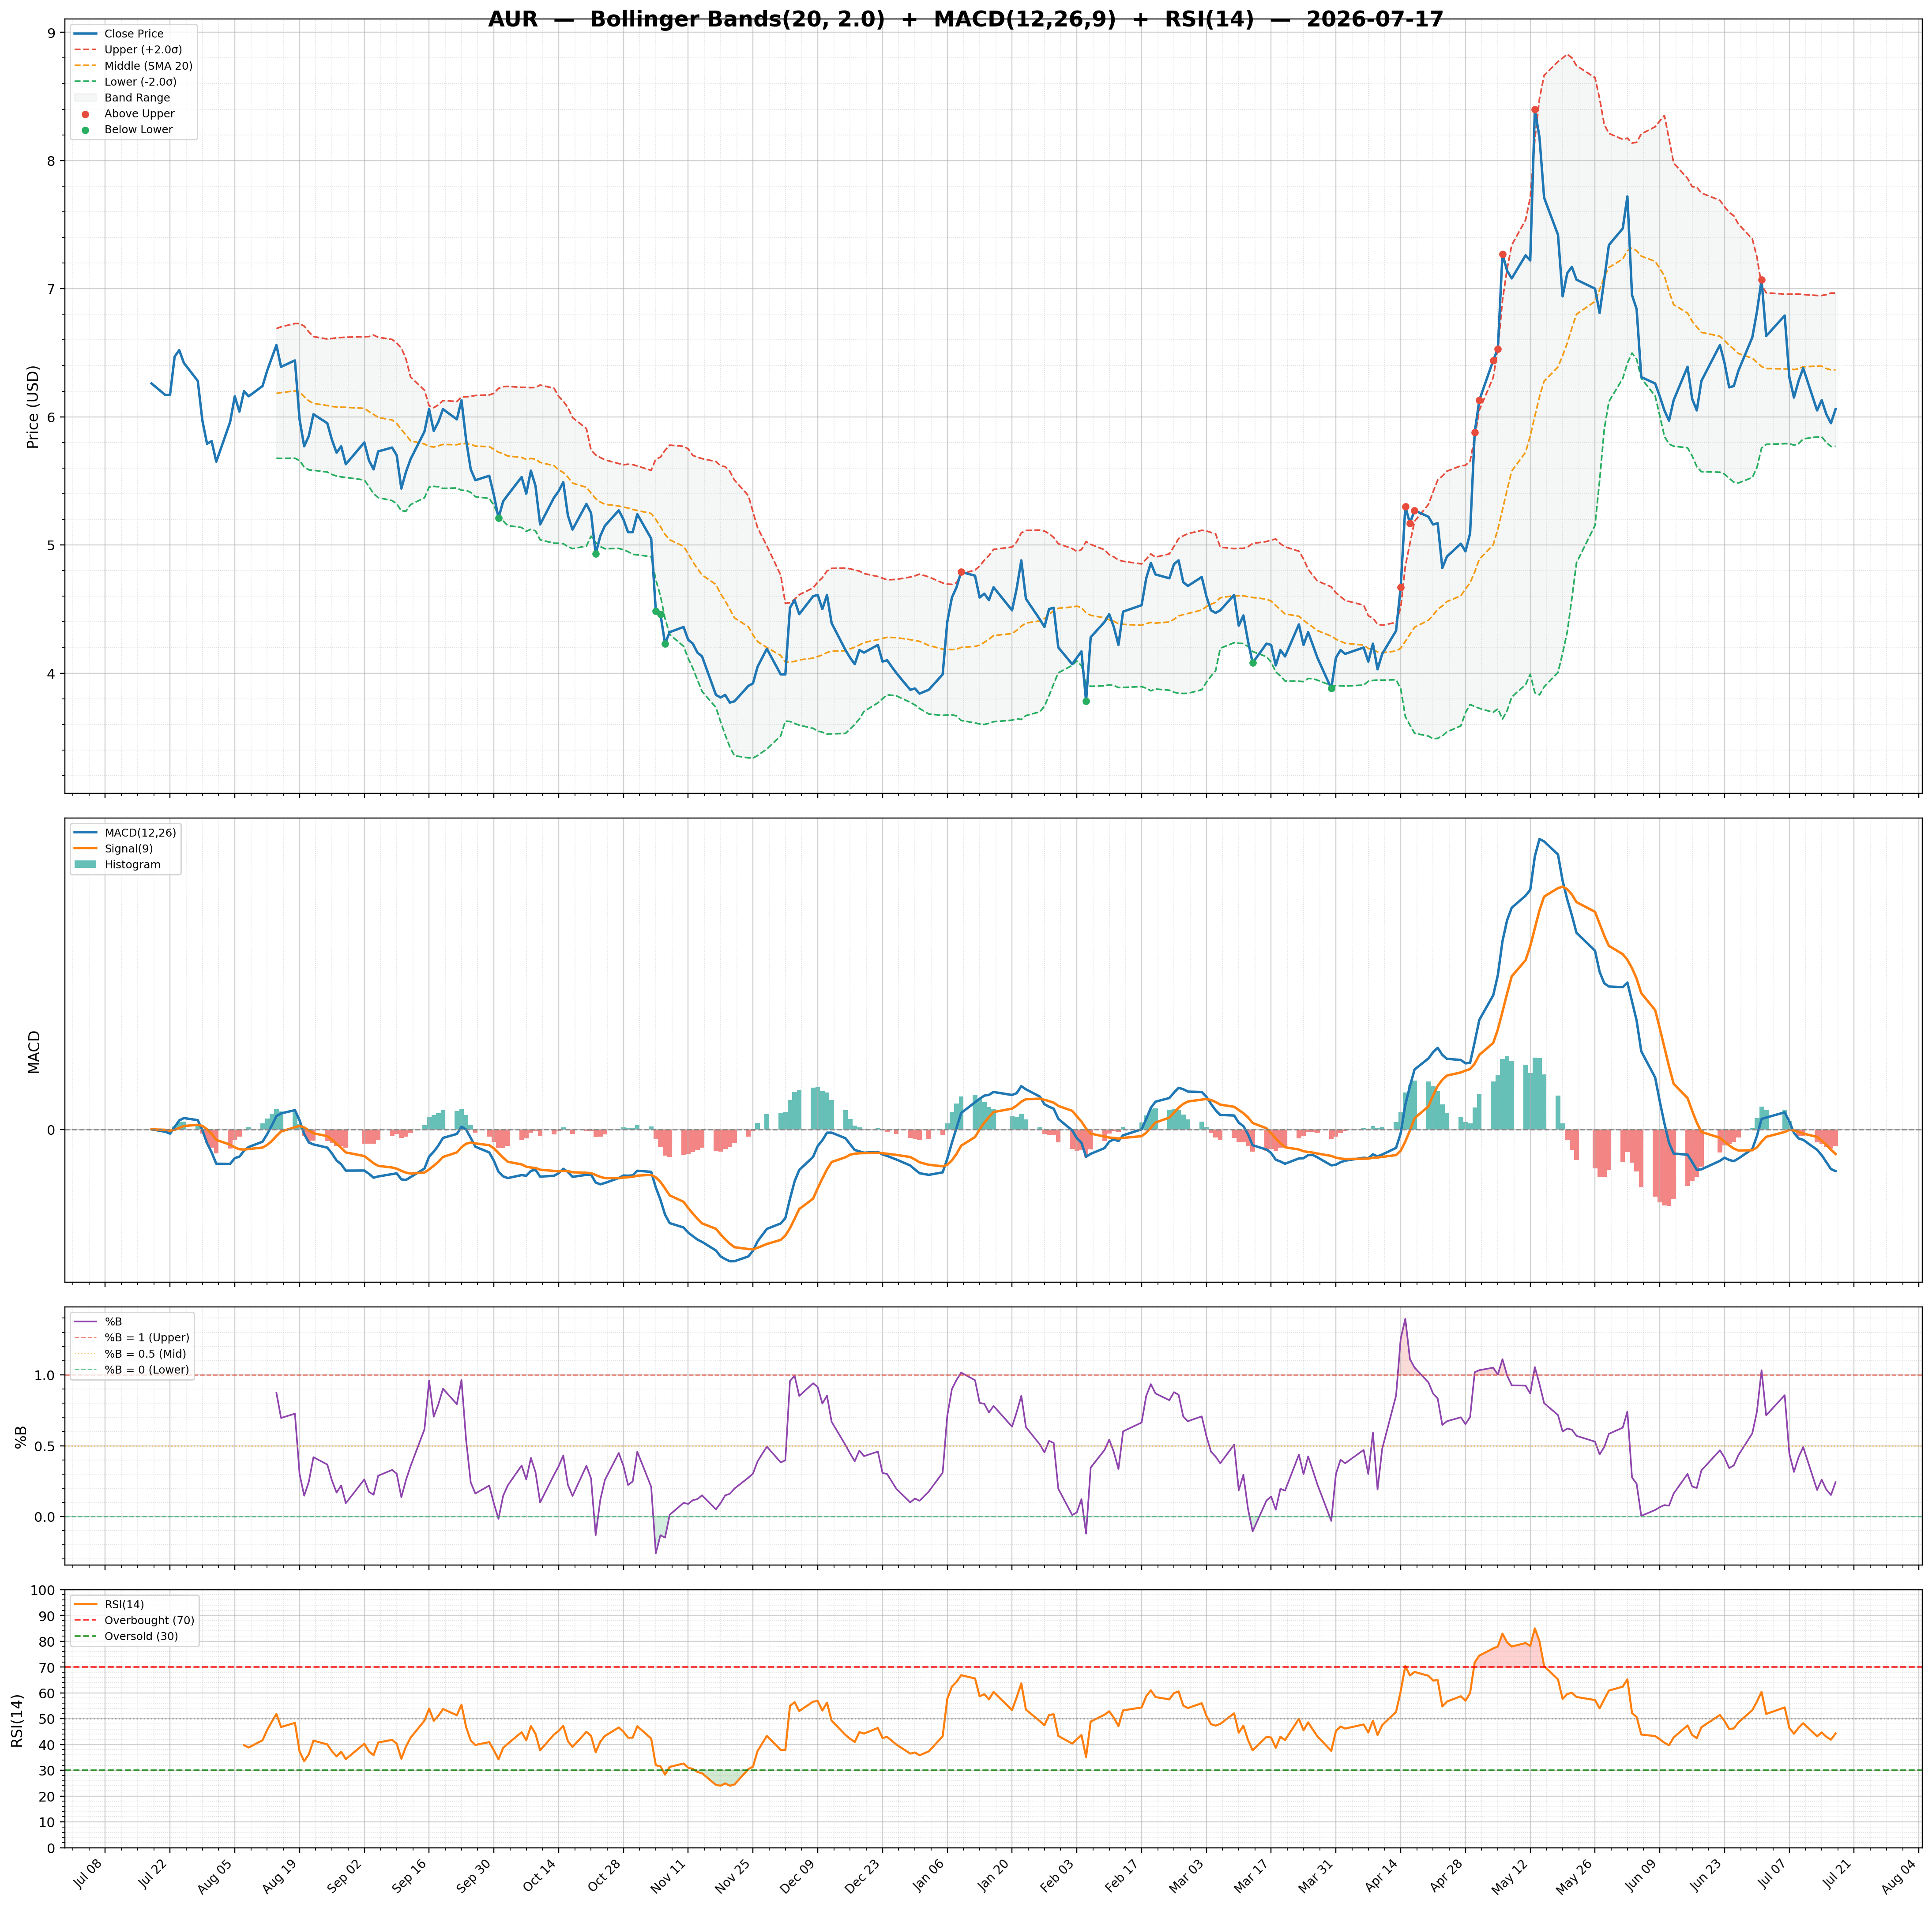
| 2026-07-17 | AUR | 6.06 | / | 49.46% | buy | 19,619,502/24,402,640 | 18.78/0.24 | 44.28/-0.0500 | 0.15 | -0.12/-0.07 | Chart 3M 🌐 |
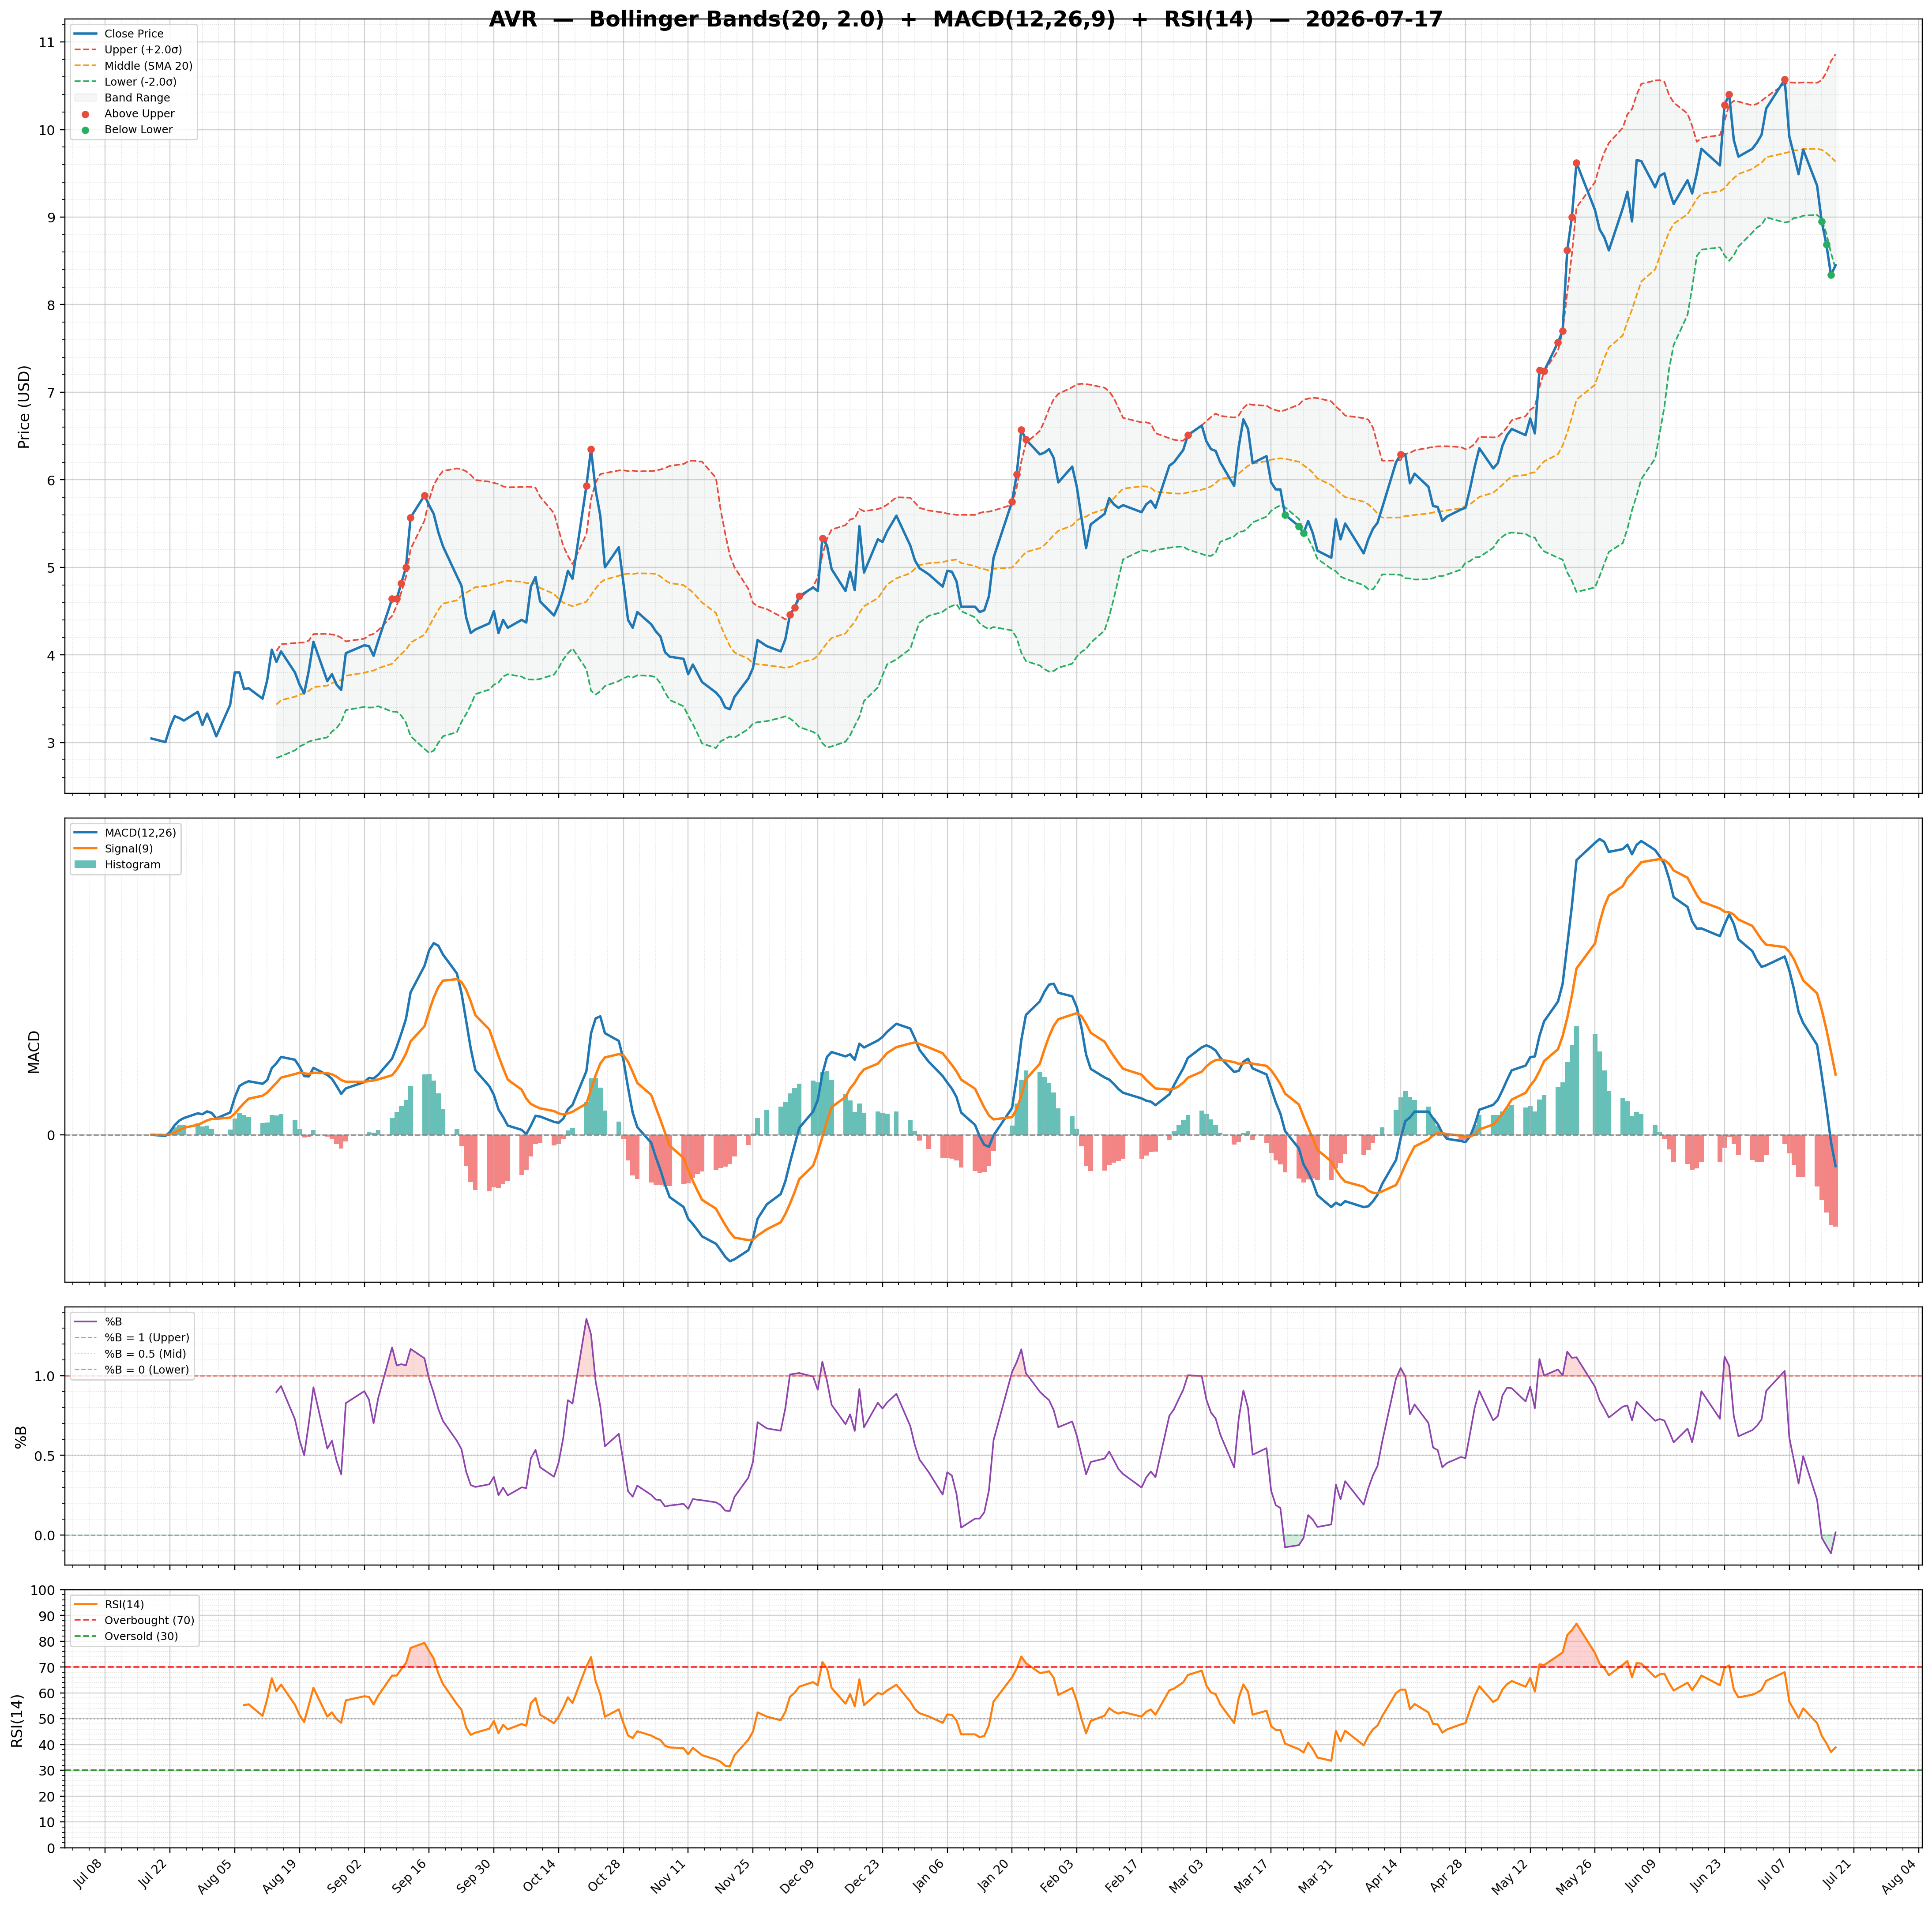
| 2026-07-17 | AVR | 8.45 | / | 71.99% | none | 1,129,958/1,547,948 | 25.44/0.02 | 38.86/-0.2500 | 0.87 | -0.09/0.17 | Chart 3M 🌐 |
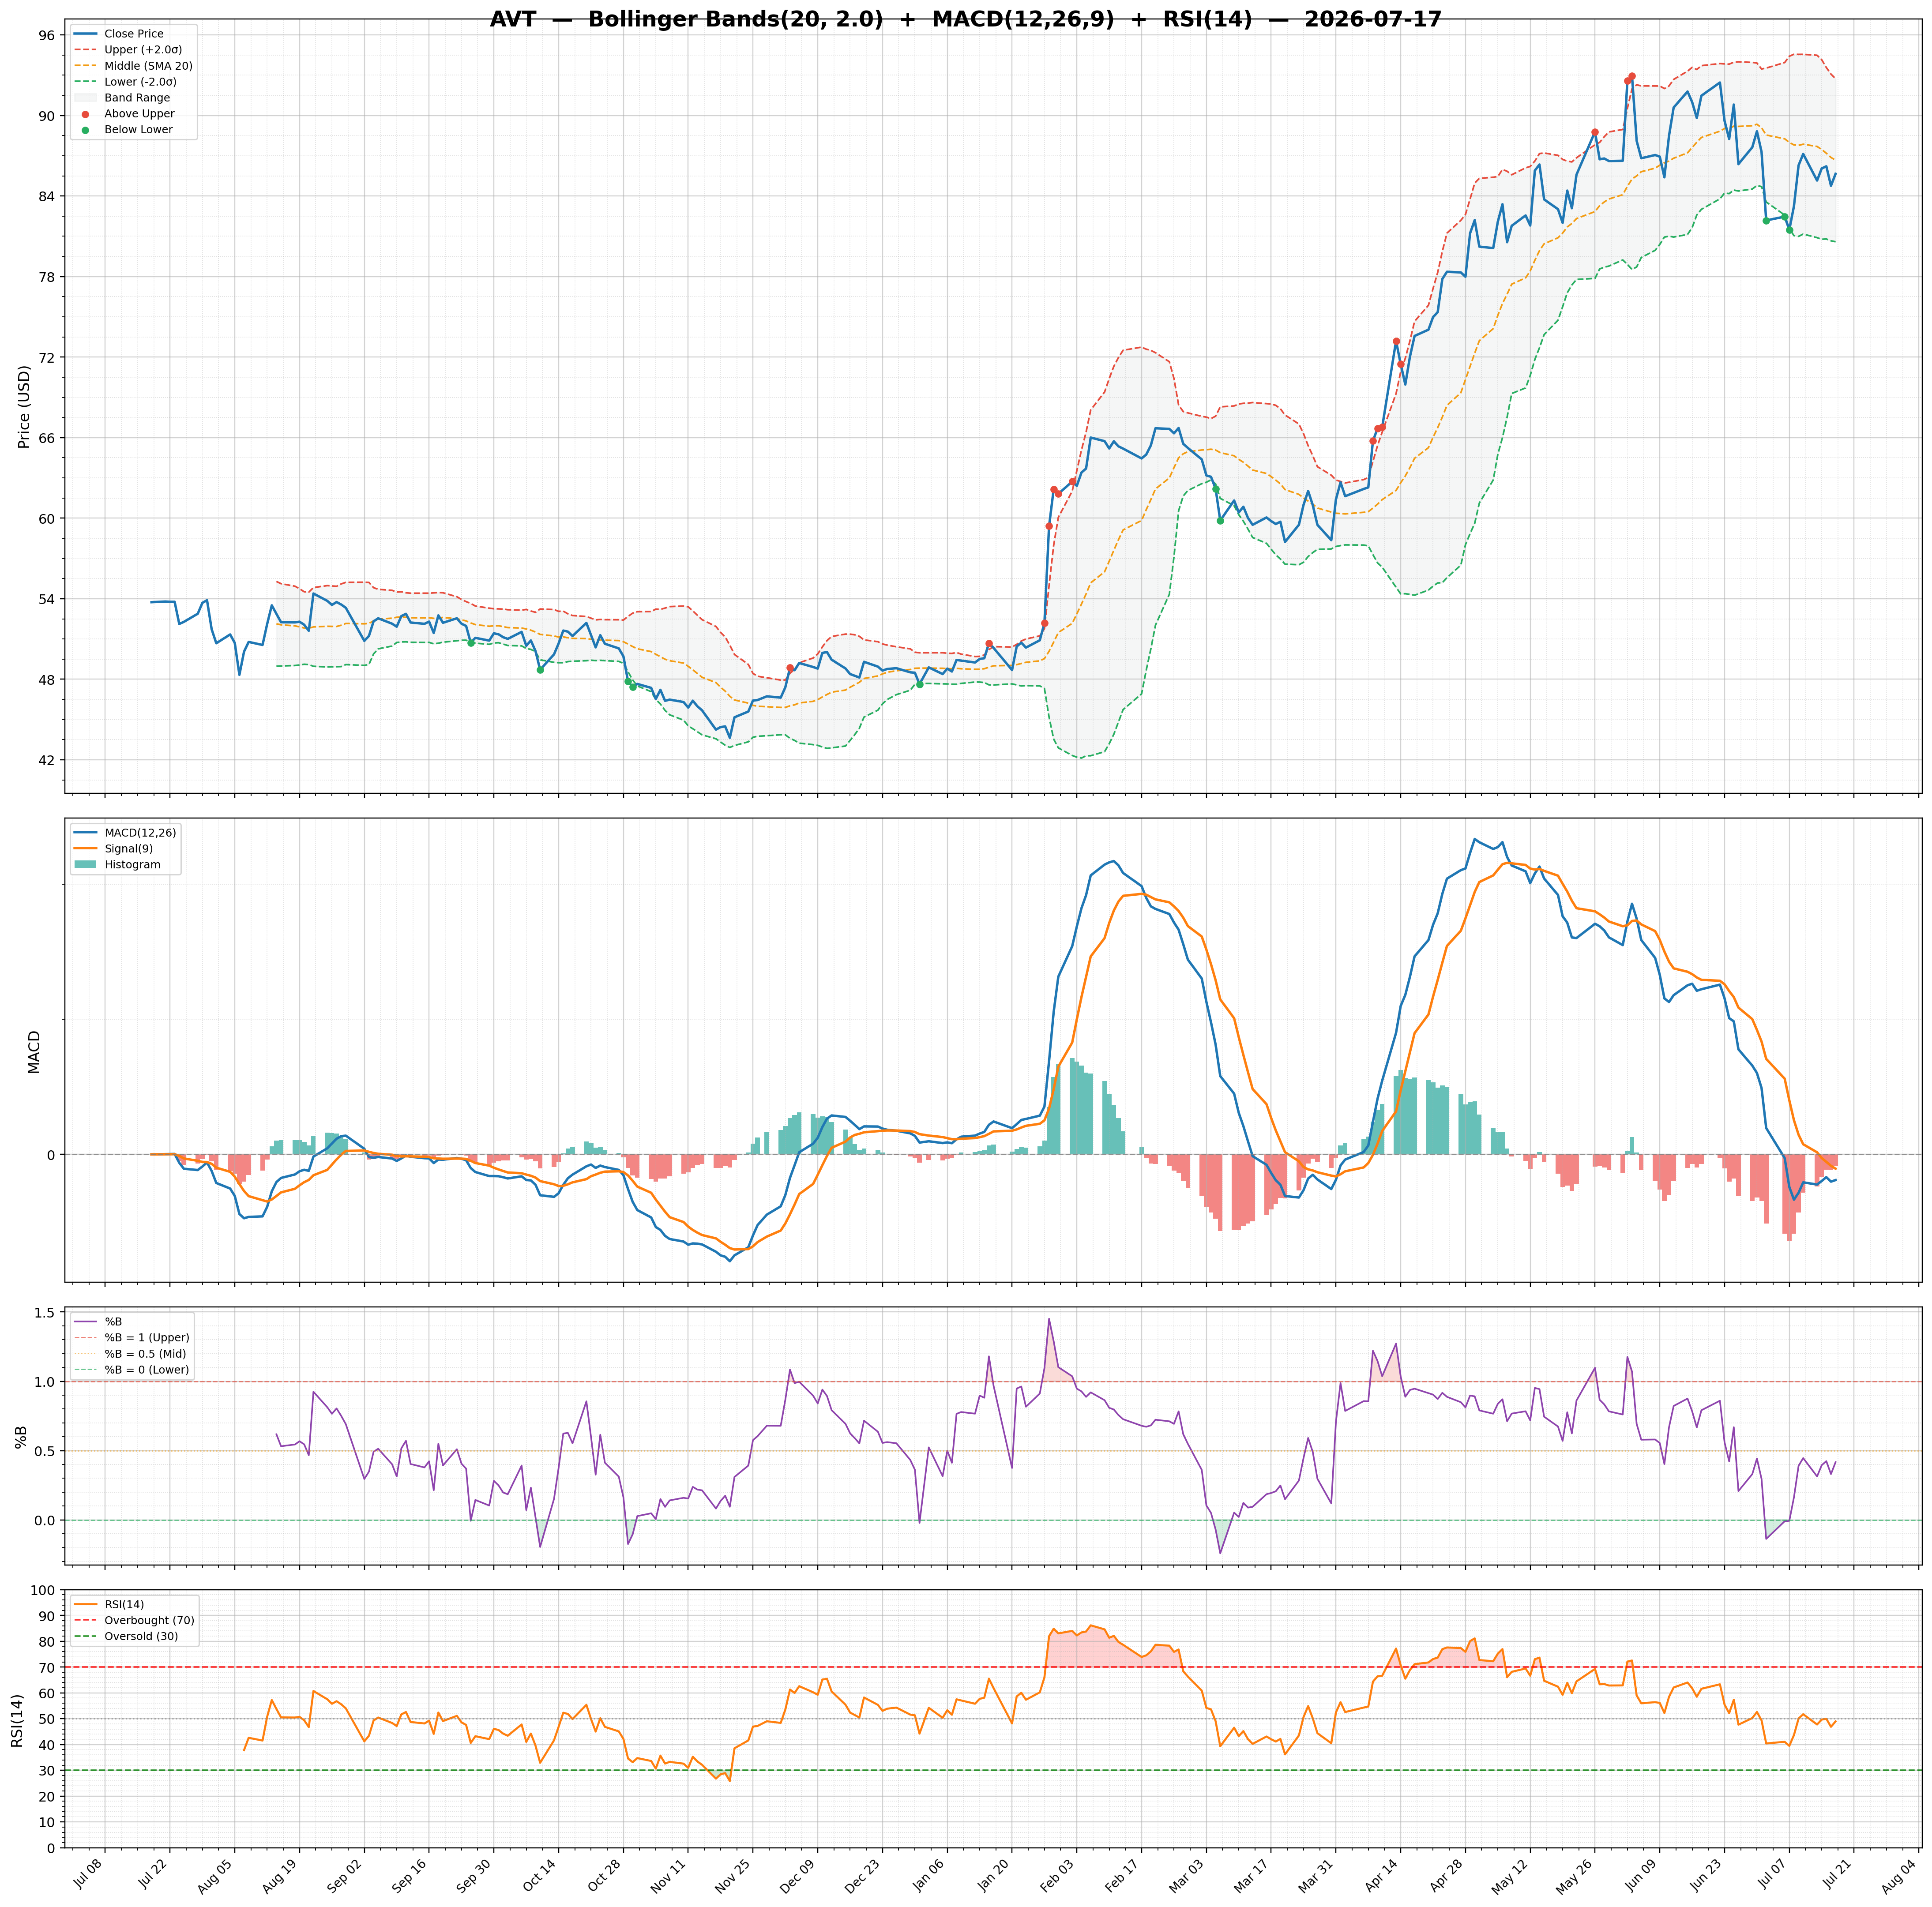
| 2026-07-17 | AVT | 85.65 | / | 85.23% | none | 884,460/1,283,608 | 14.02/0.42 | 48.97/-0.1700 | 0.48 | -0.38/-0.21 | Chart 3M 🌐 |
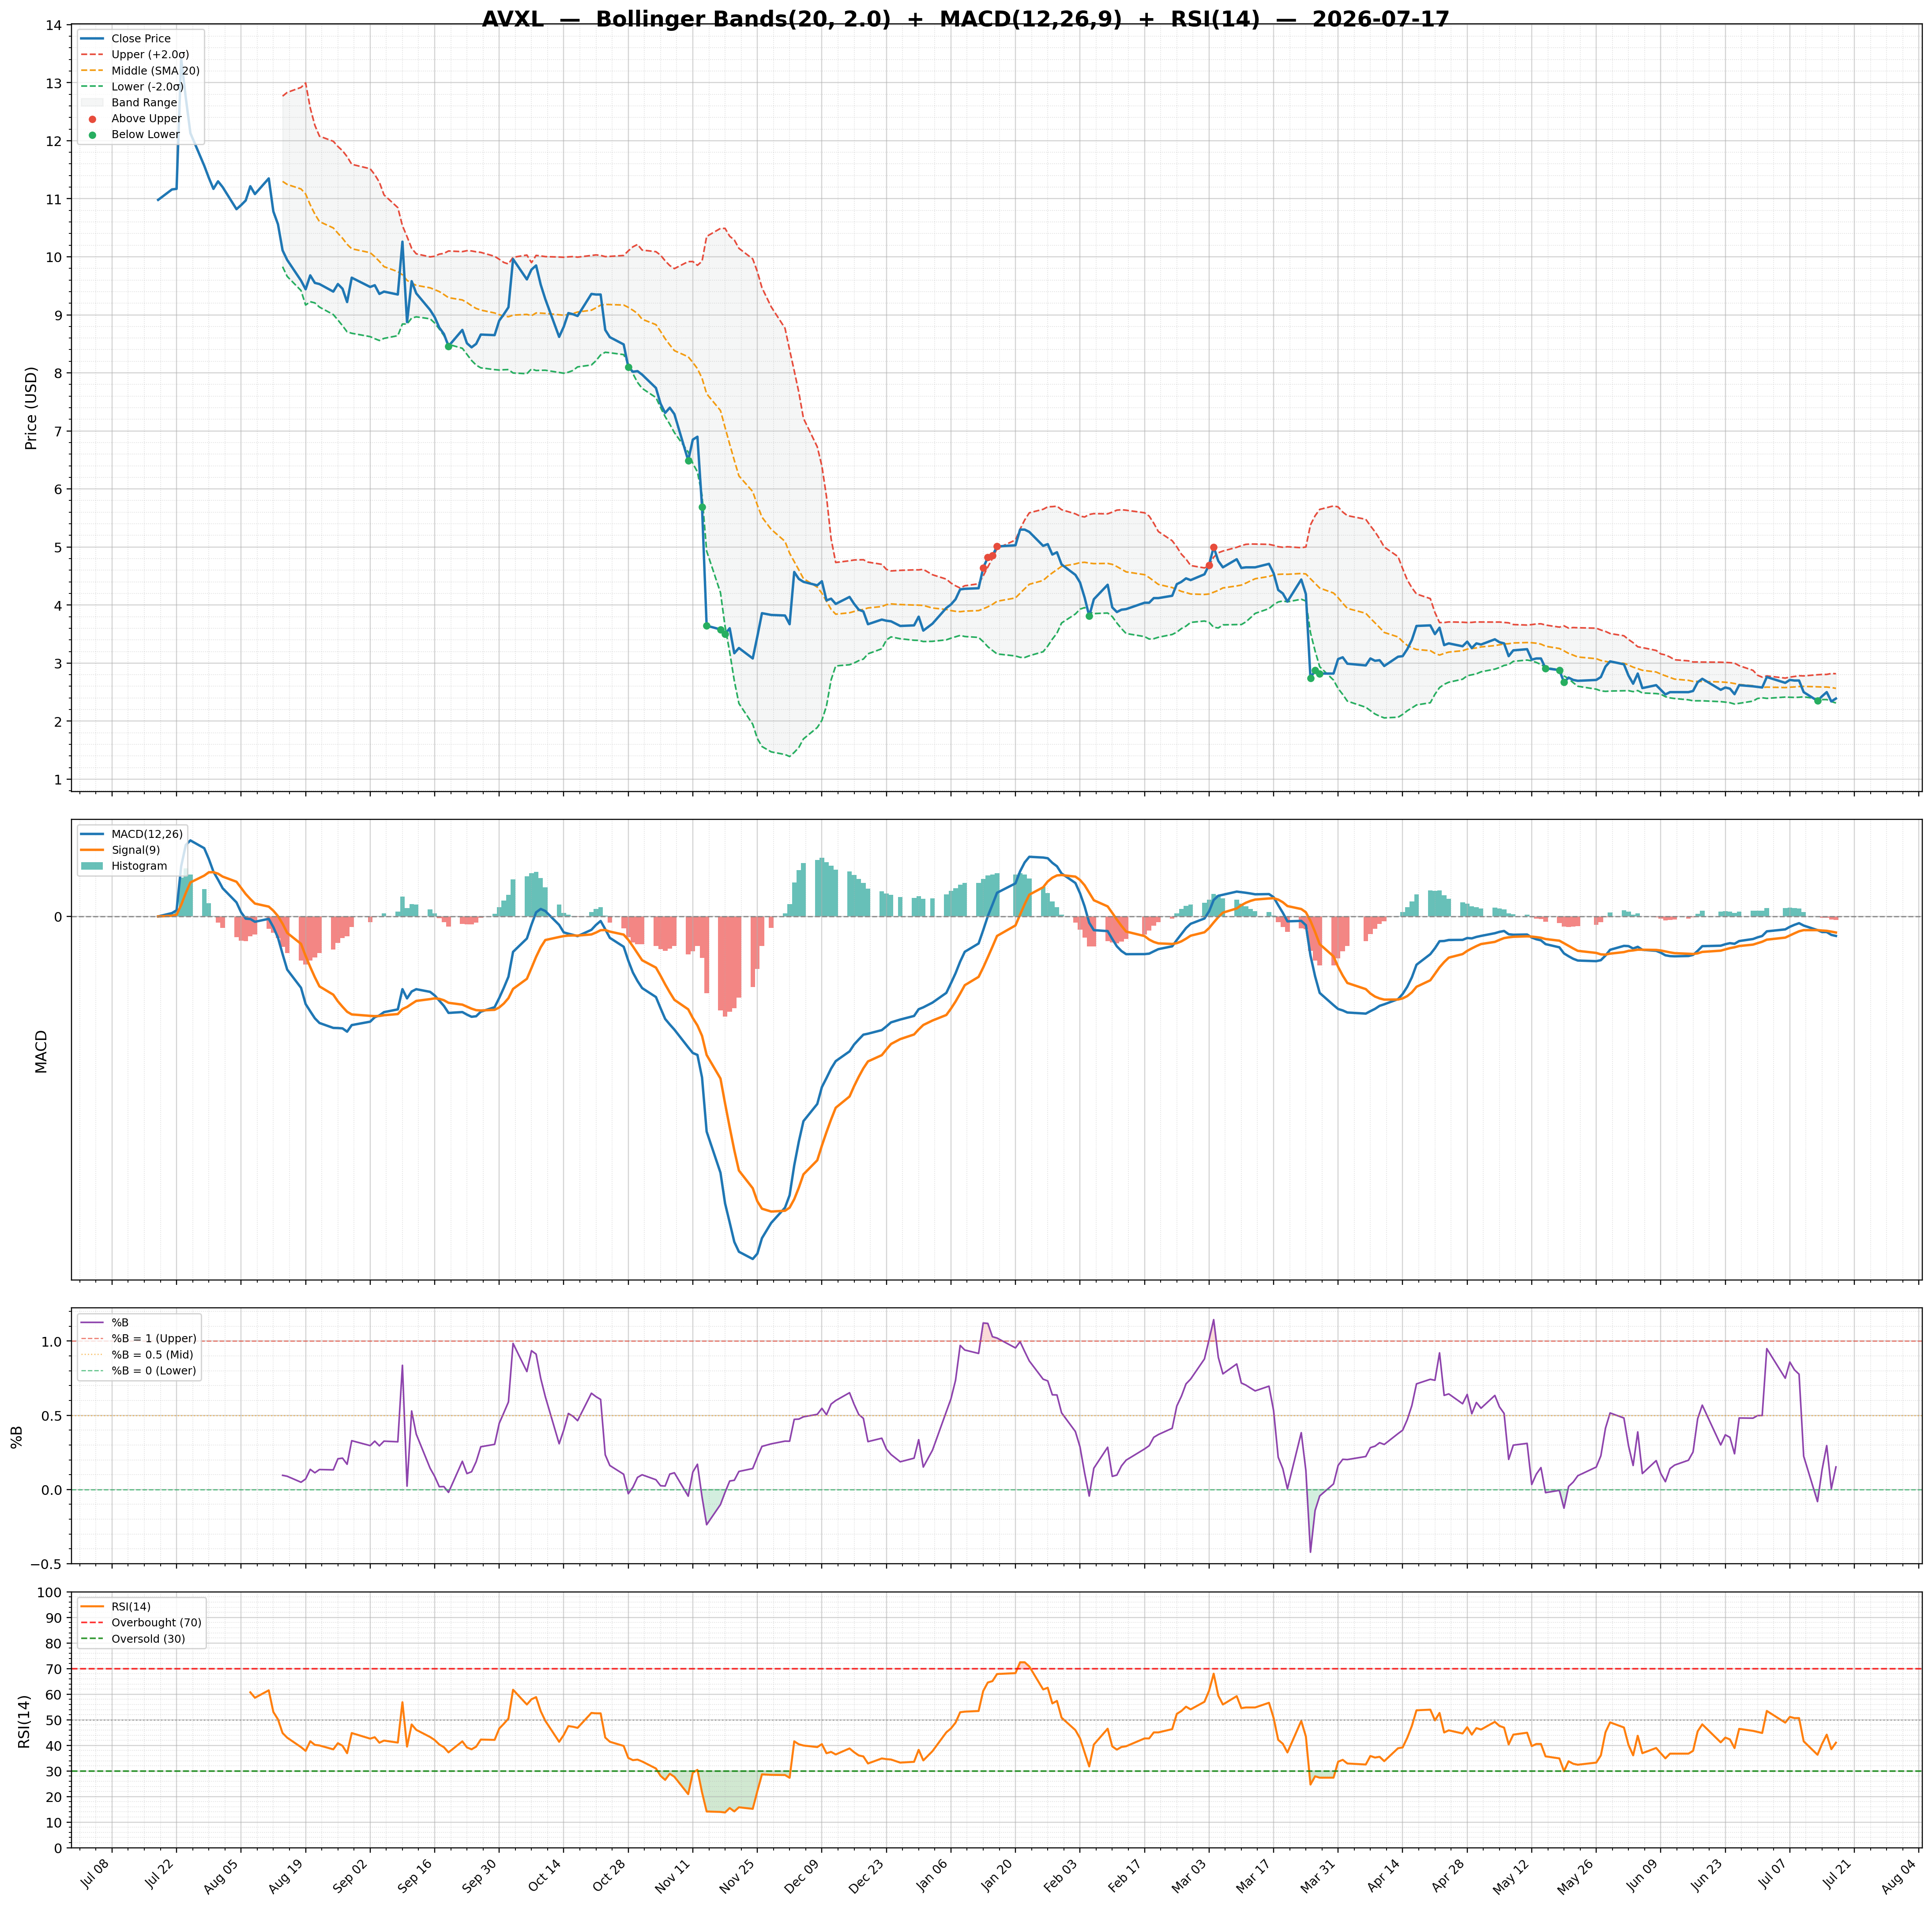
| 2026-07-17 | AVXL | 2.39 | / | 0.45% | none | 1,912,661/1,513,158 | 19.66/0.15 | 41.07/-0.0200 | -0.52 | -0.08/-0.07 | Chart 3M 🌐 |
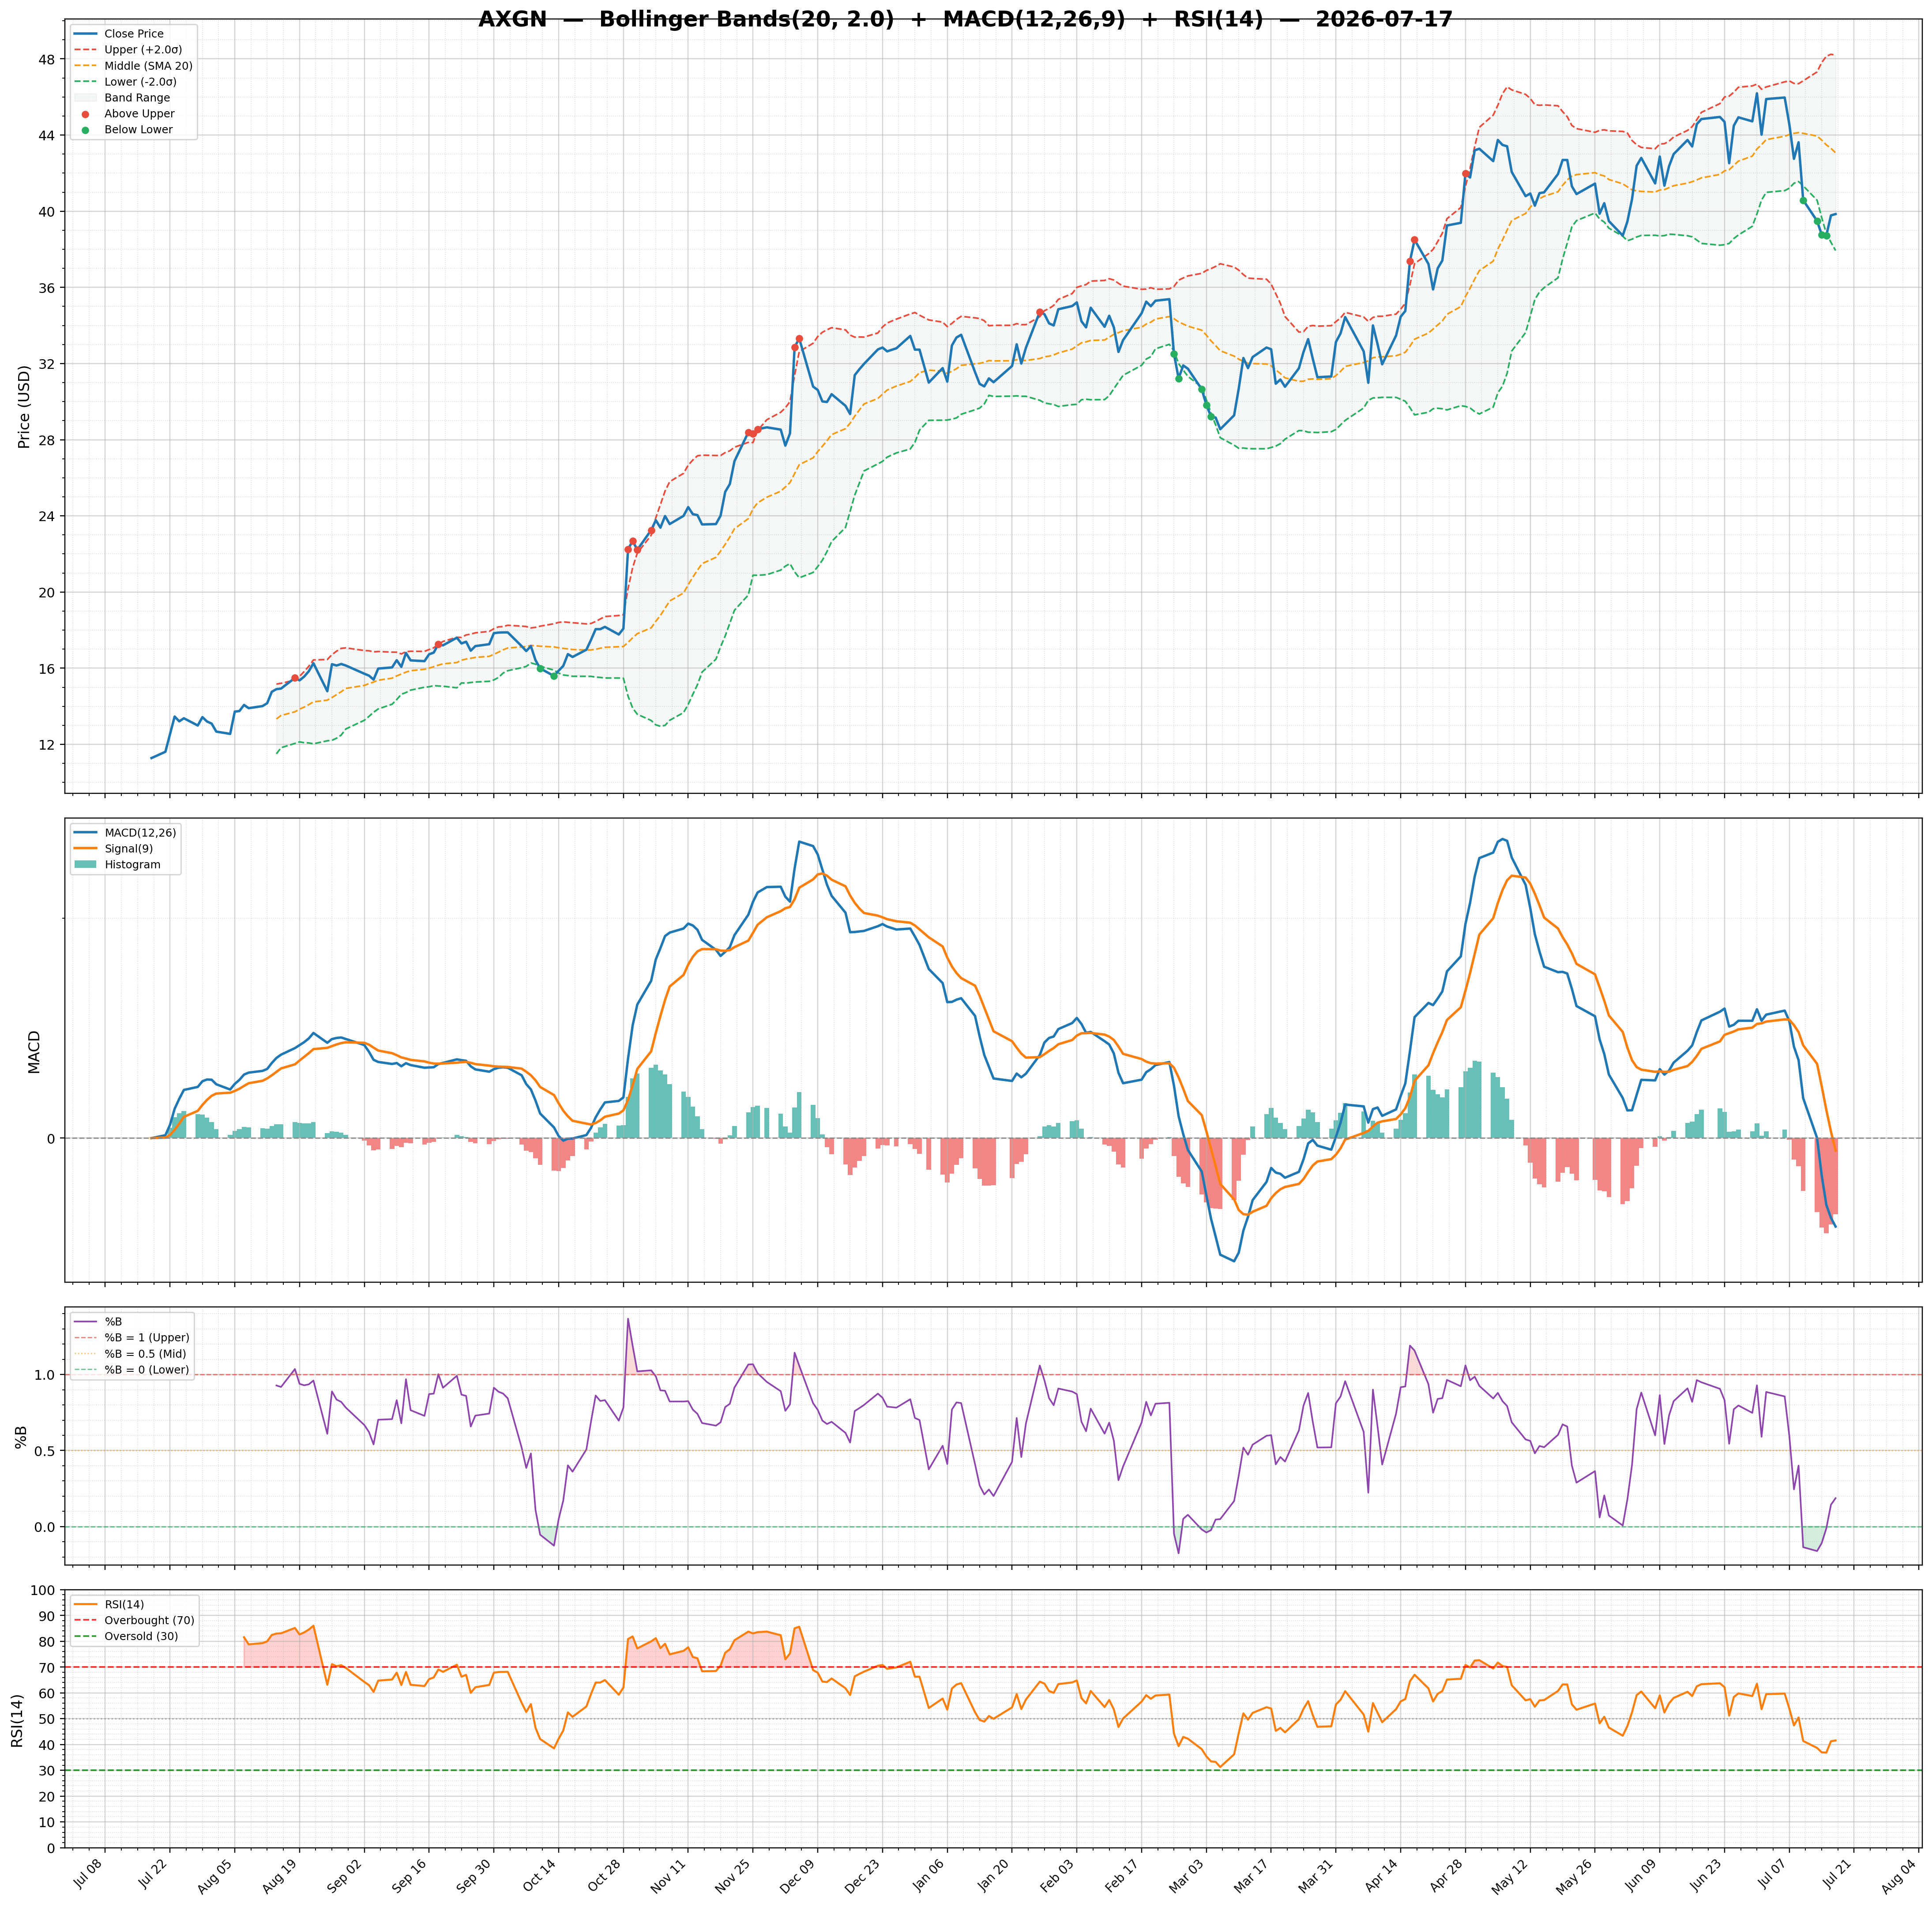
| 2026-07-17 | AXGN | 39.85 | / | 81.84% | strong_buy | 1,174,868/1,518,003 | 23.83/0.19 | 41.56/-0.6900 | 0.87 | -0.80/-0.11 | Chart 3M 🌐 |
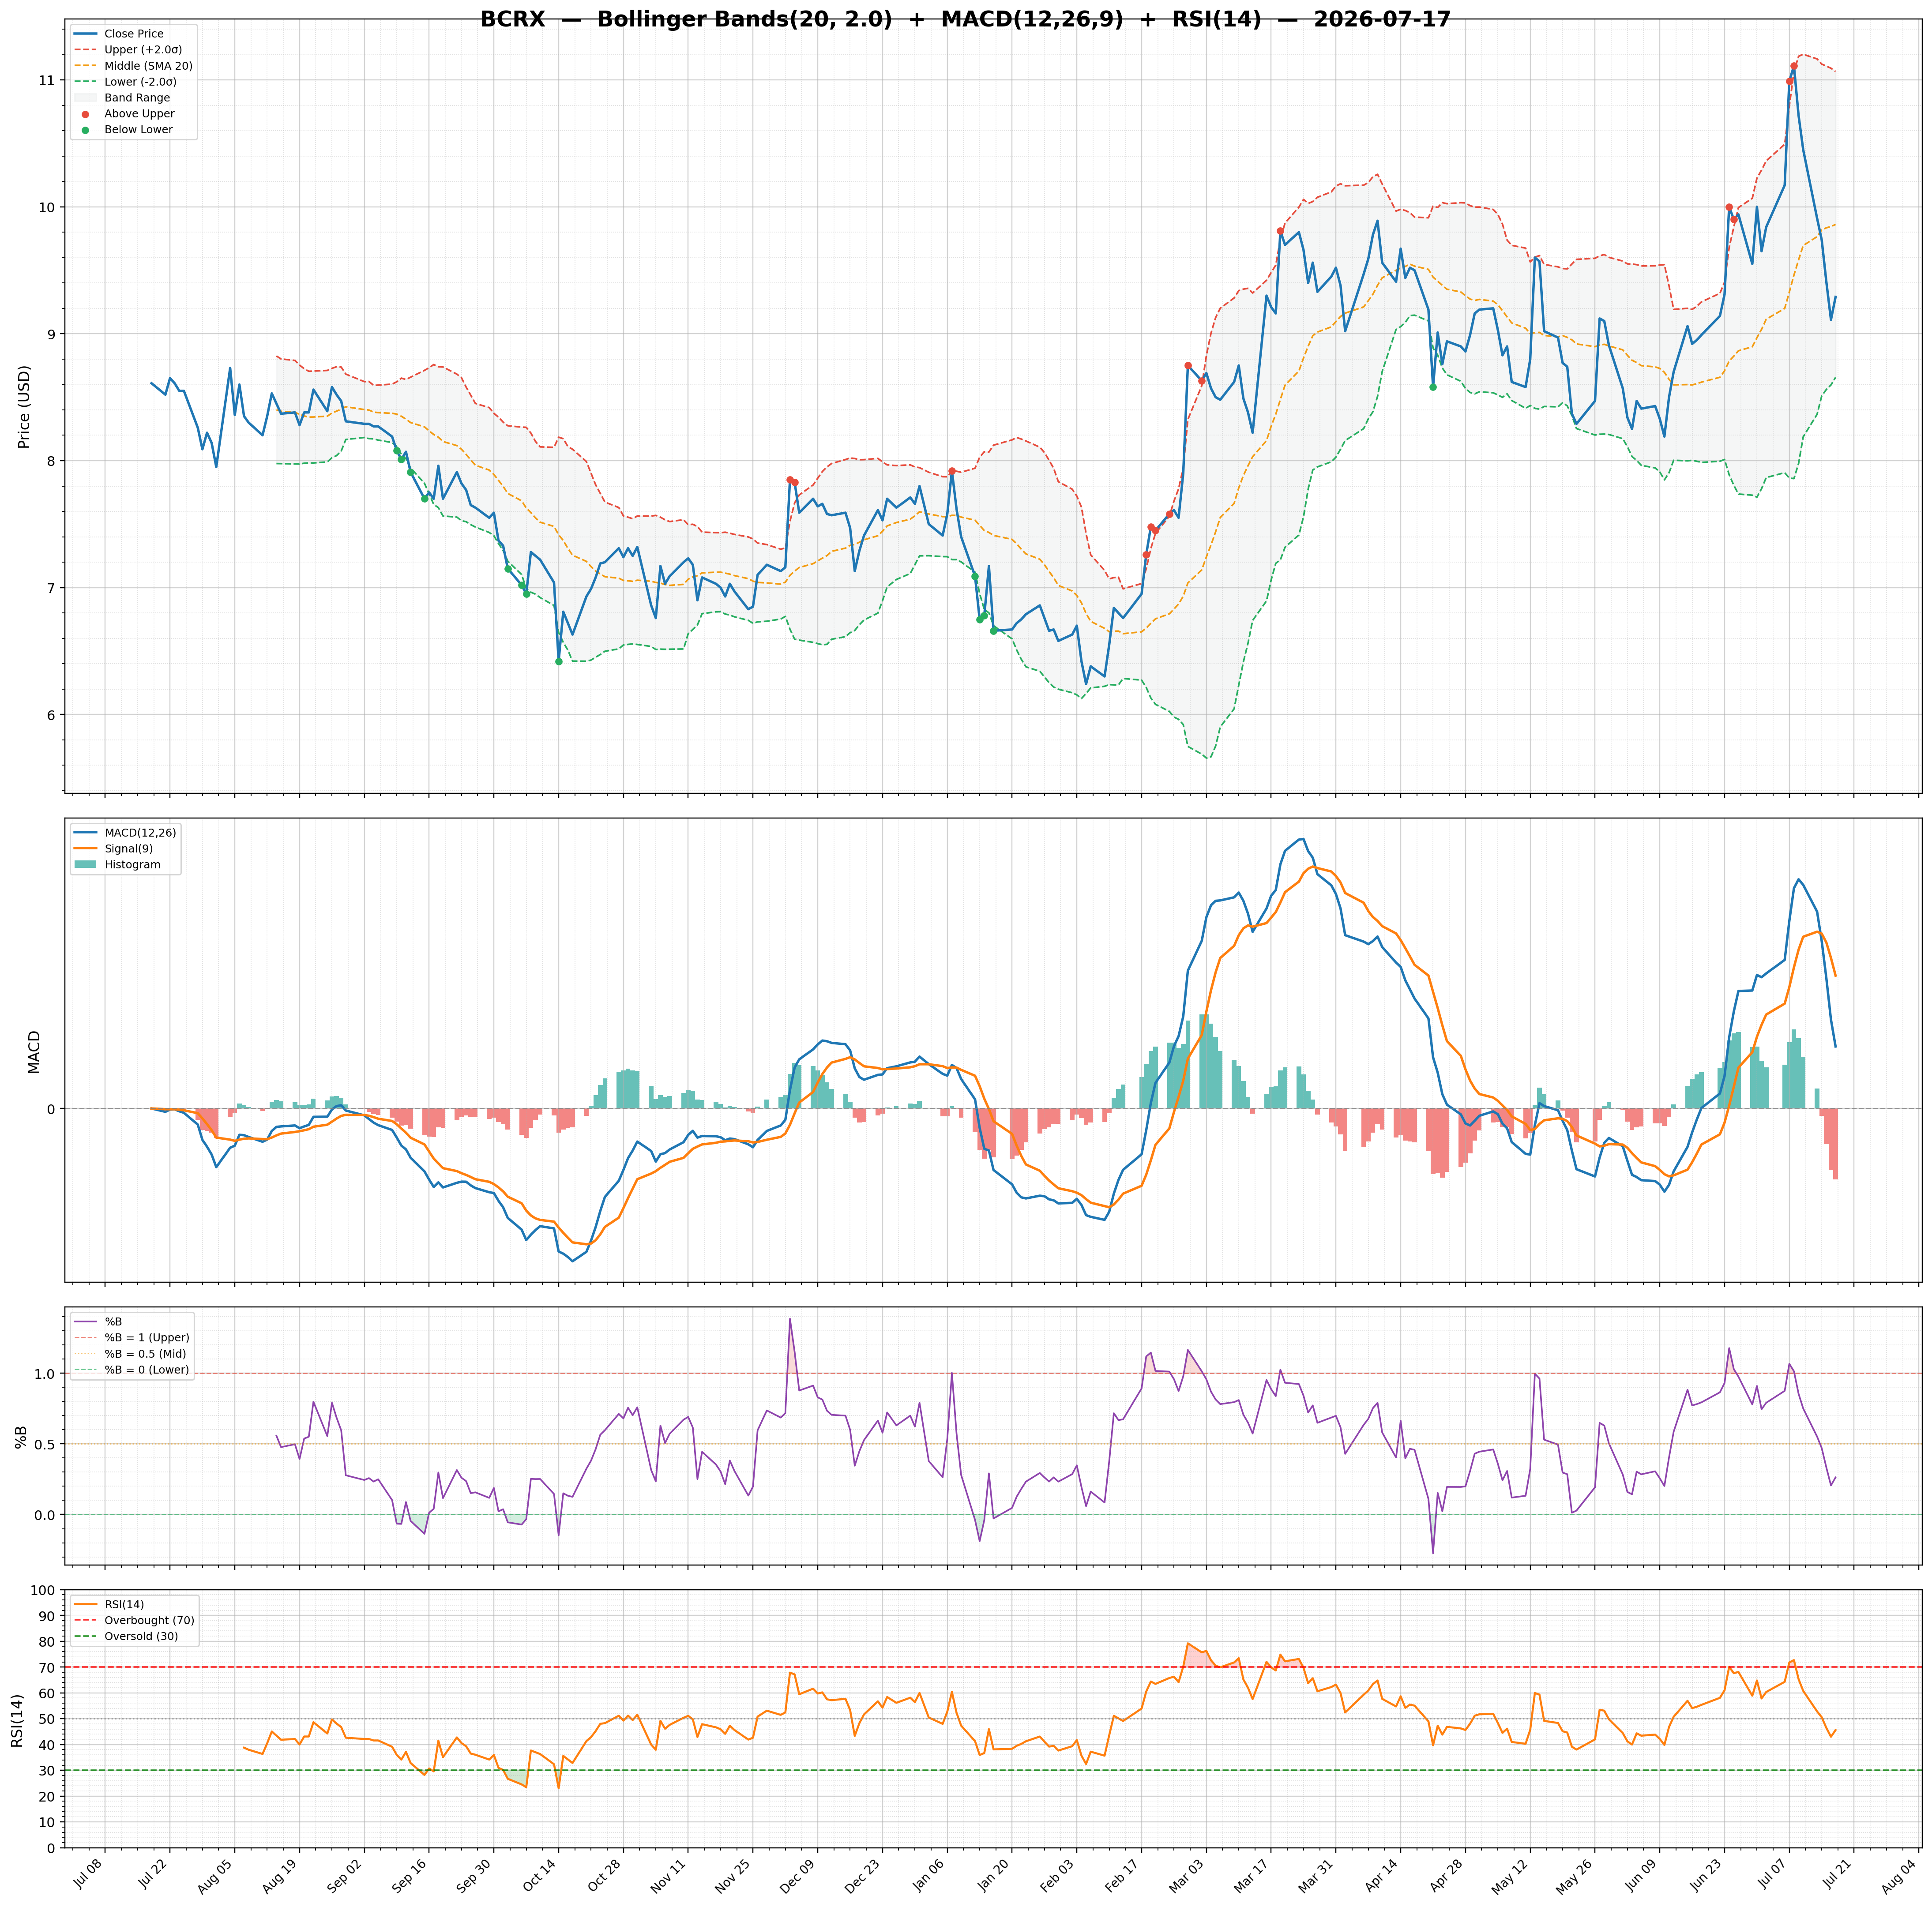
| 2026-07-17 | BCRX | 9.29 | / | 62.63% | strong_buy | 3,268,325/6,707,426 | 24.44/0.26 | 45.60/-0.1500 | 0.17 | 0.14/0.29 | Chart 3M 🌐 |
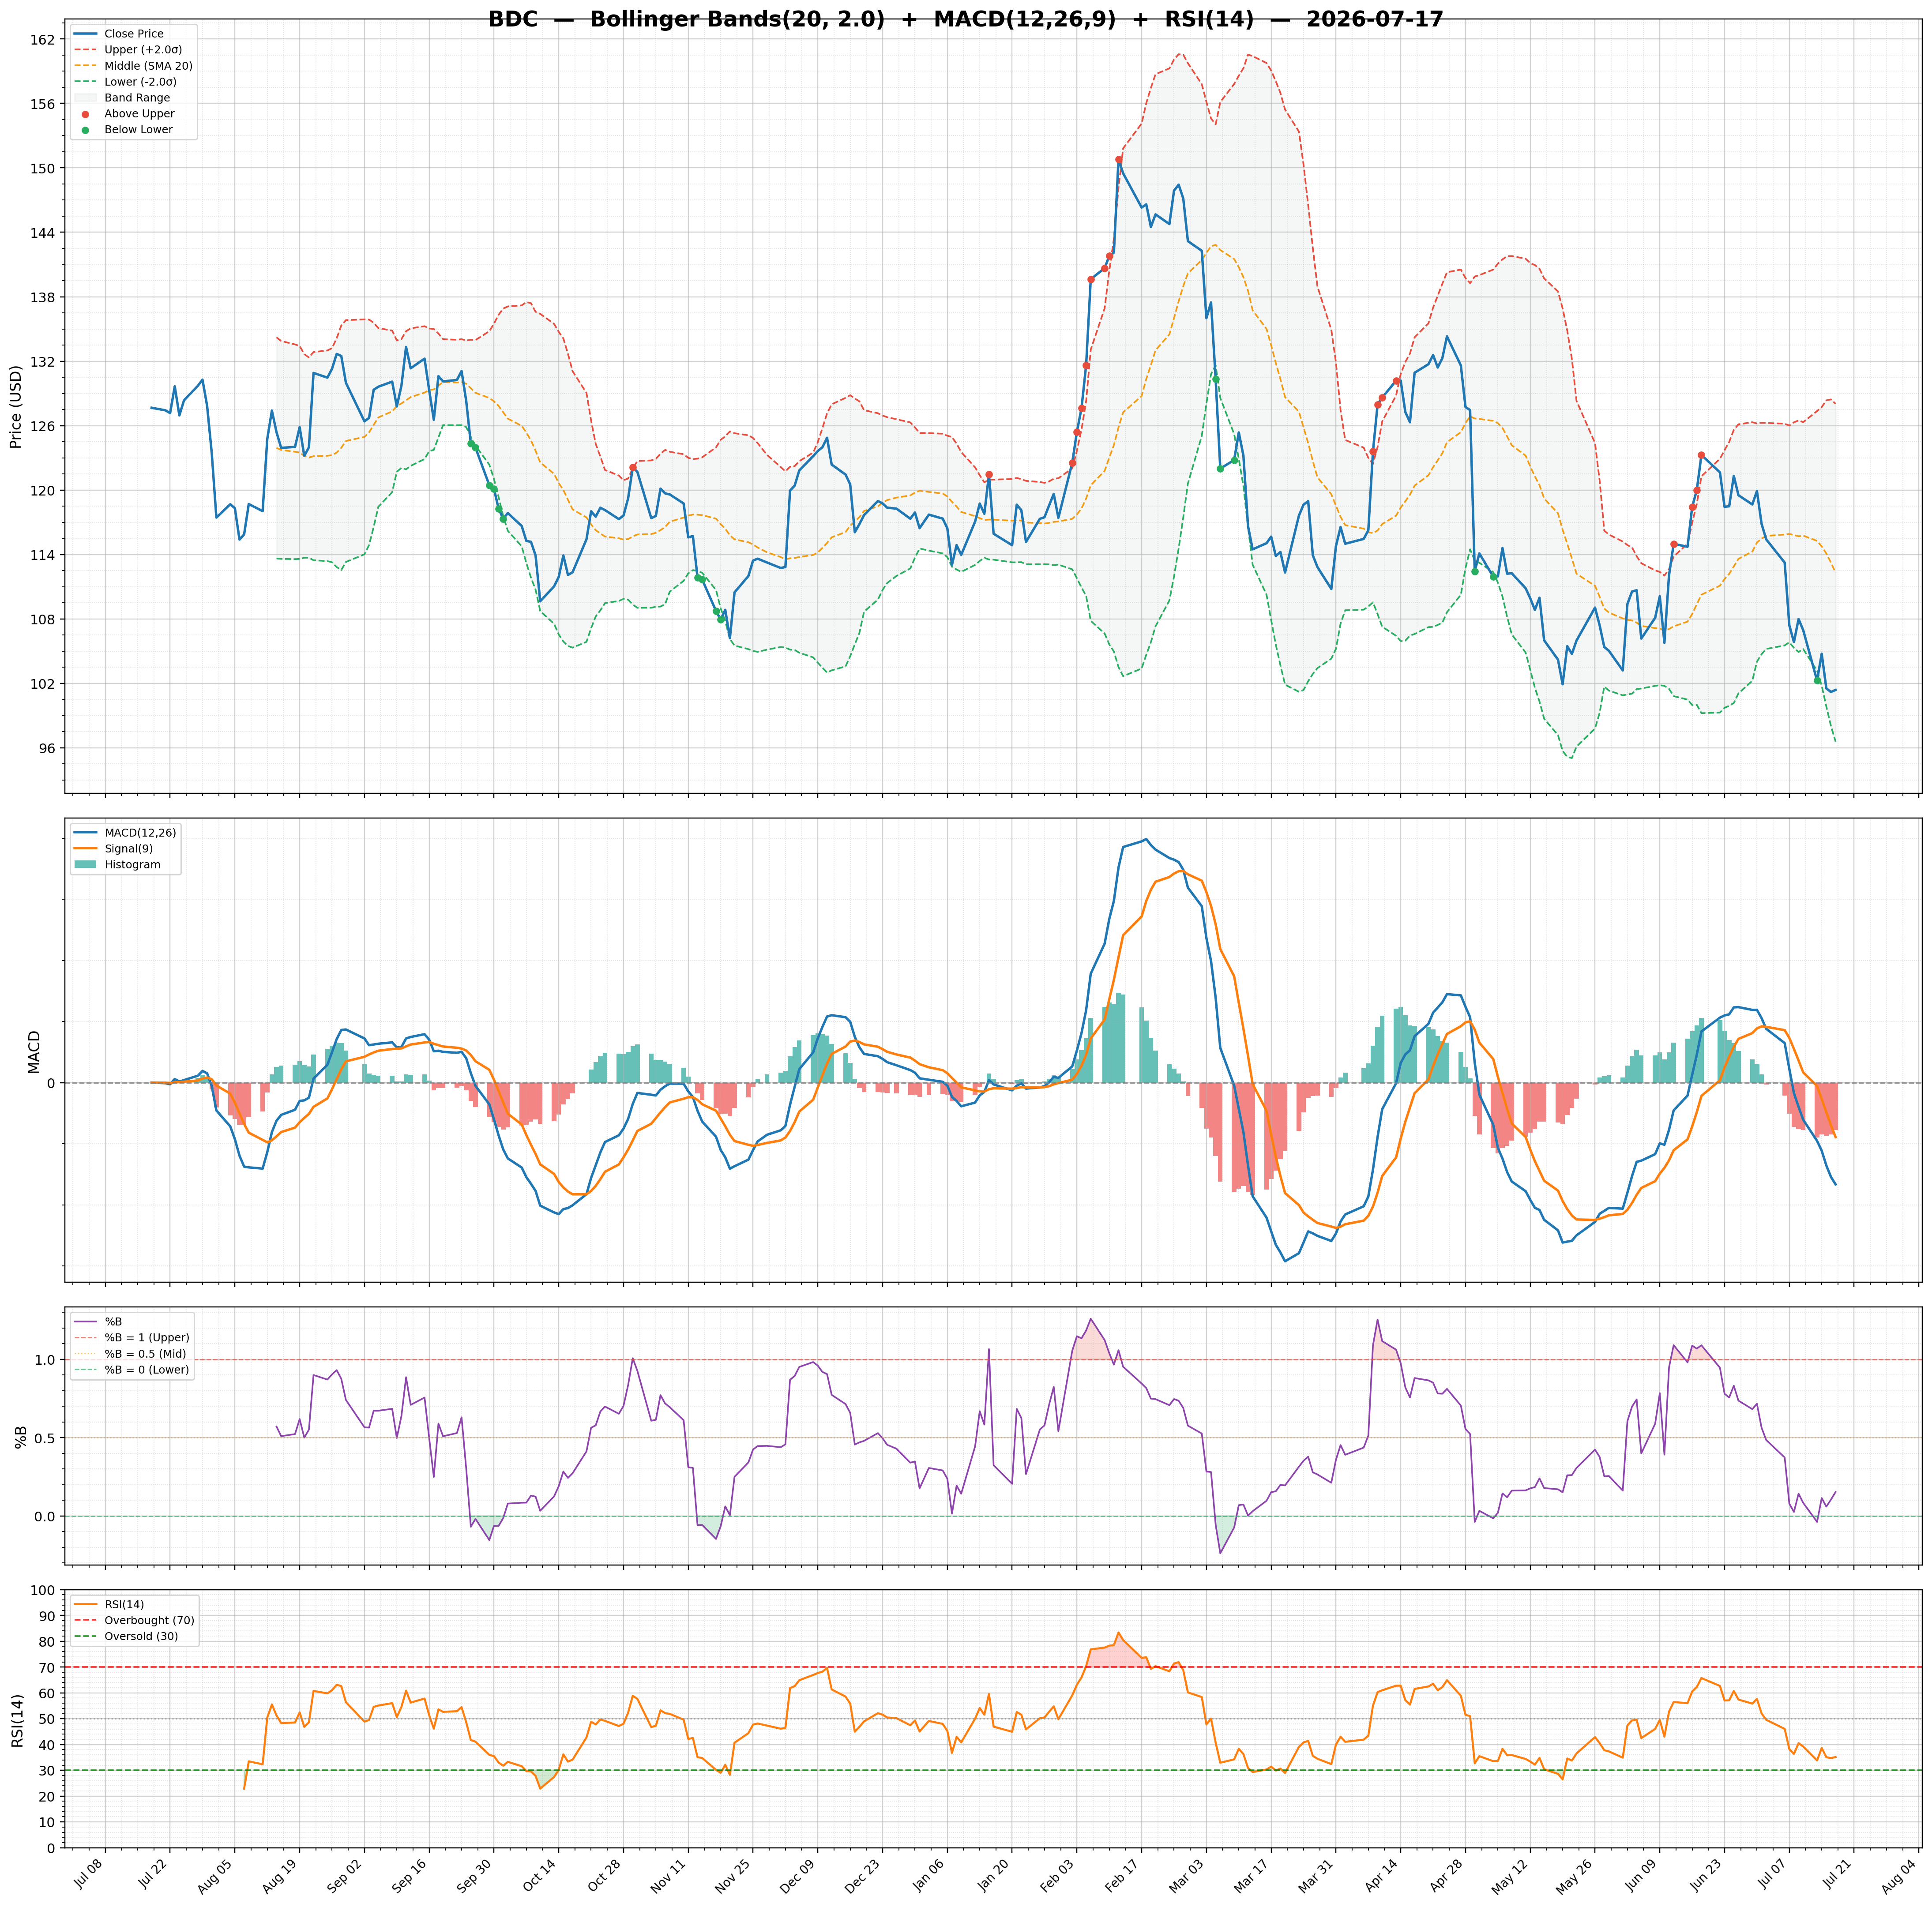
| 2026-07-17 | BDC | 101.39 | / | 0.38% | strong_buy | 492,991/612,296 | 28.01/0.15 | 35.14/-1.5500 | -0.17 | -3.33/-1.78 | Chart 3M 🌐 |
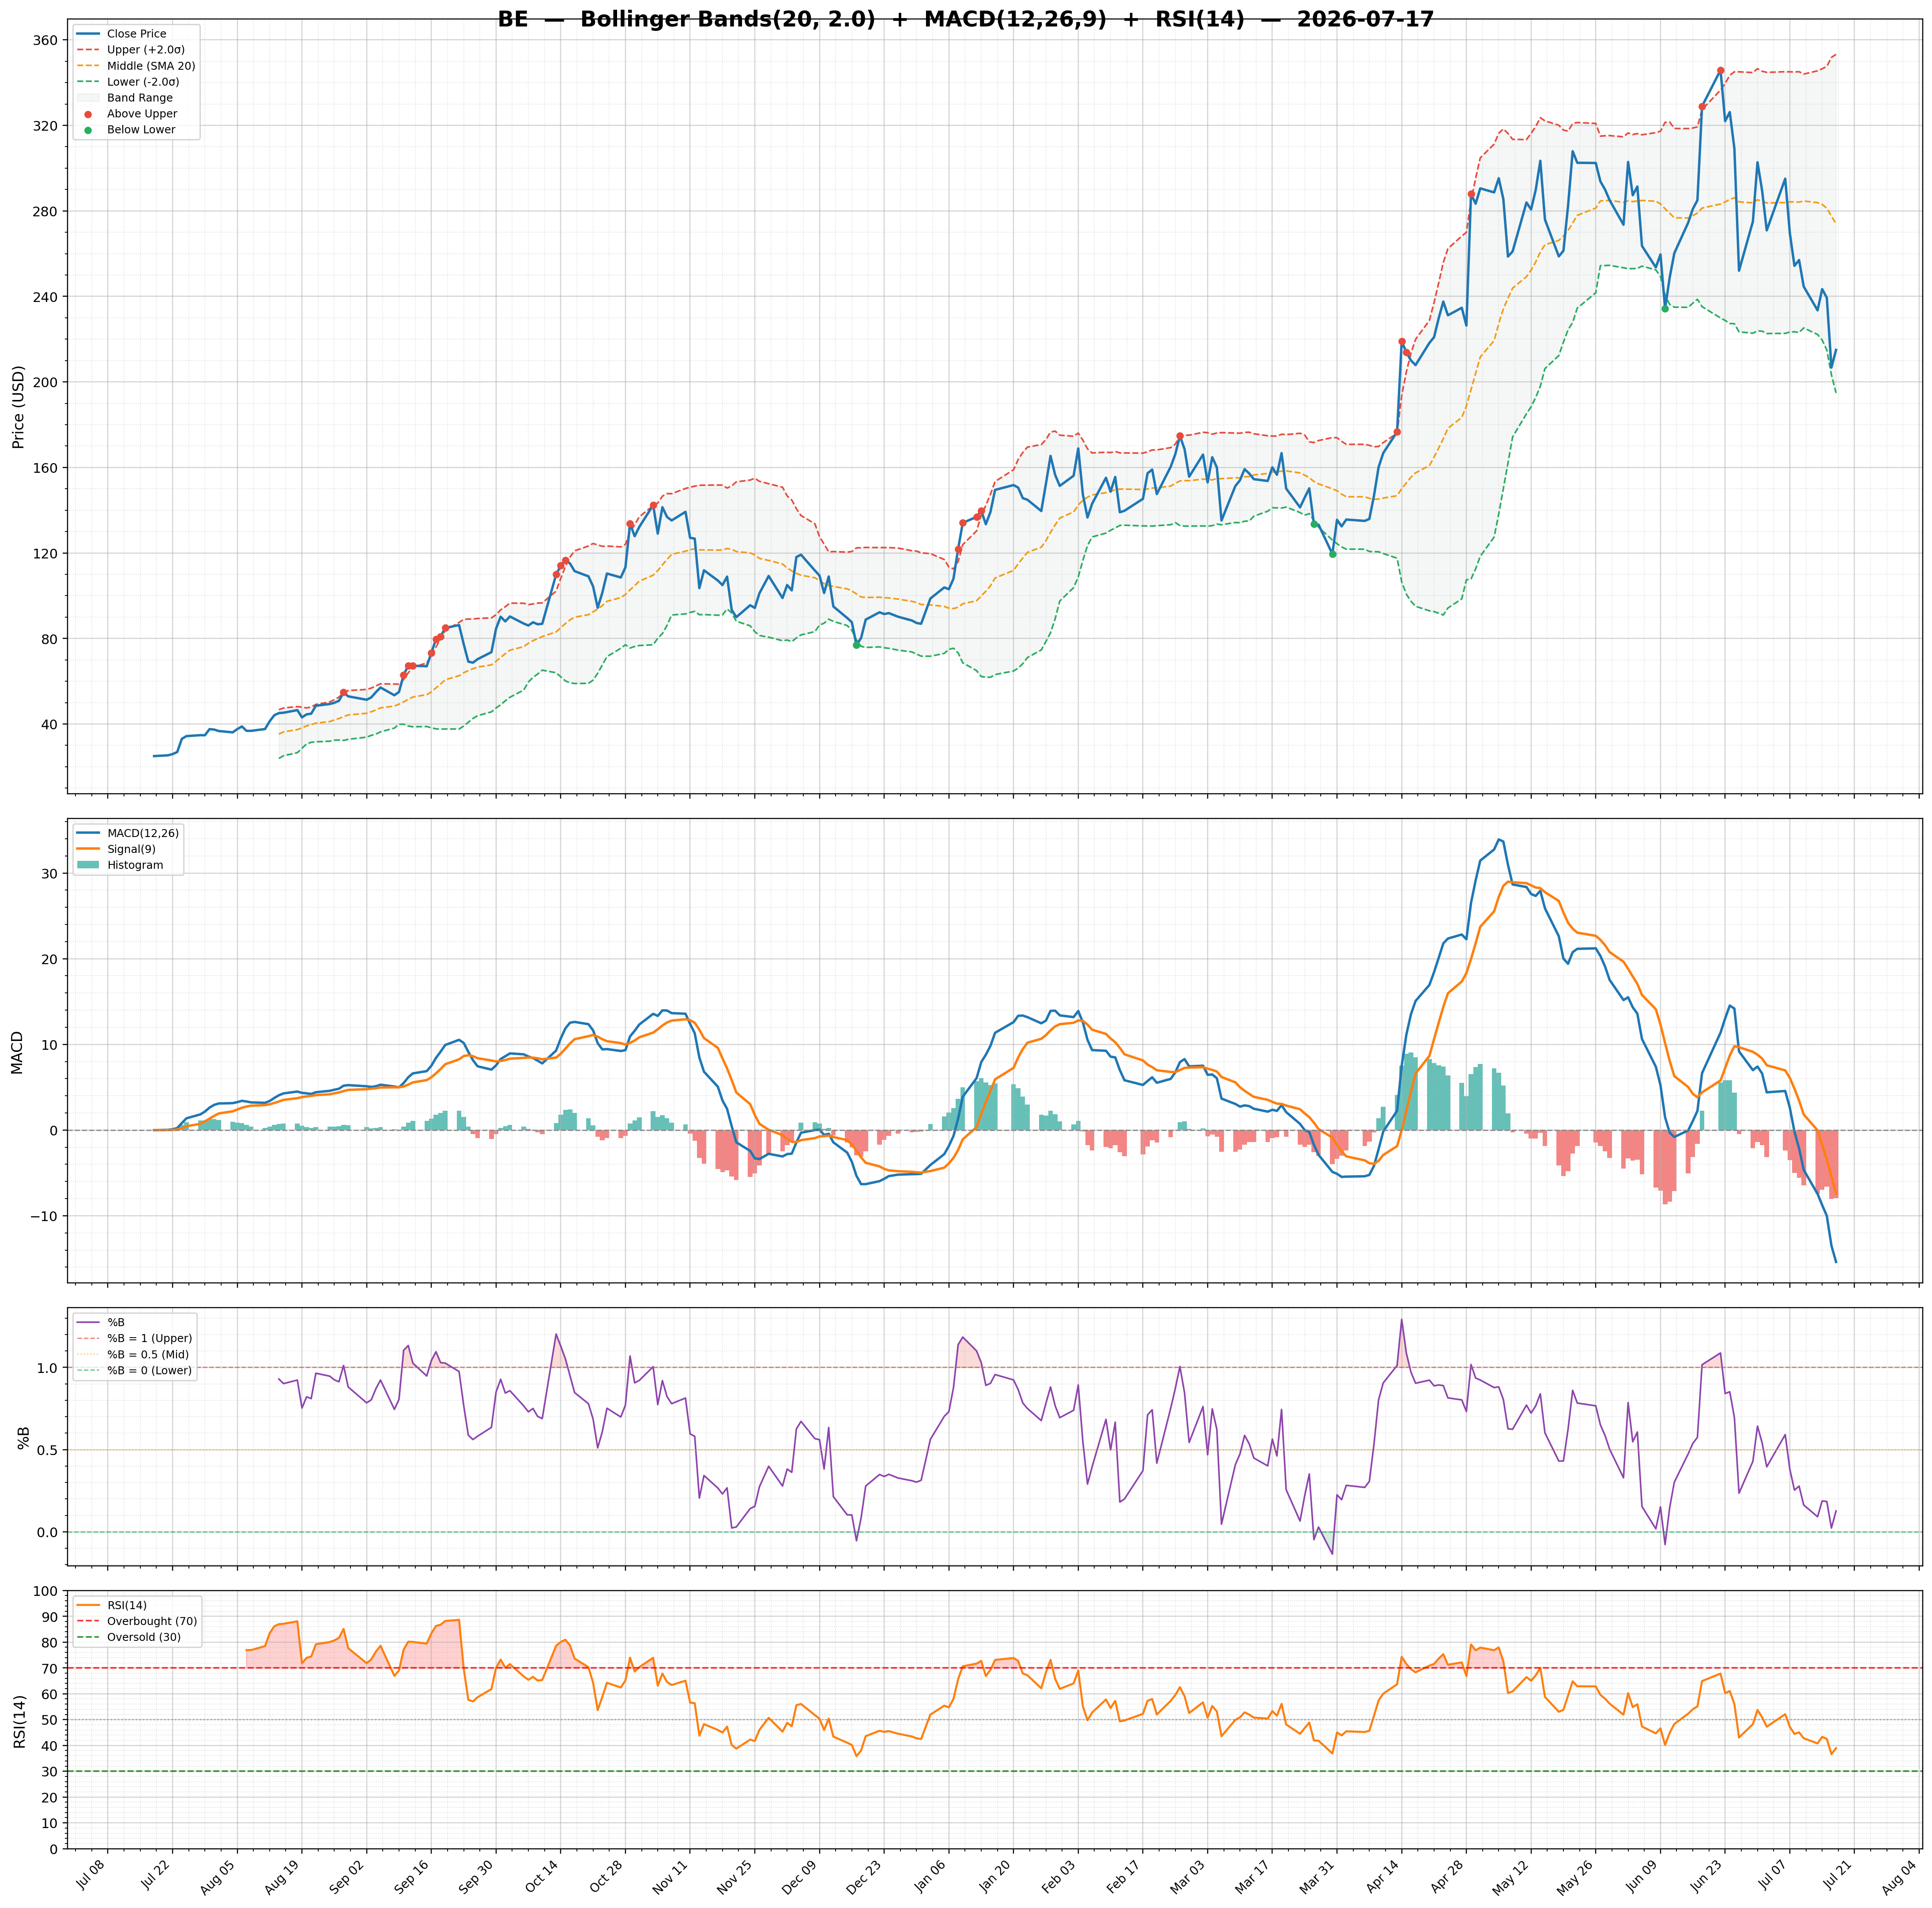
| 2026-07-17 | BE | 214.96 | / | 59.21% | buy | 14,533,705/15,628,395 | 57.80/0.13 | 38.92/-7.9600 | 1.80 | -15.39/-7.42 | Chart 3M 🌐 |
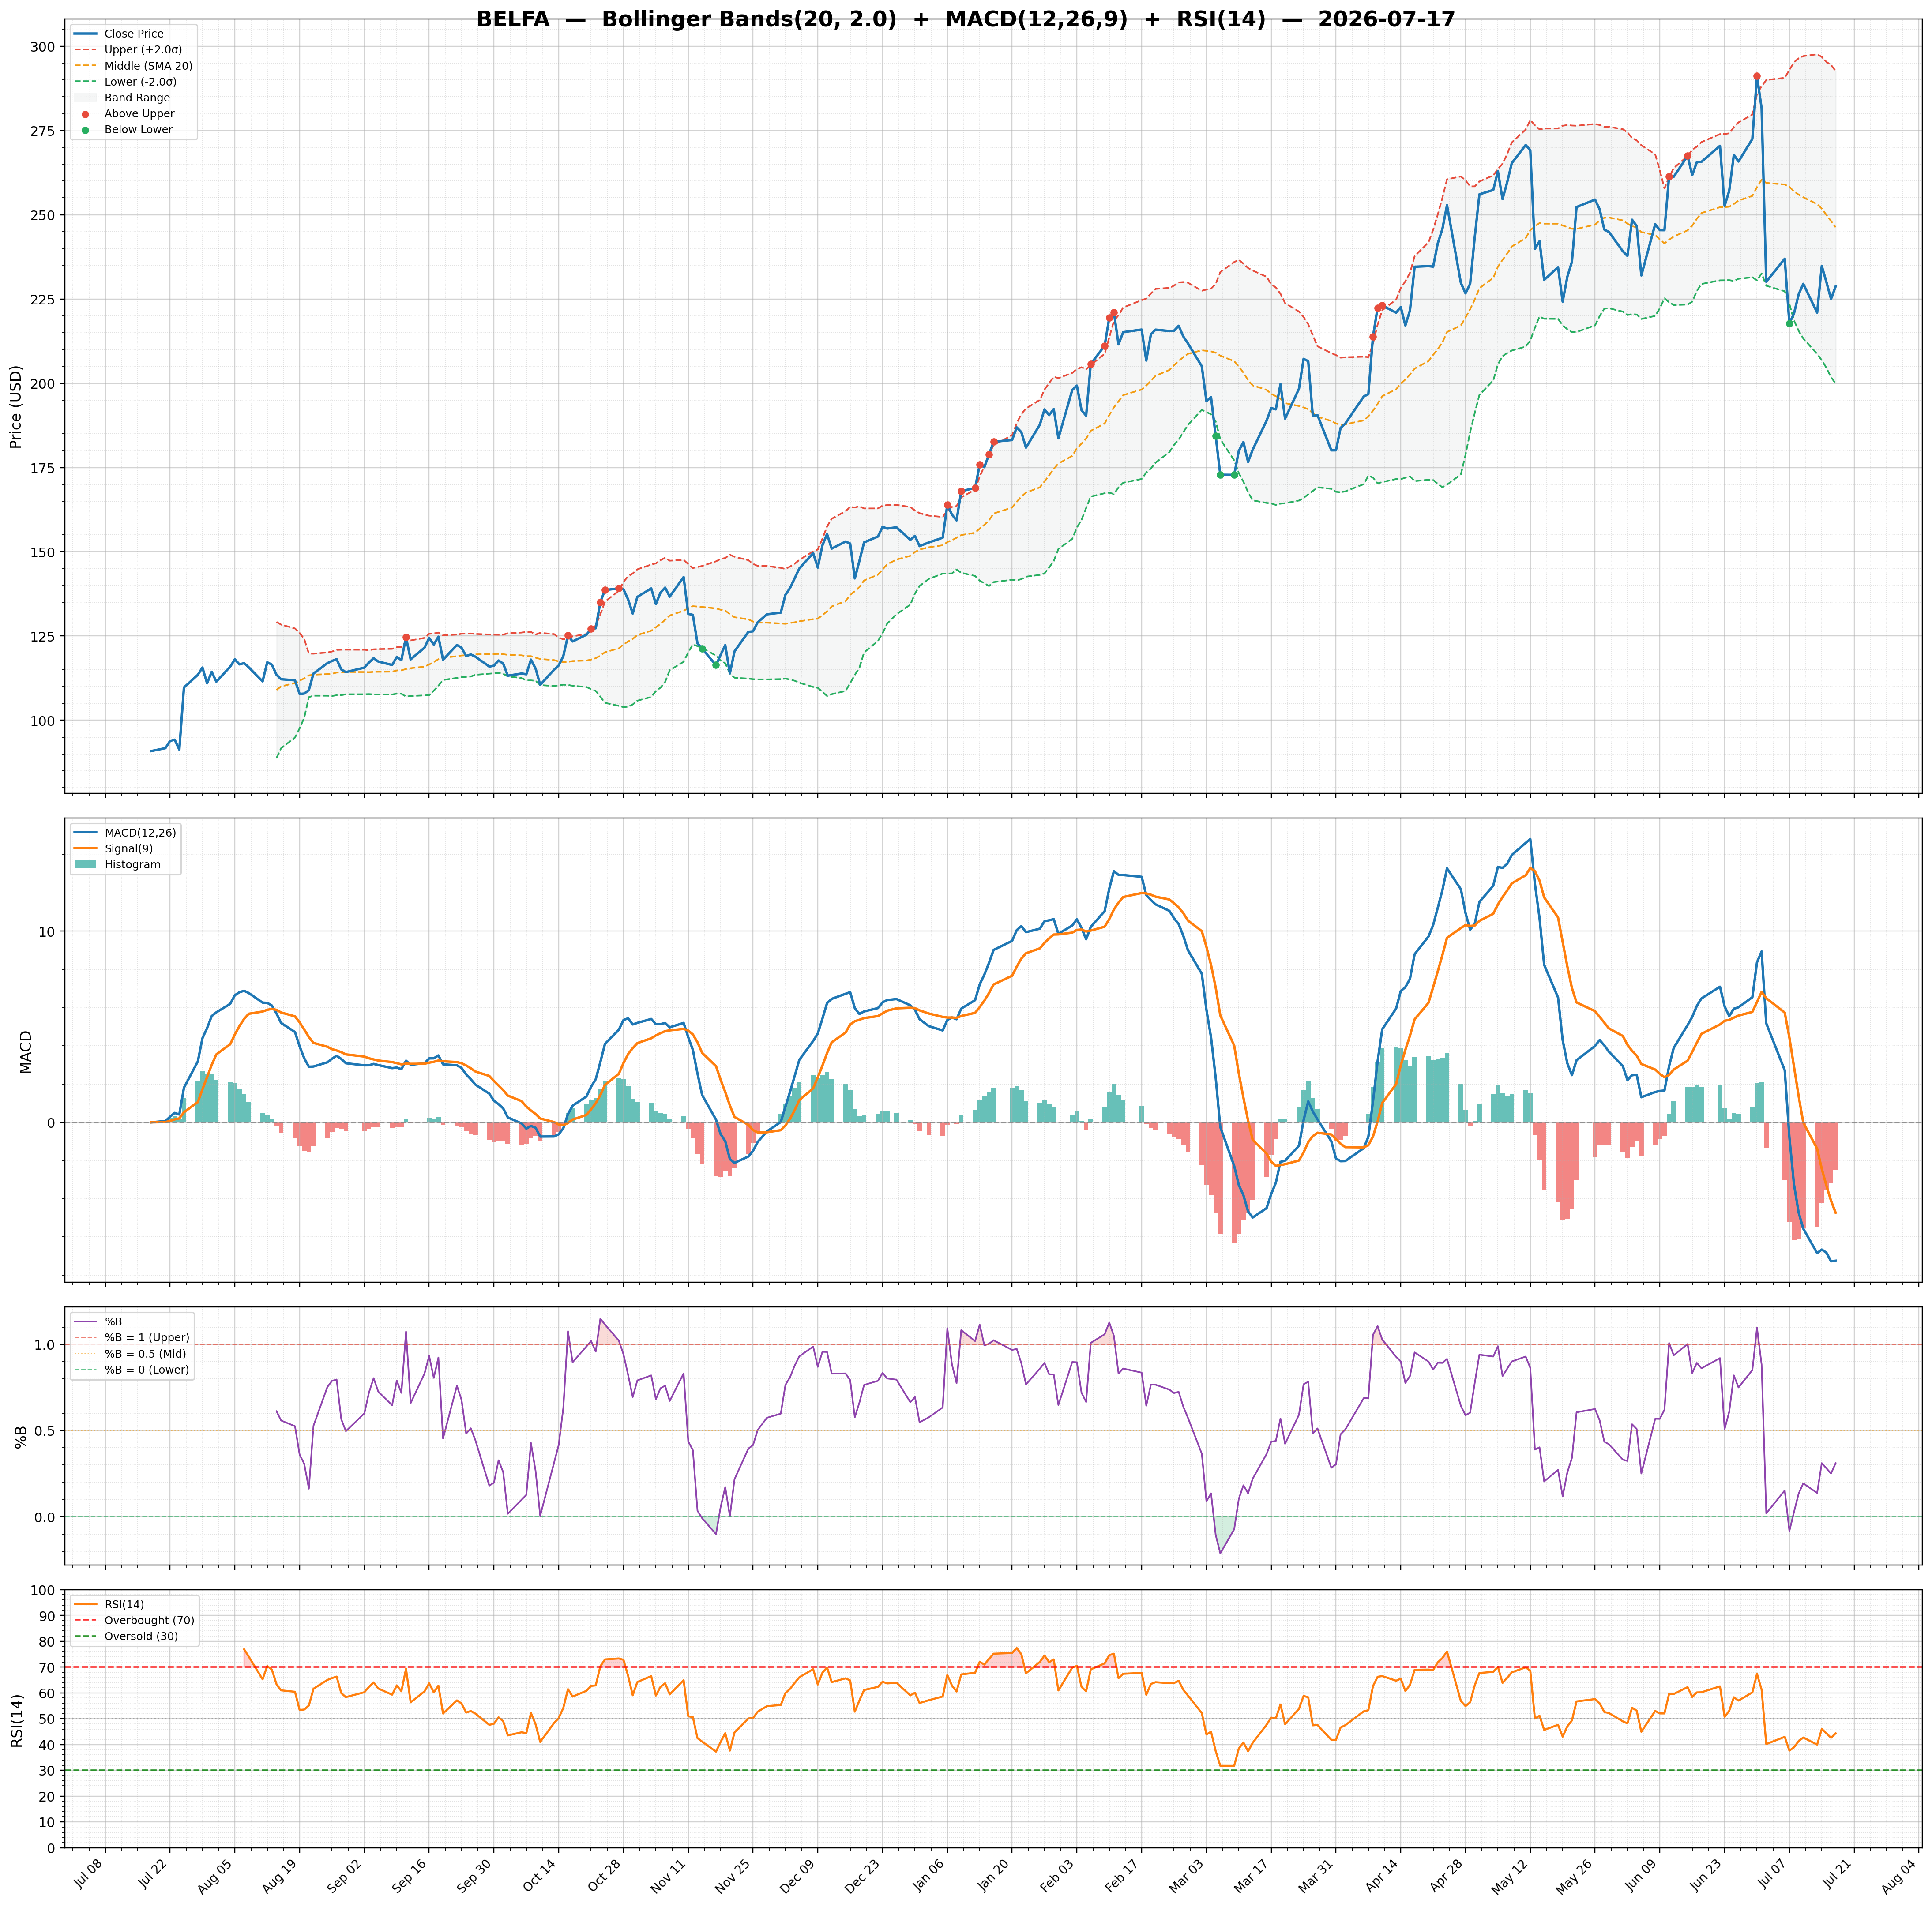
| 2026-07-17 | BELFA | 228.73 | / | 68.83% | none | 156,766/215,408 | 37.64/0.31 | 44.35/-2.5100 | 0.57 | -7.24/-4.73 | Chart 3M 🌐 |
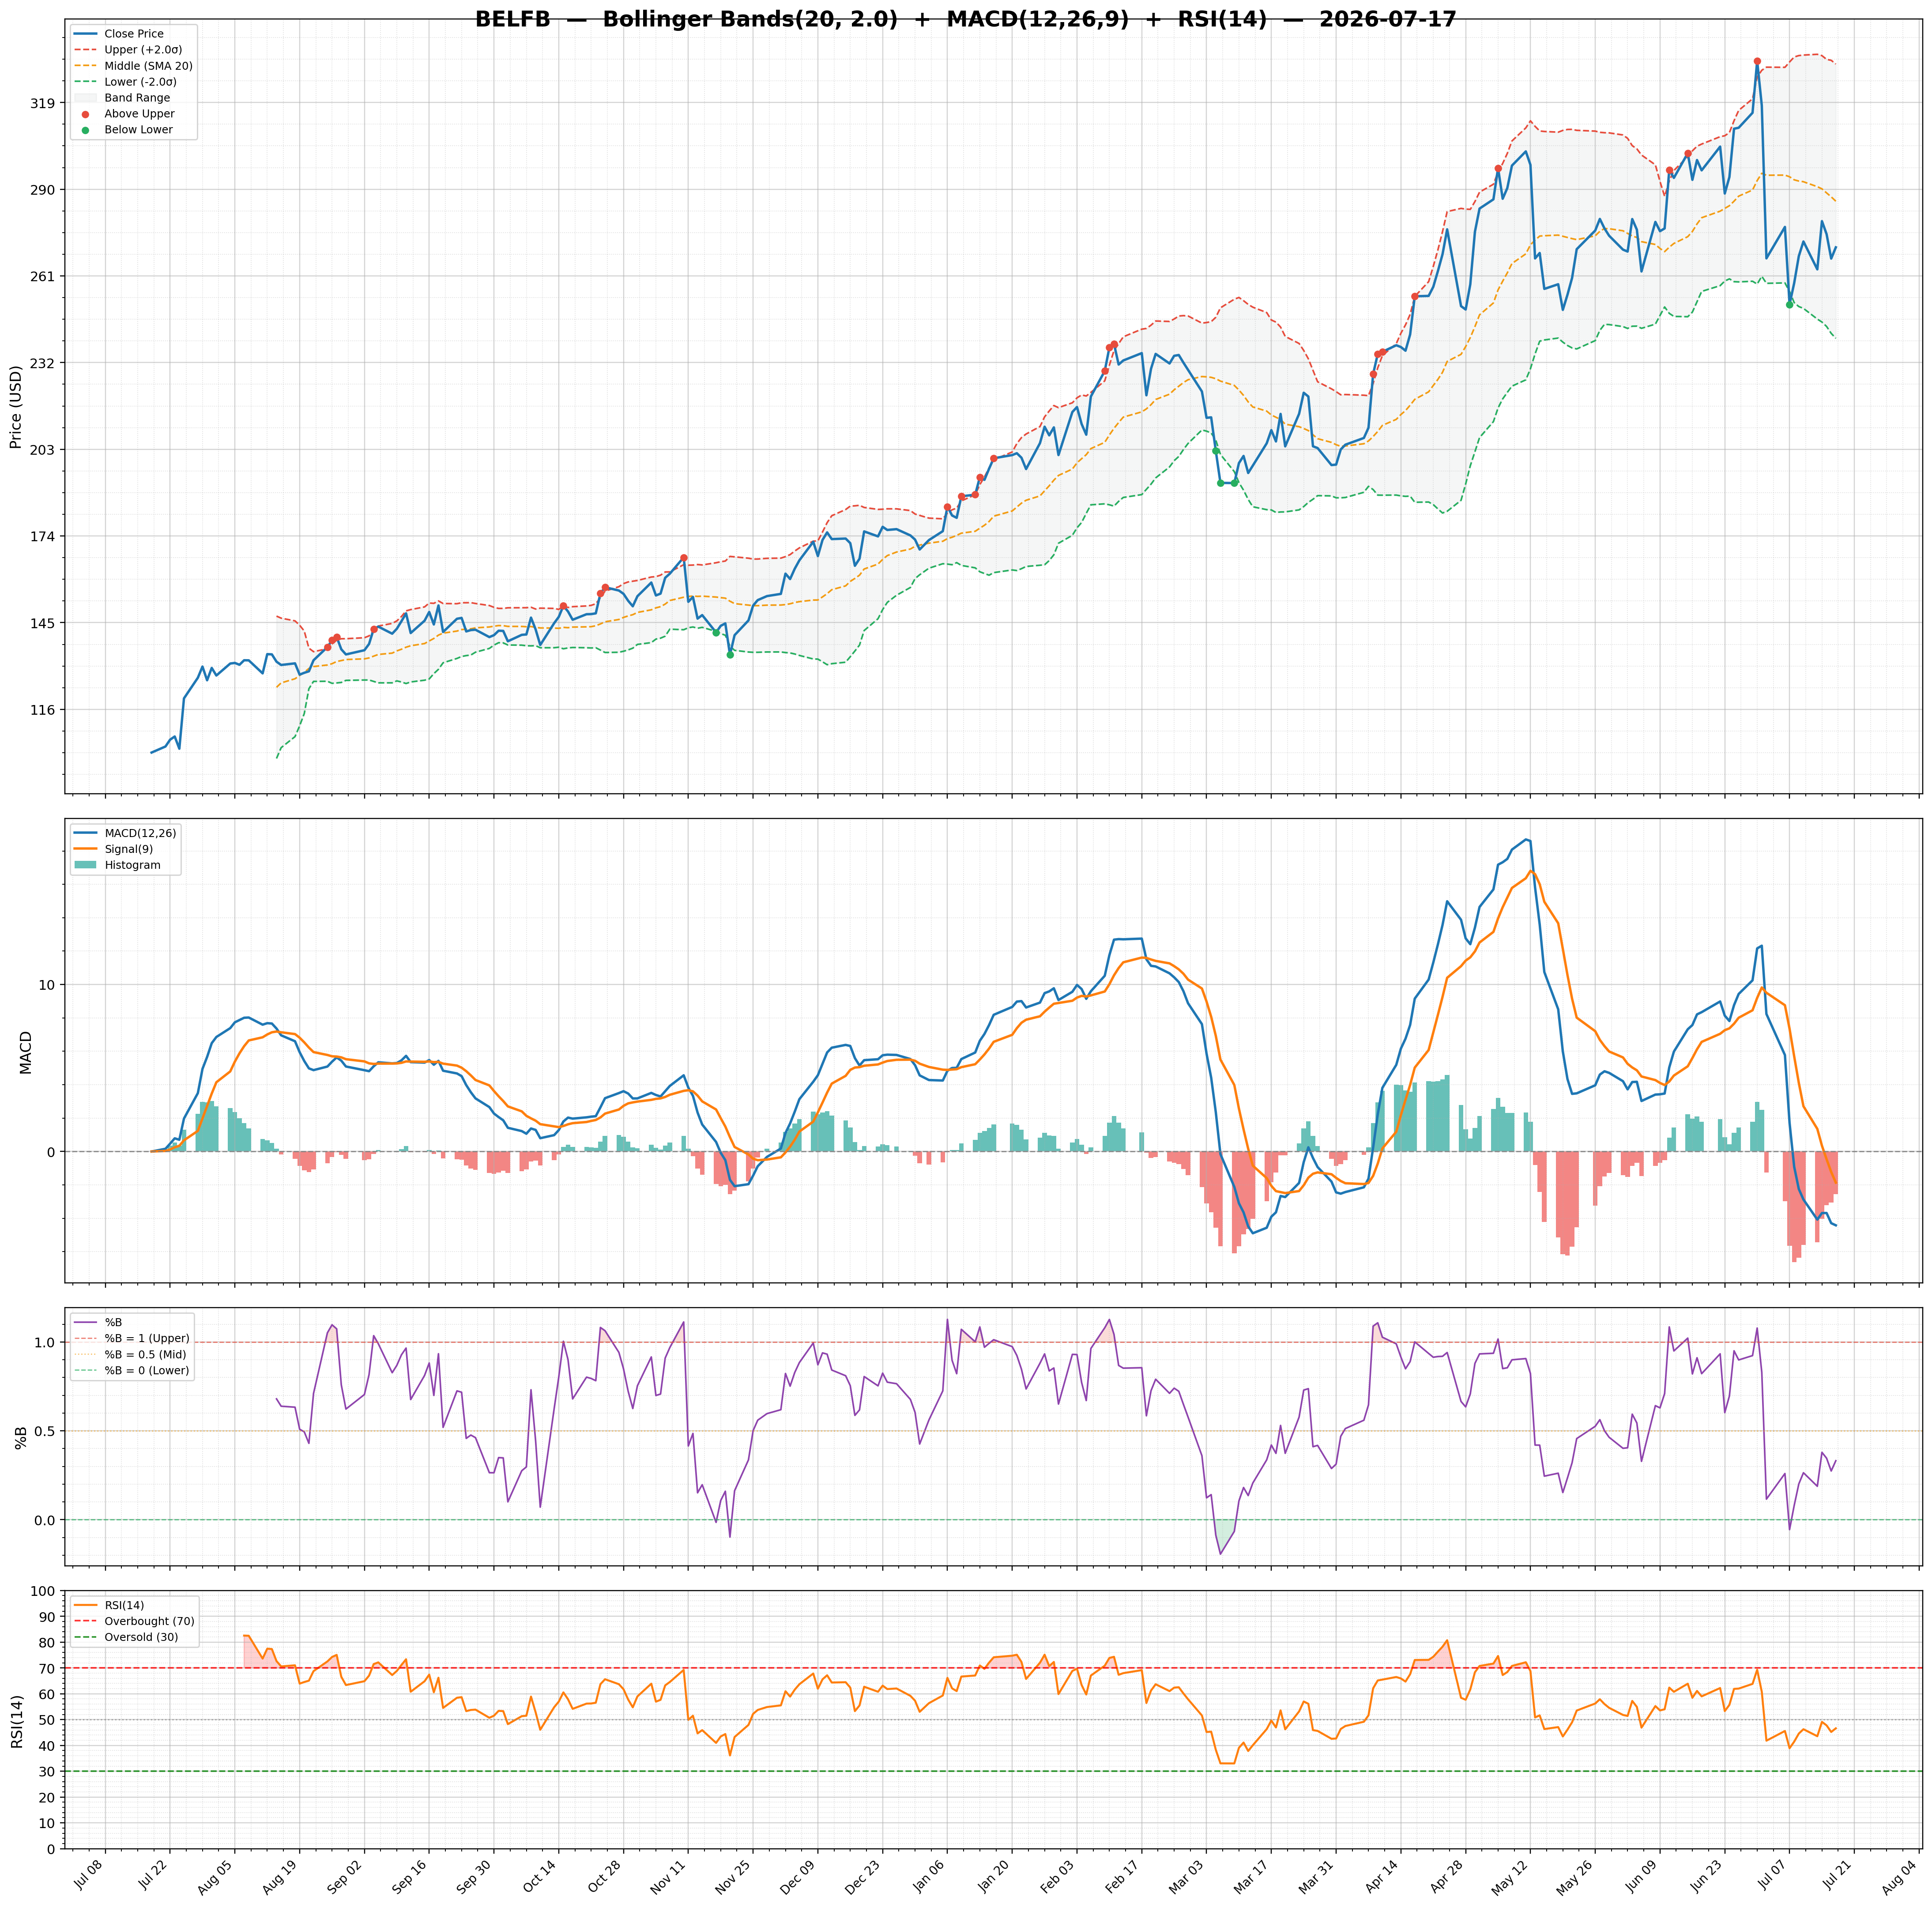
| 2026-07-17 | BELFB | 270.56 | / | 73.03% | strong_buy | 257,519/352,201 | 32.09/0.33 | 46.62/-2.5600 | 0.62 | -4.42/-1.87 | Chart 3M 🌐 |
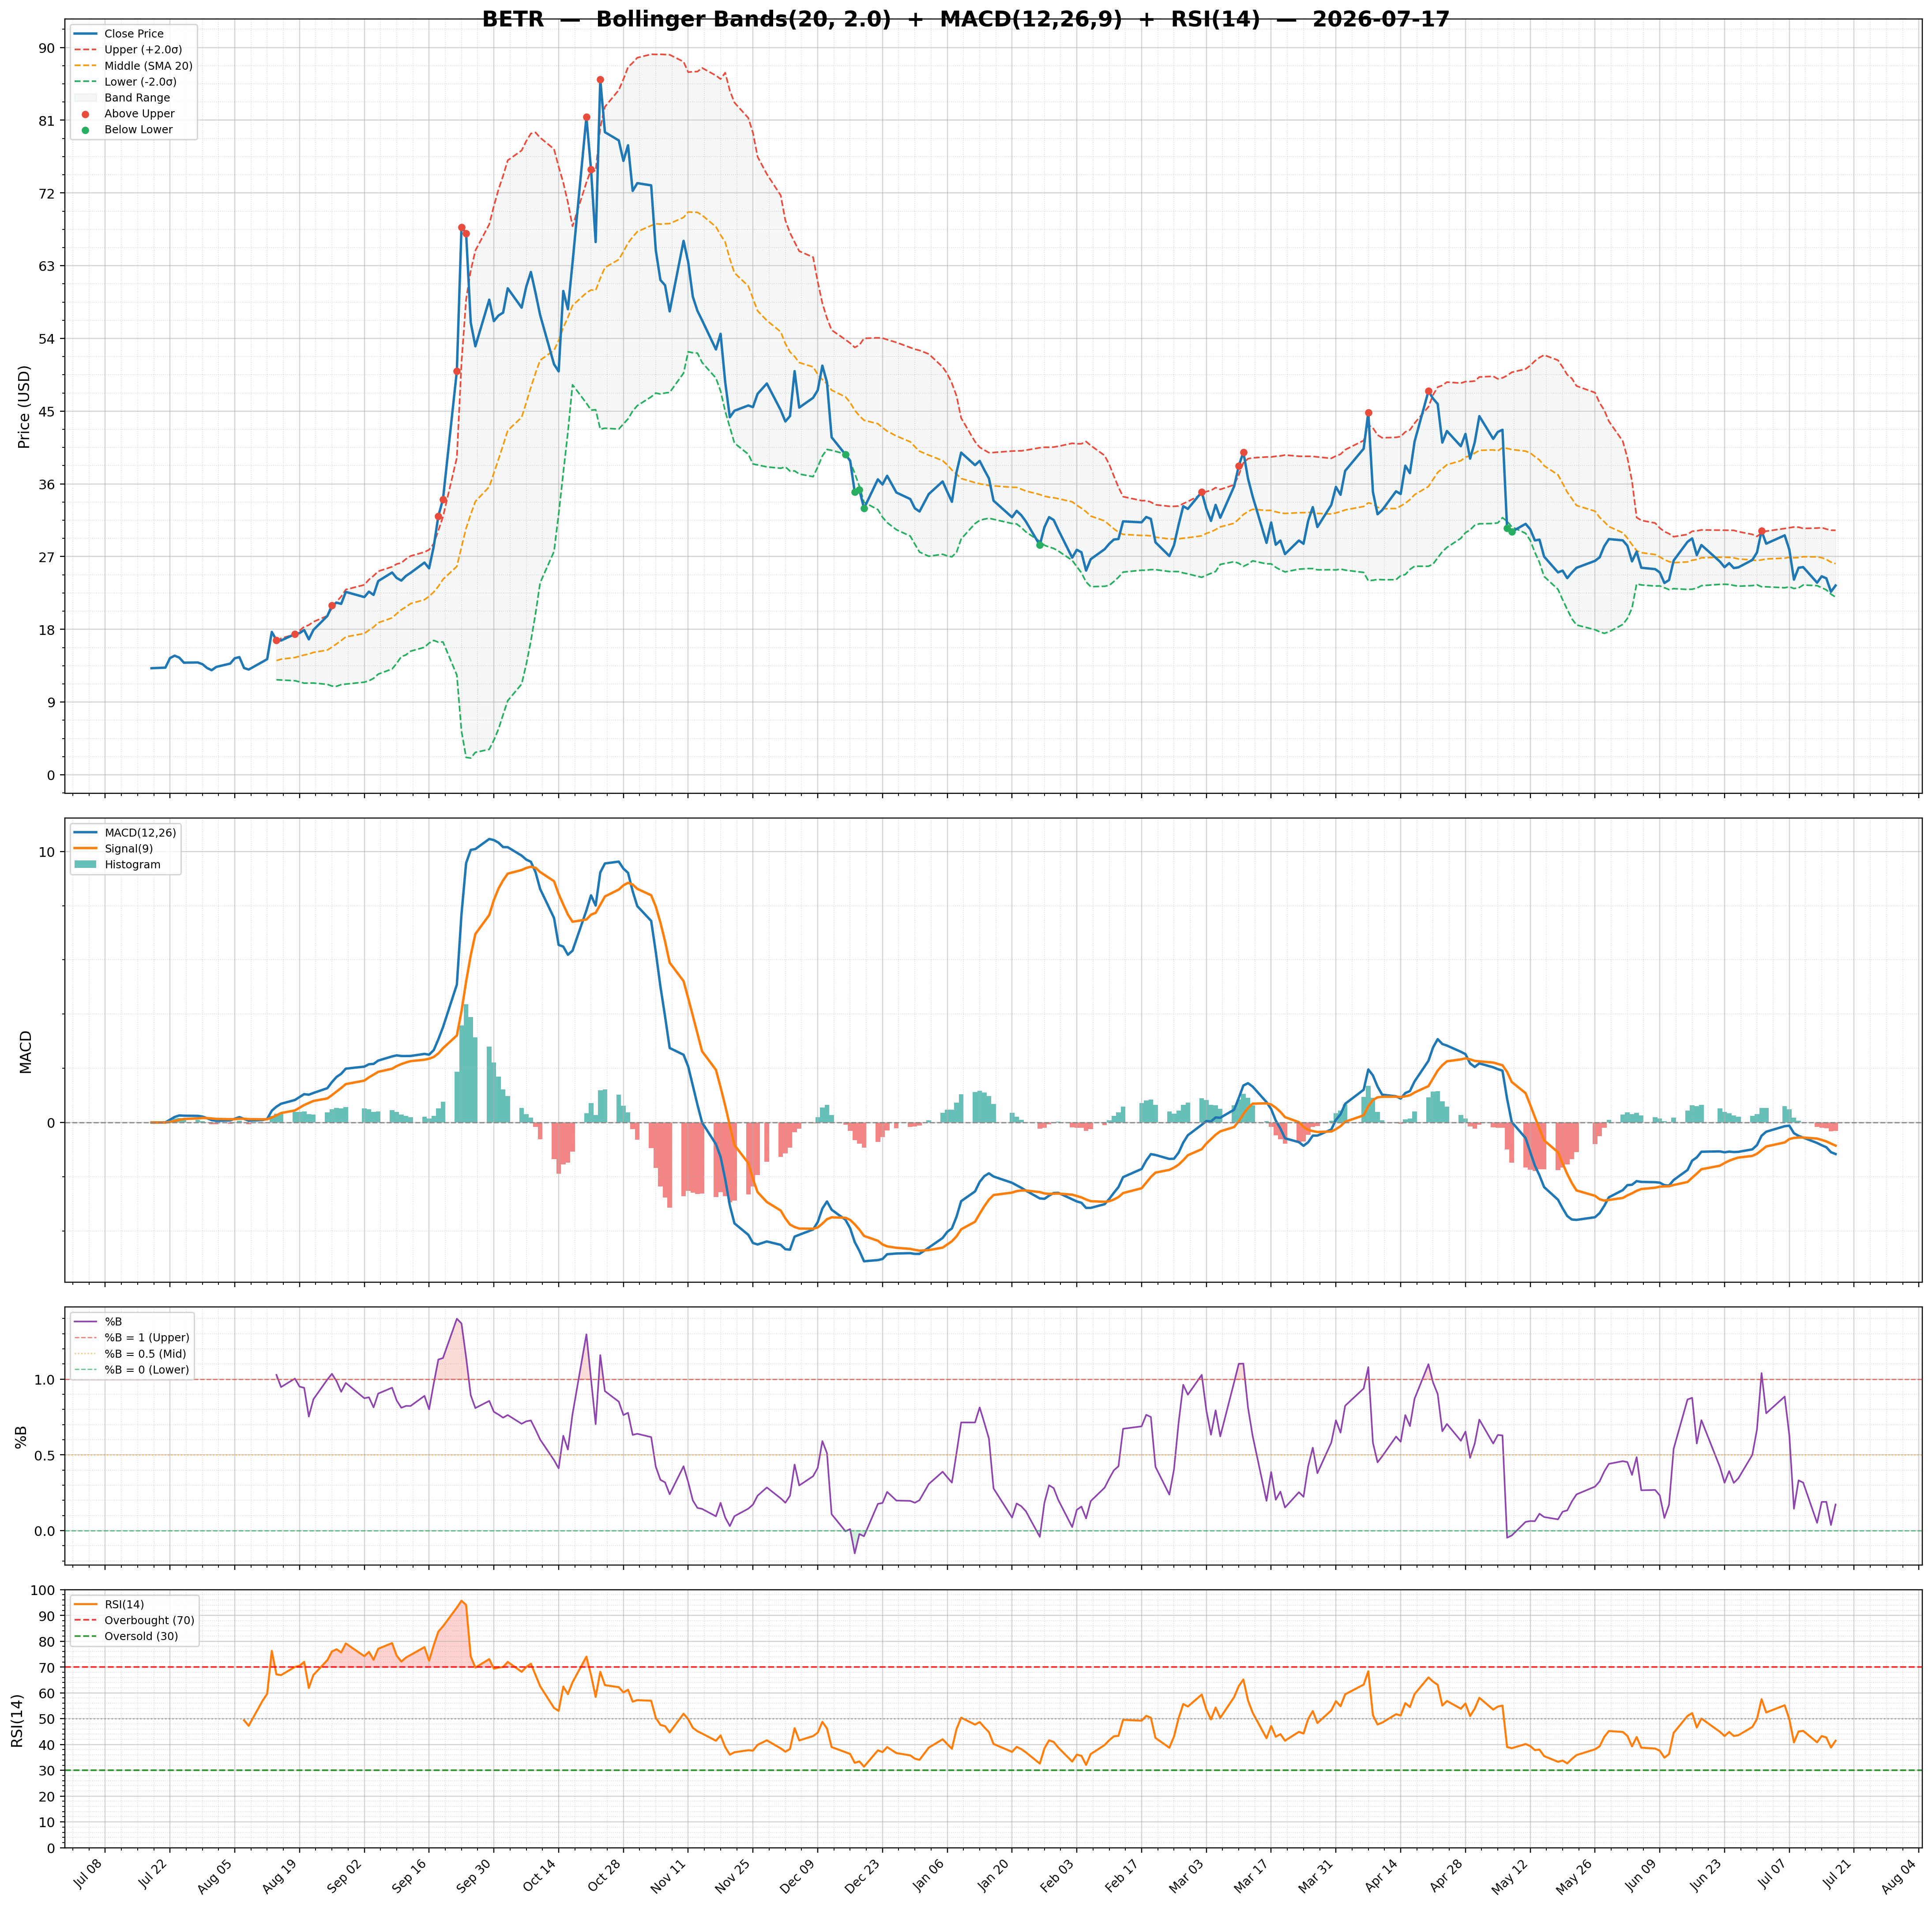
| 2026-07-17 | BETR | 23.42 | / | 14.33% | strong_buy | 202,526/321,476 | 31.65/0.17 | 41.47/-0.3100 | -0.18 | -1.16/-0.85 | Chart 3M 🌐 |
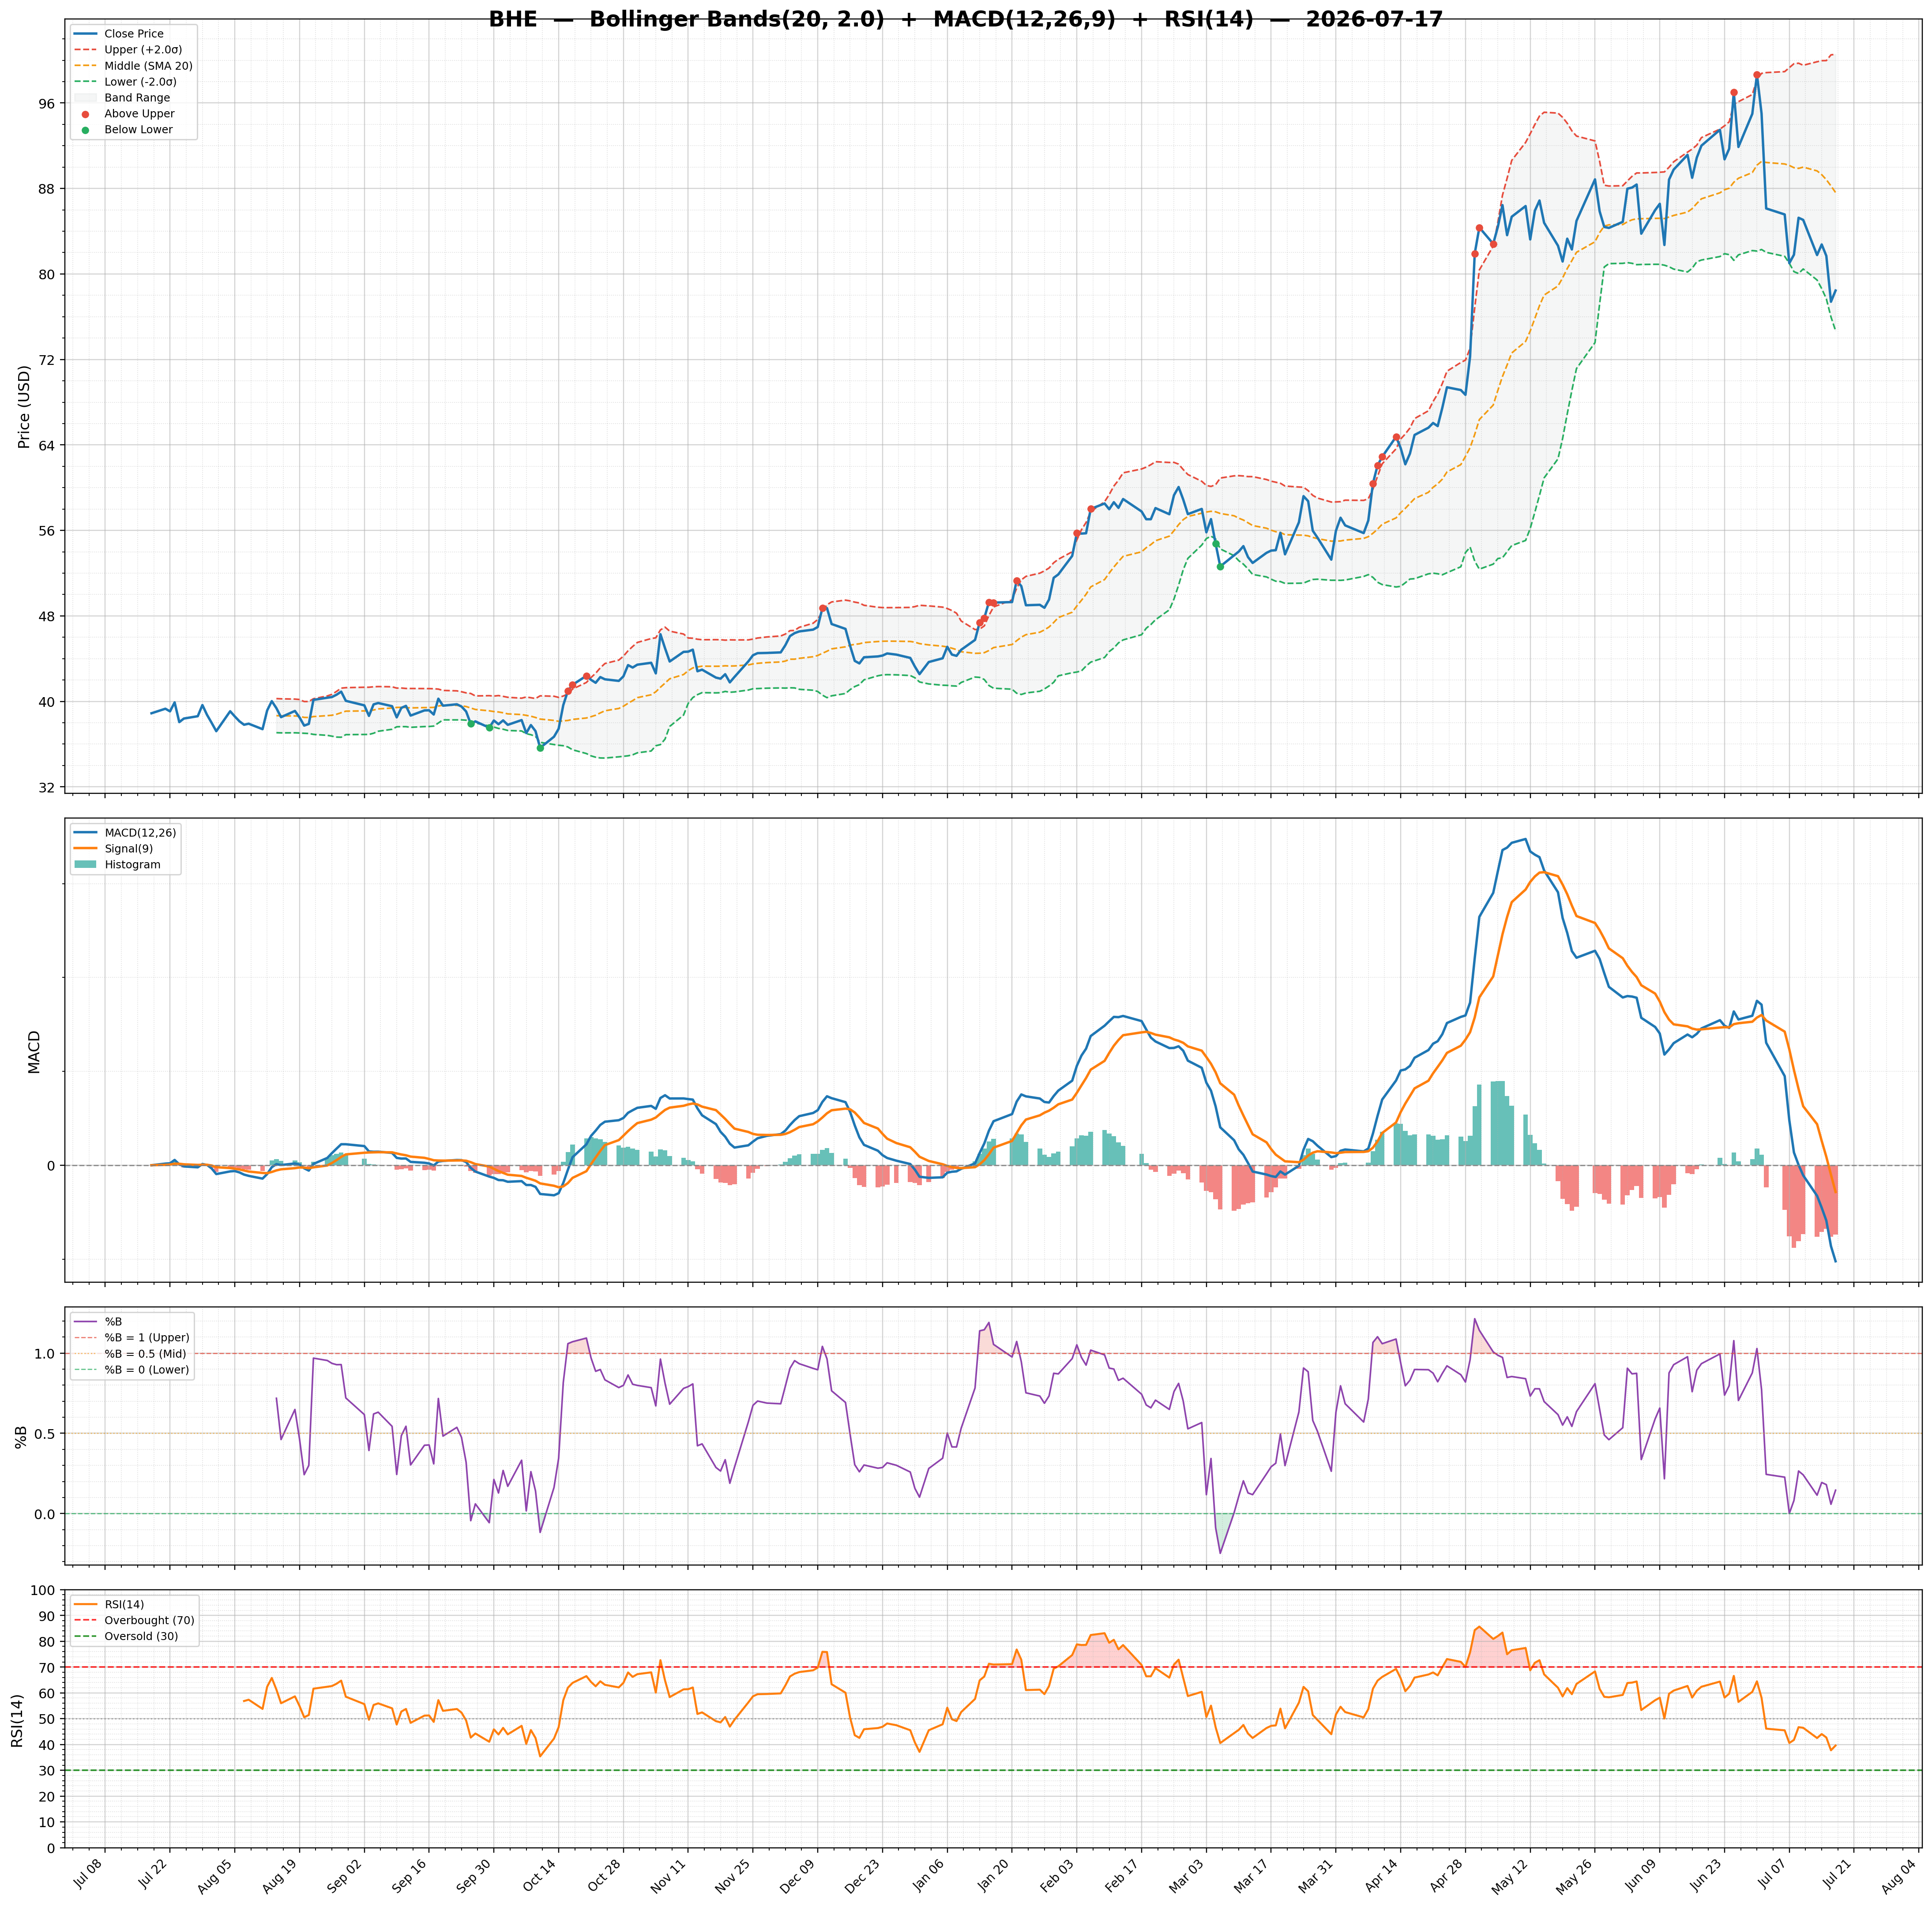
| 2026-07-17 | BHE | 78.45 | / | 67.91% | none | 414,543/625,075 | 29.54/0.15 | 39.61/-1.4800 | 0.64 | -2.05/-0.57 | Chart 3M 🌐 |
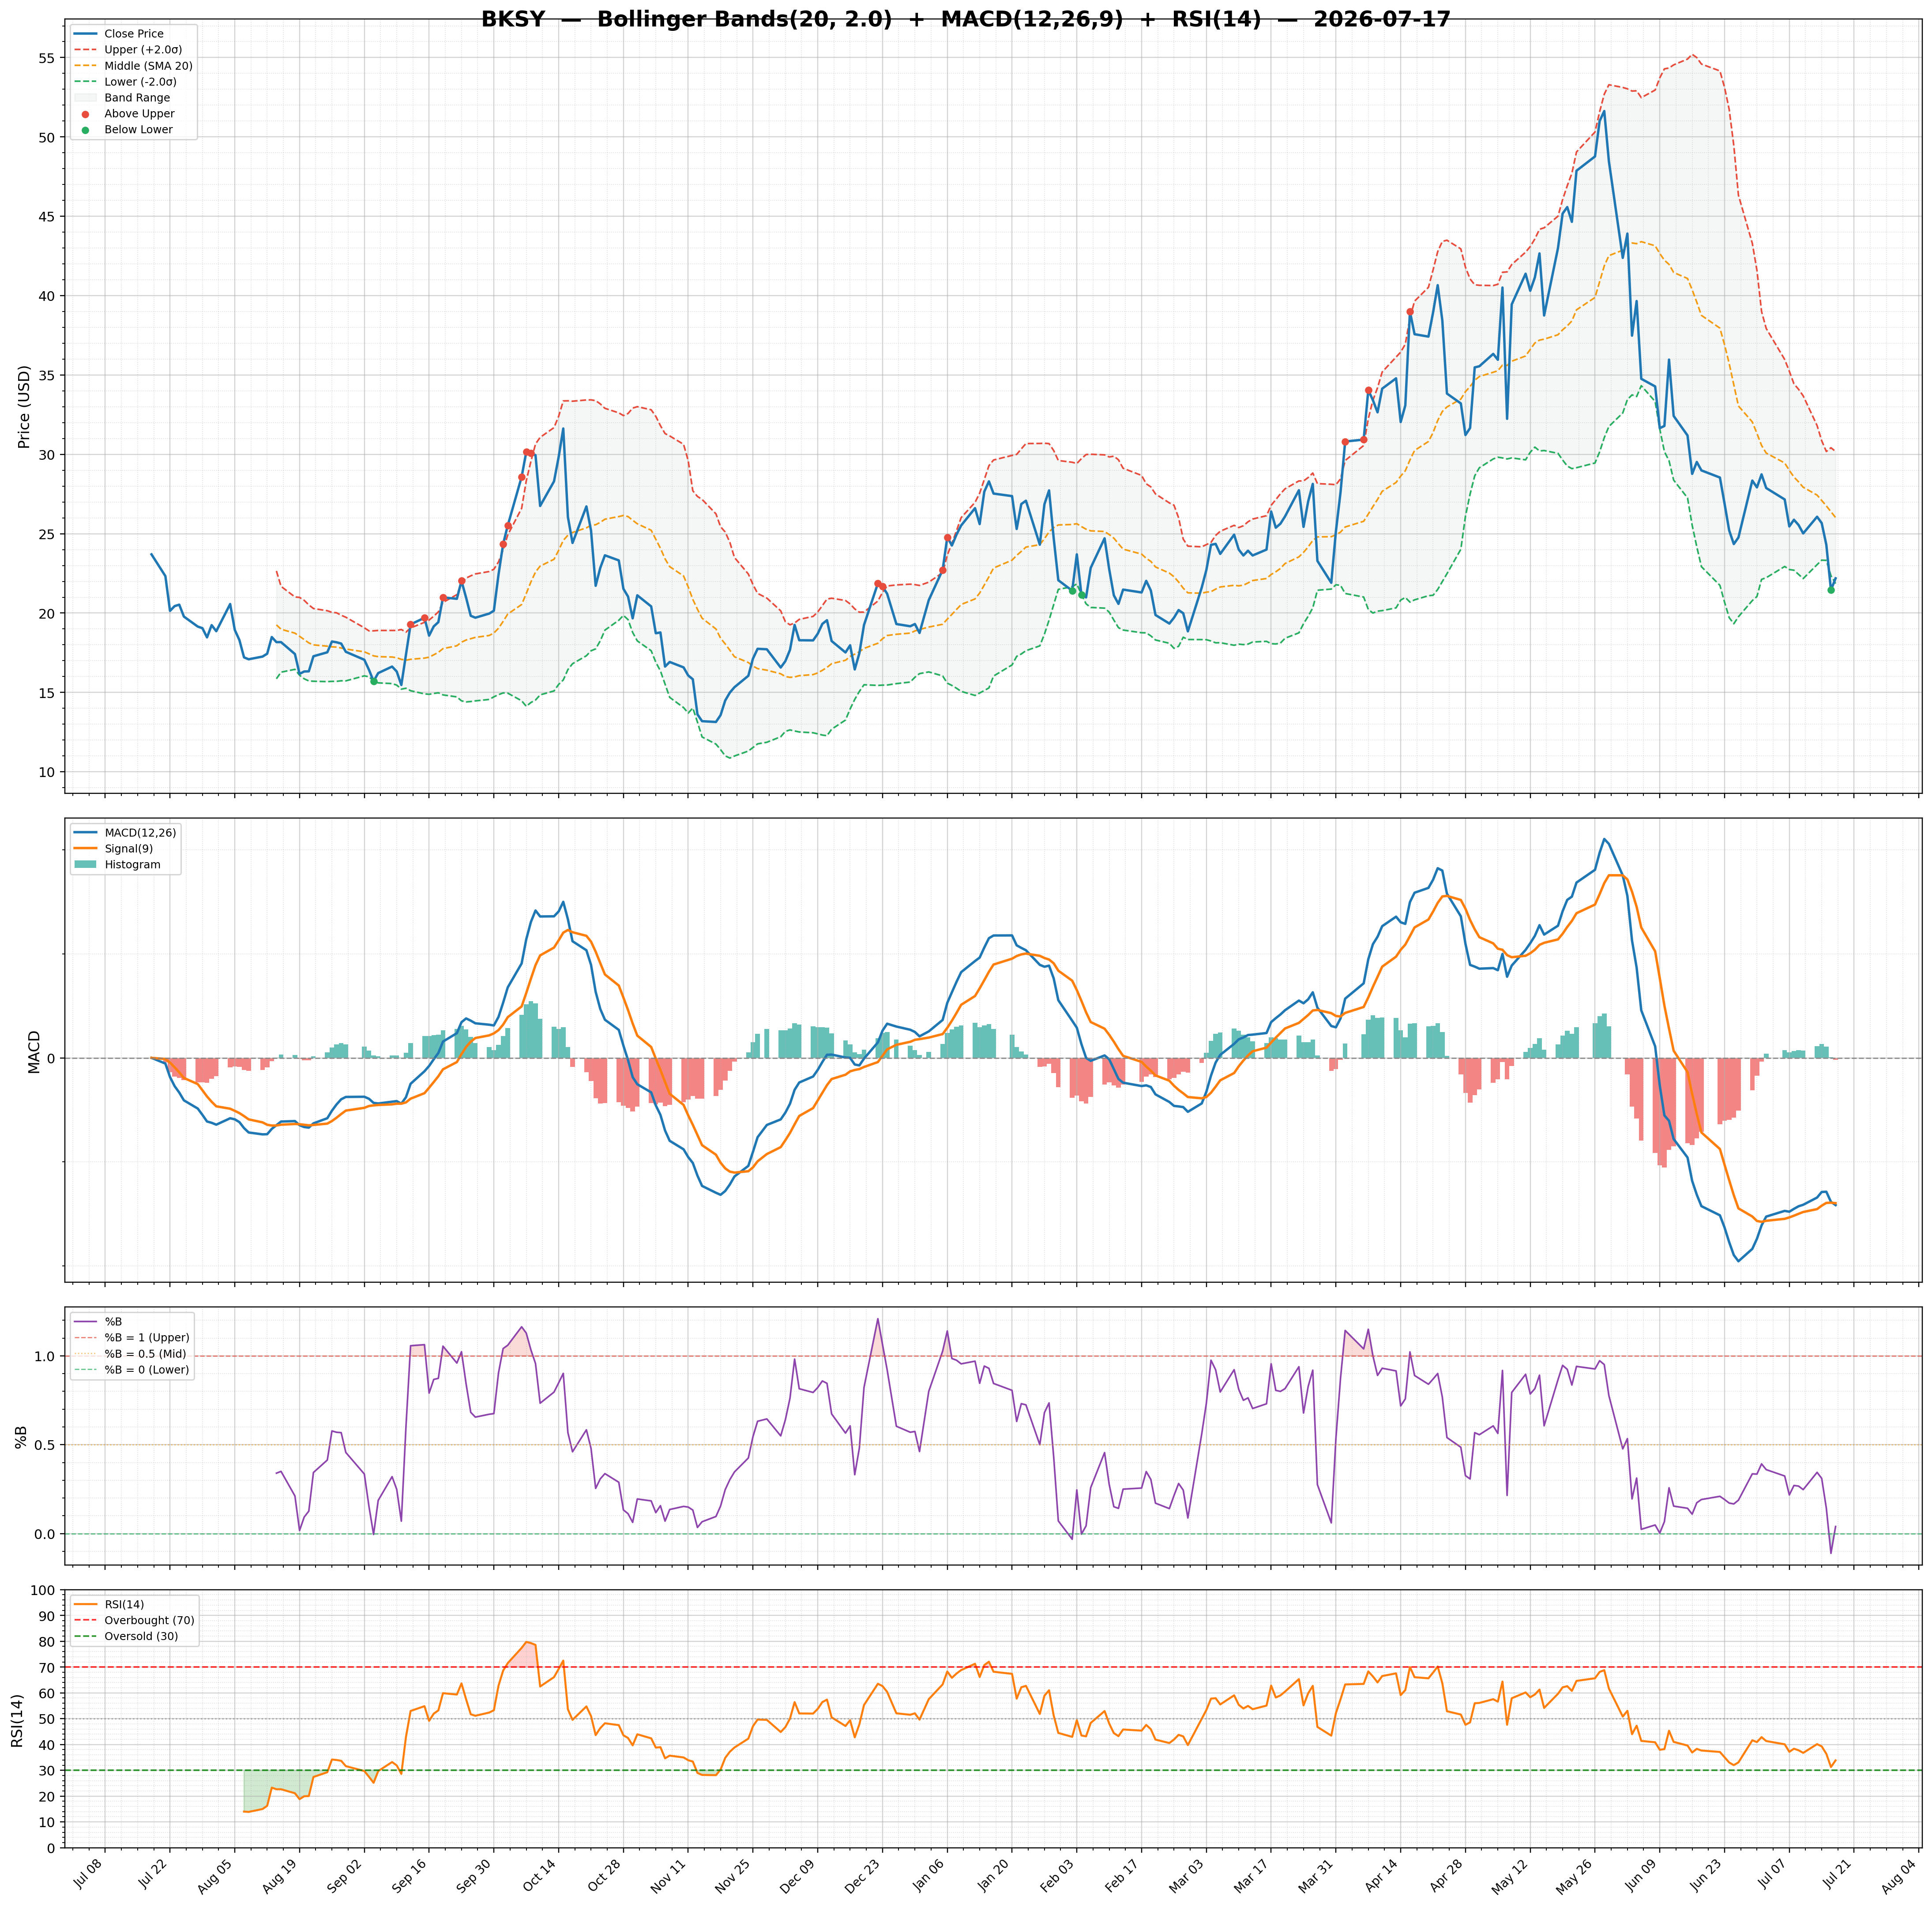
| 2026-07-17 | BKSY | 22.19 | / | 23.51% | none | 1,088,291/1,619,390 | 31.99/0.04 | 33.85/-0.0400 | -0.26 | -2.83/-2.79 | Chart 3M 🌐 |
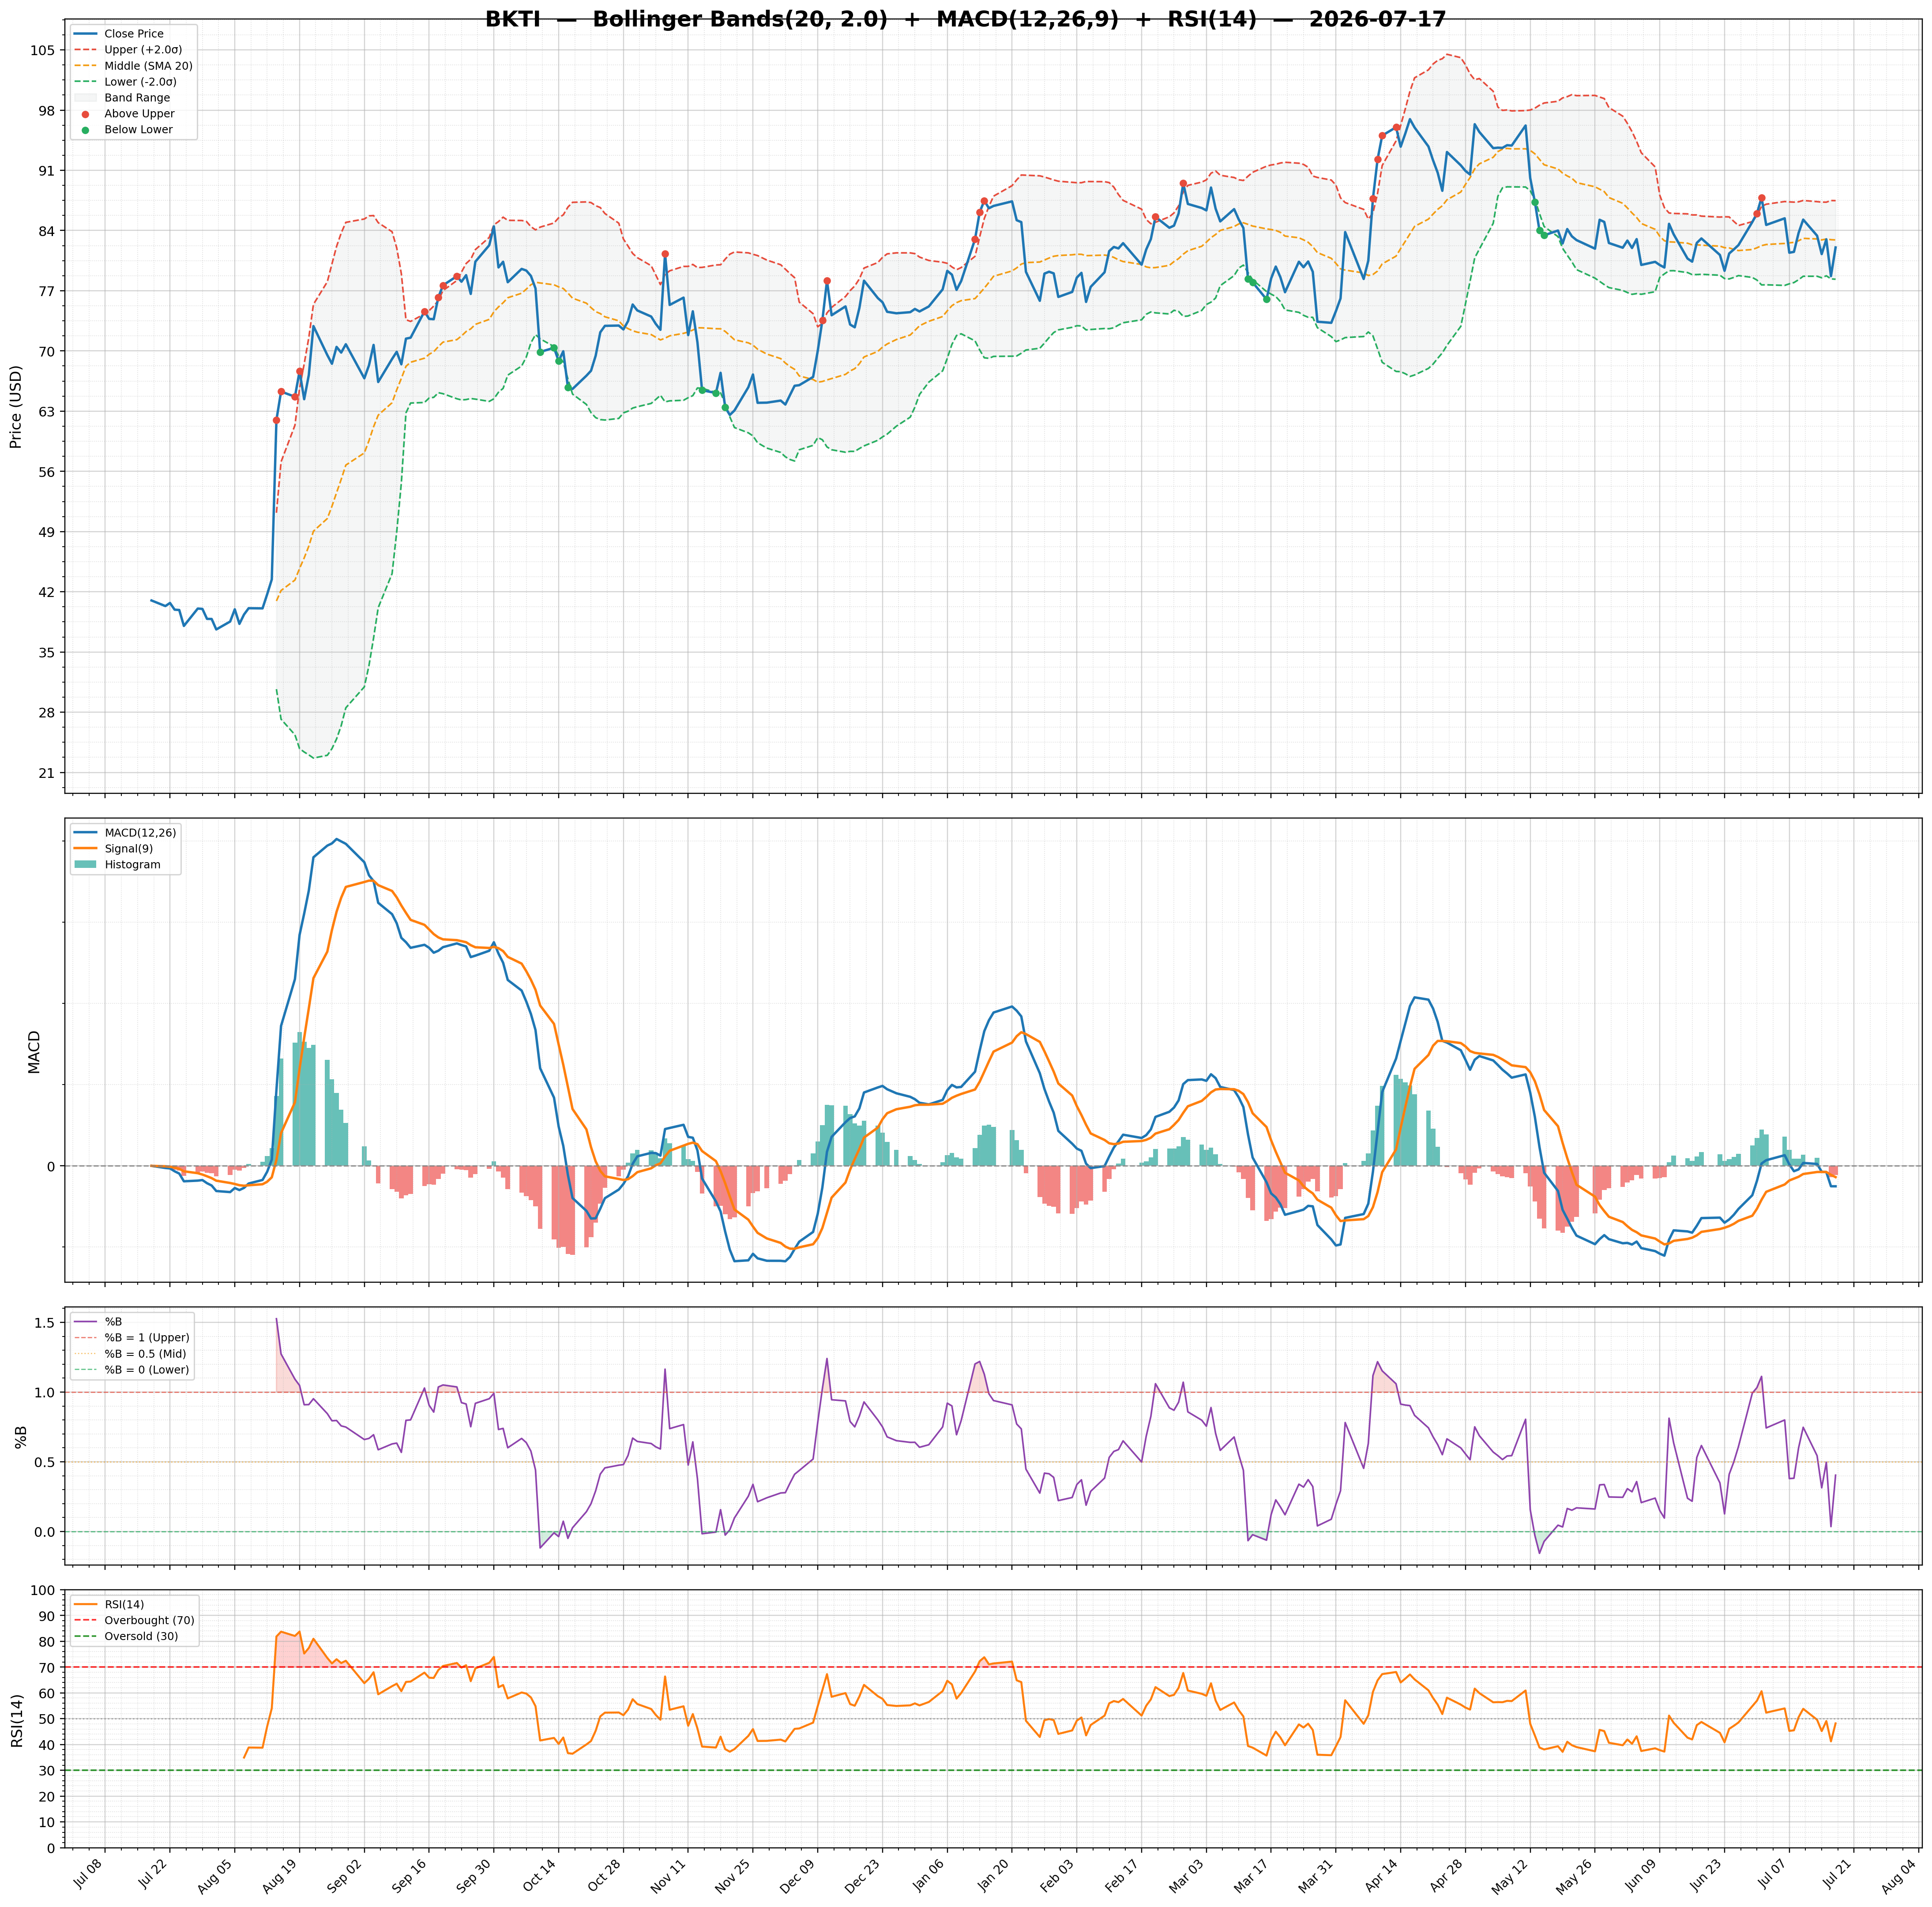
| 2026-07-17 | BKTI | 82.03 | / | 74.85% | none | 49,456/44,523 | 11.02/0.40 | 48.18/-0.2300 | 0.17 | -0.50/-0.28 | Chart 3M 🌐 |
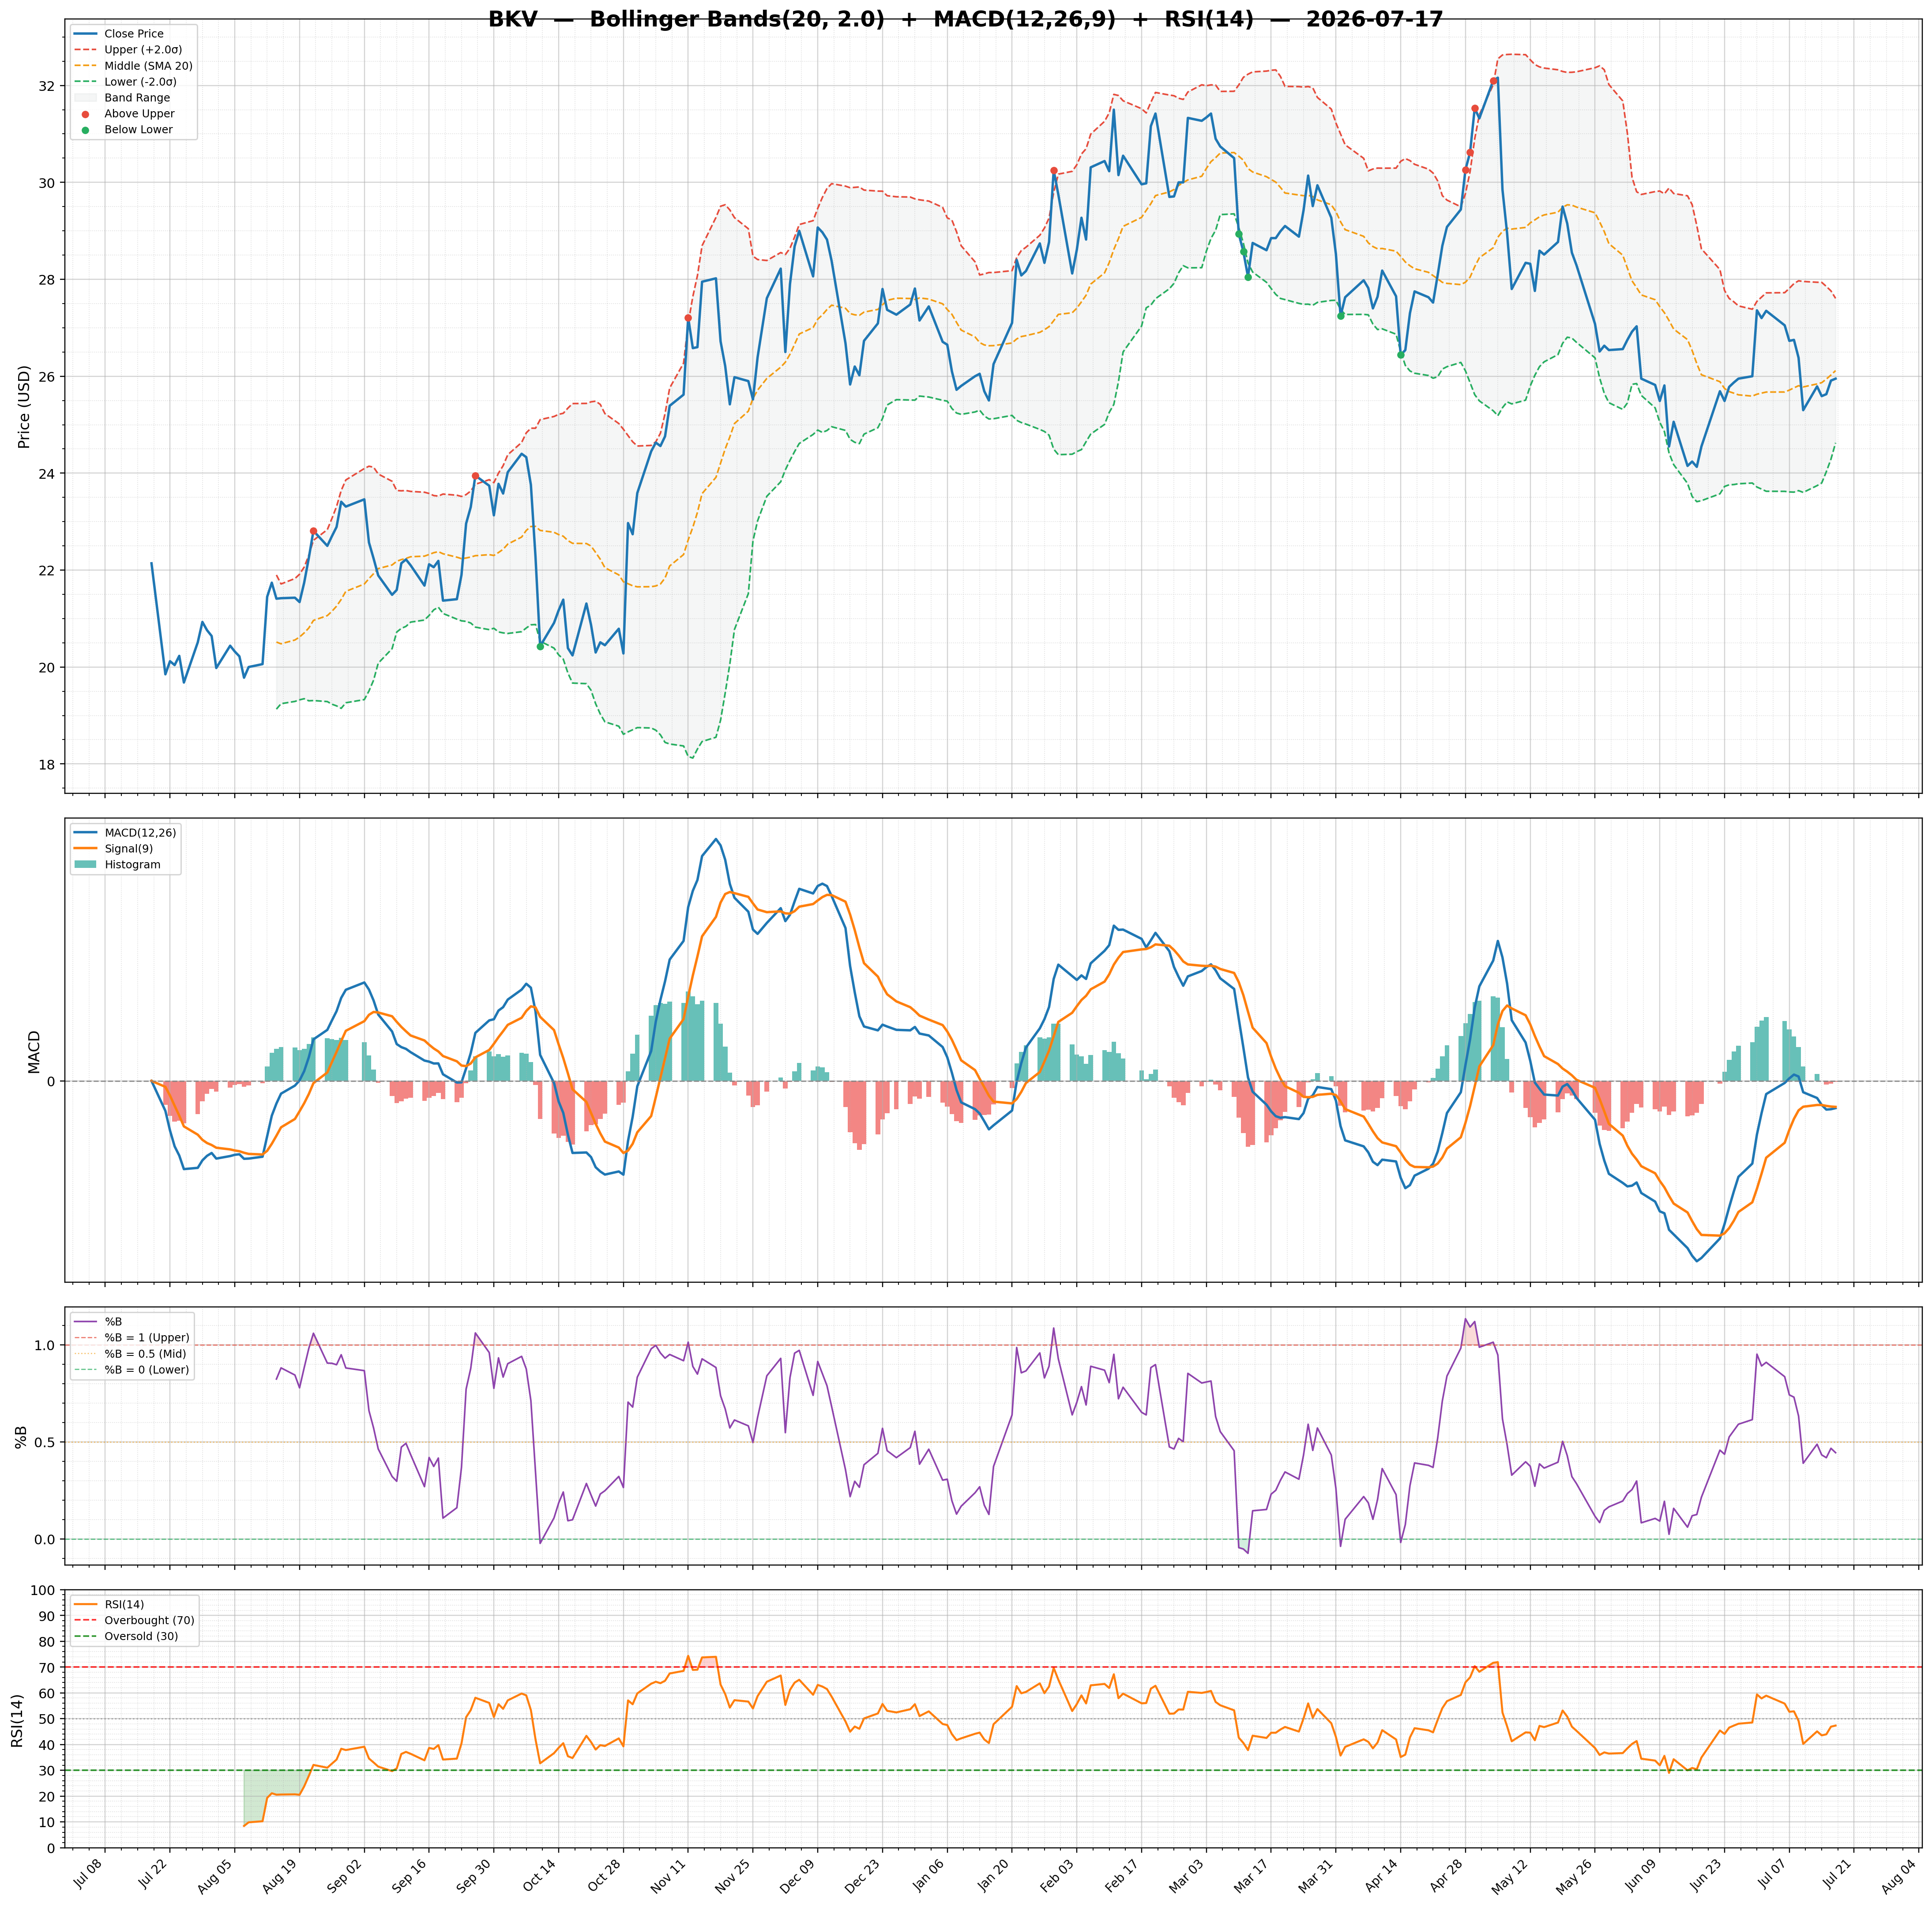
| 2026-07-17 | BKV | 25.95 | / | 50.24% | strong_buy | 456,726/913,566 | 11.42/0.44 | 47.34/-0.0100 | 0.09 | -0.17/-0.16 | Chart 3M 🌐 |
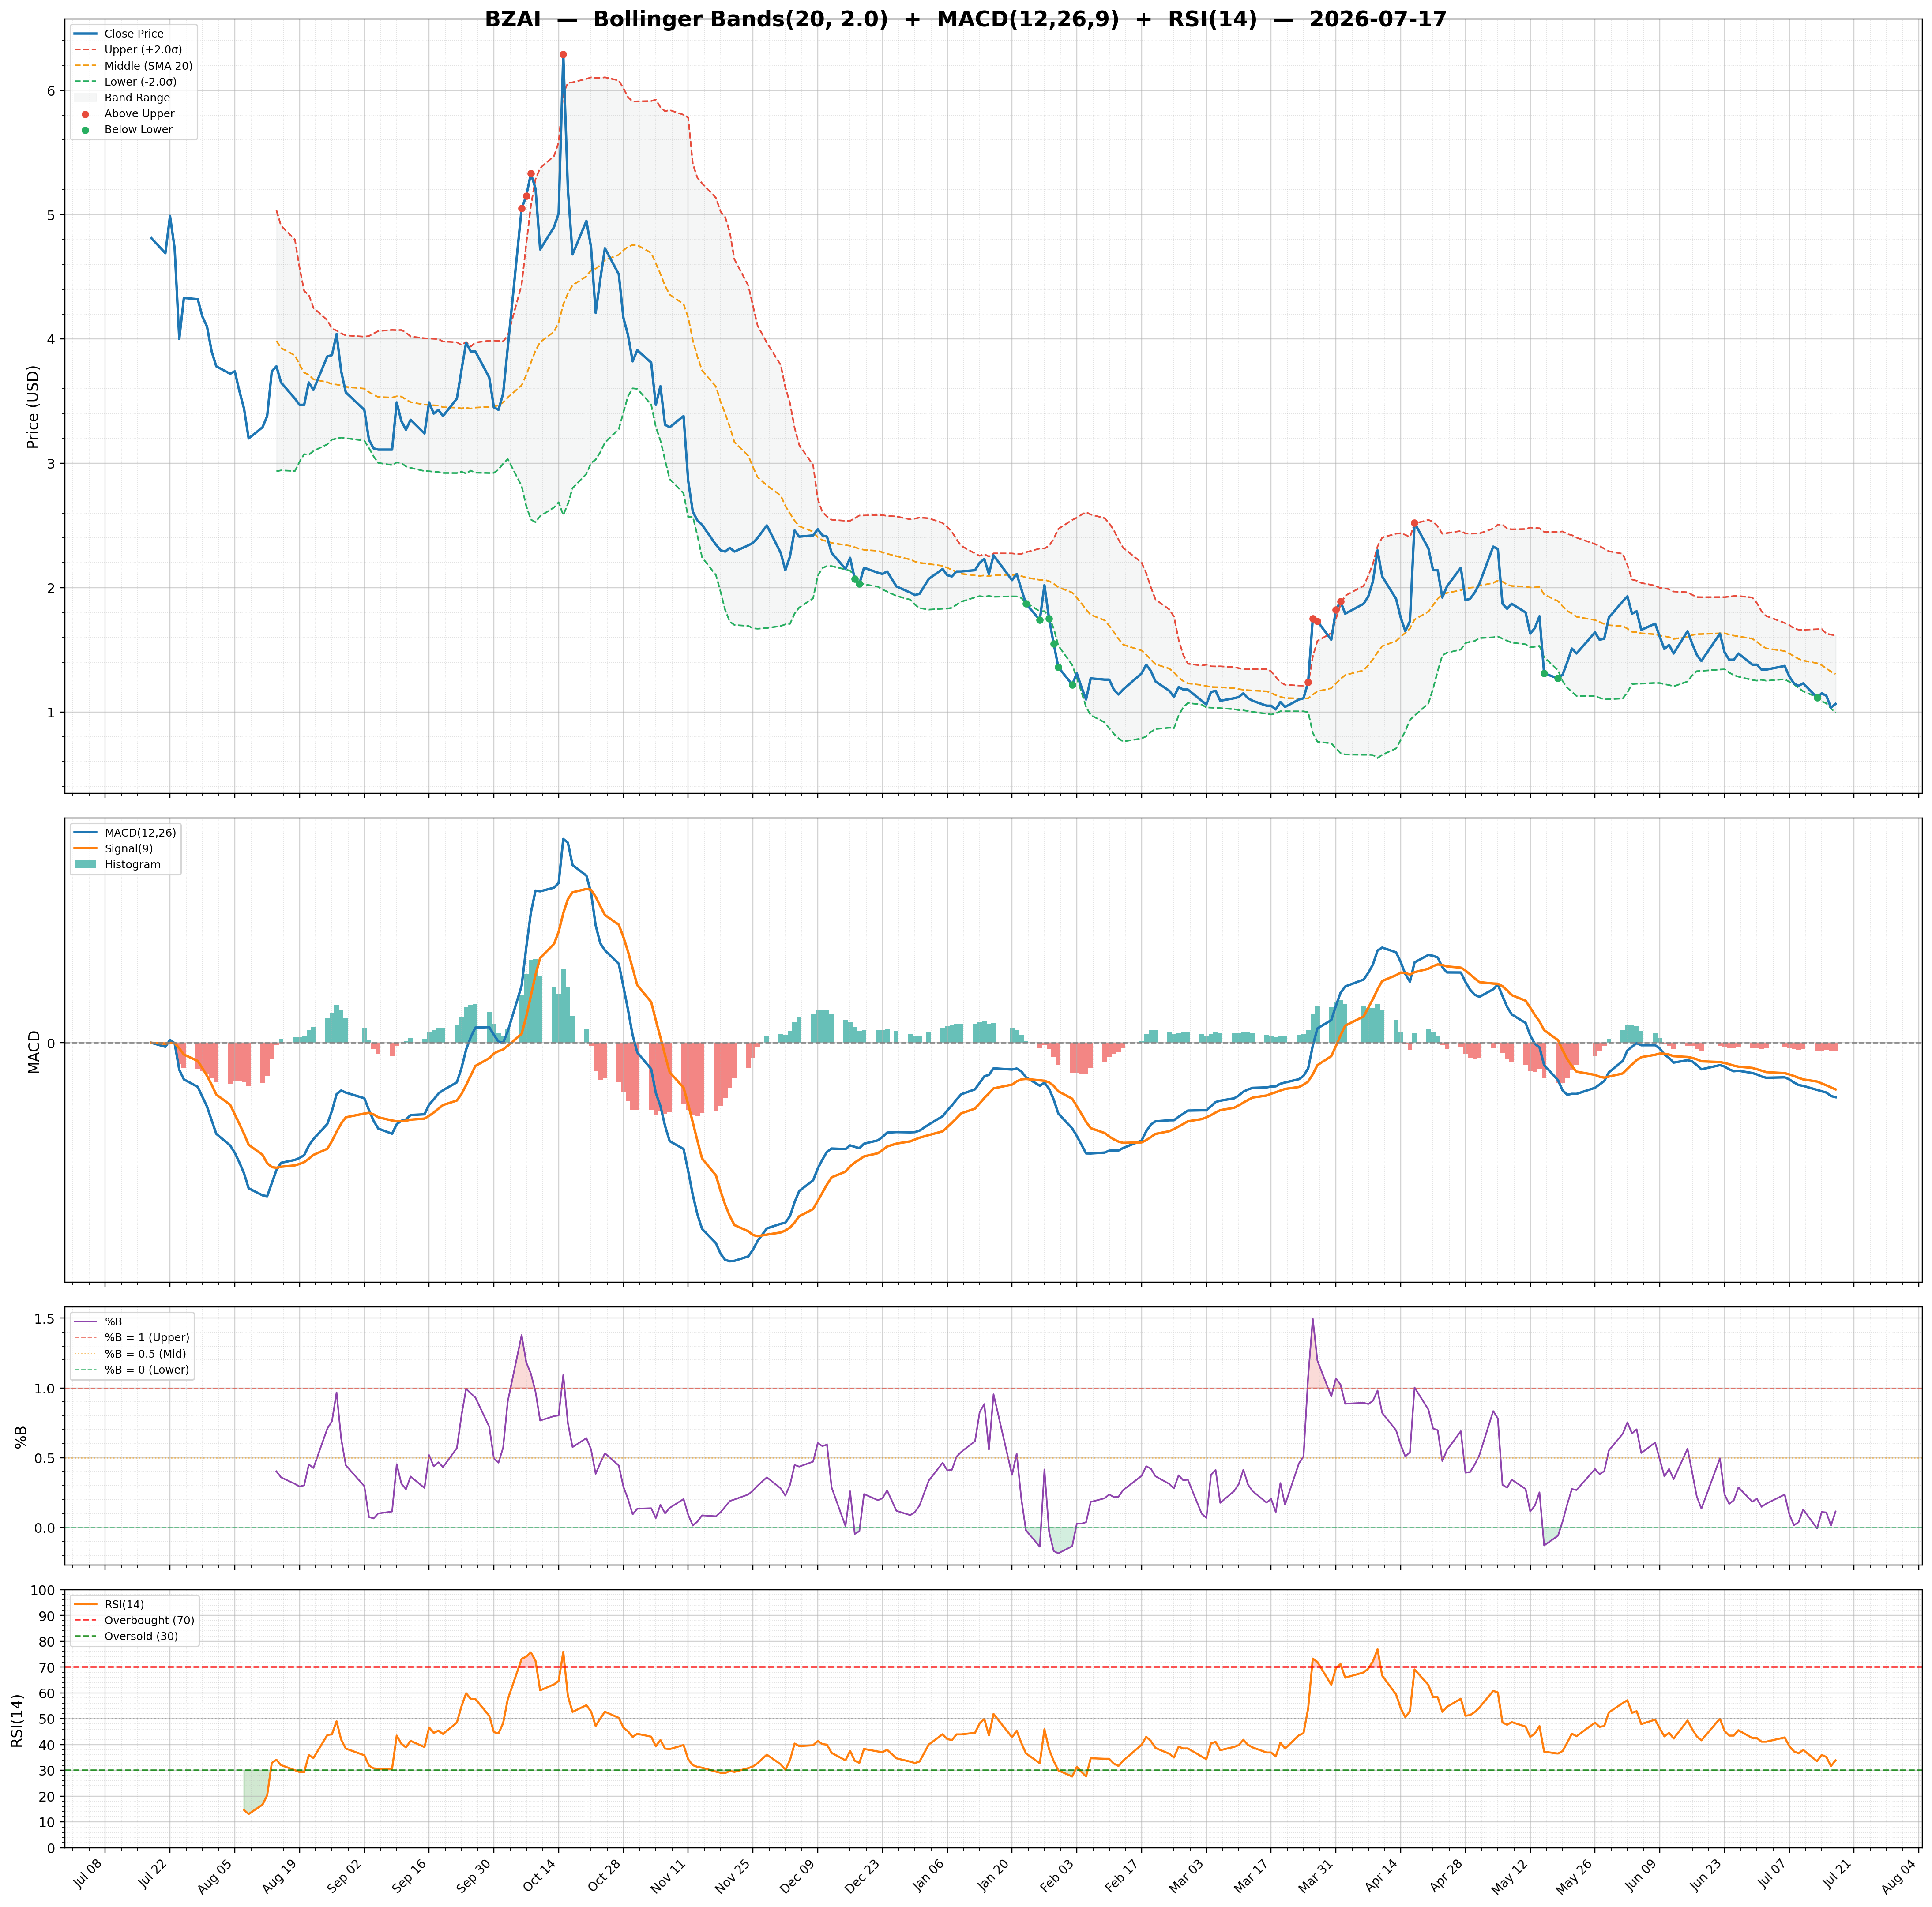
| 2026-07-17 | BZAI | 1.06 | / | 0.85% | none | 2,023,108/3,748,548 | 47.75/0.12 | 33.89/-0.0200 | -0.57 | -0.13/-0.11 | Chart 3M 🌐 |
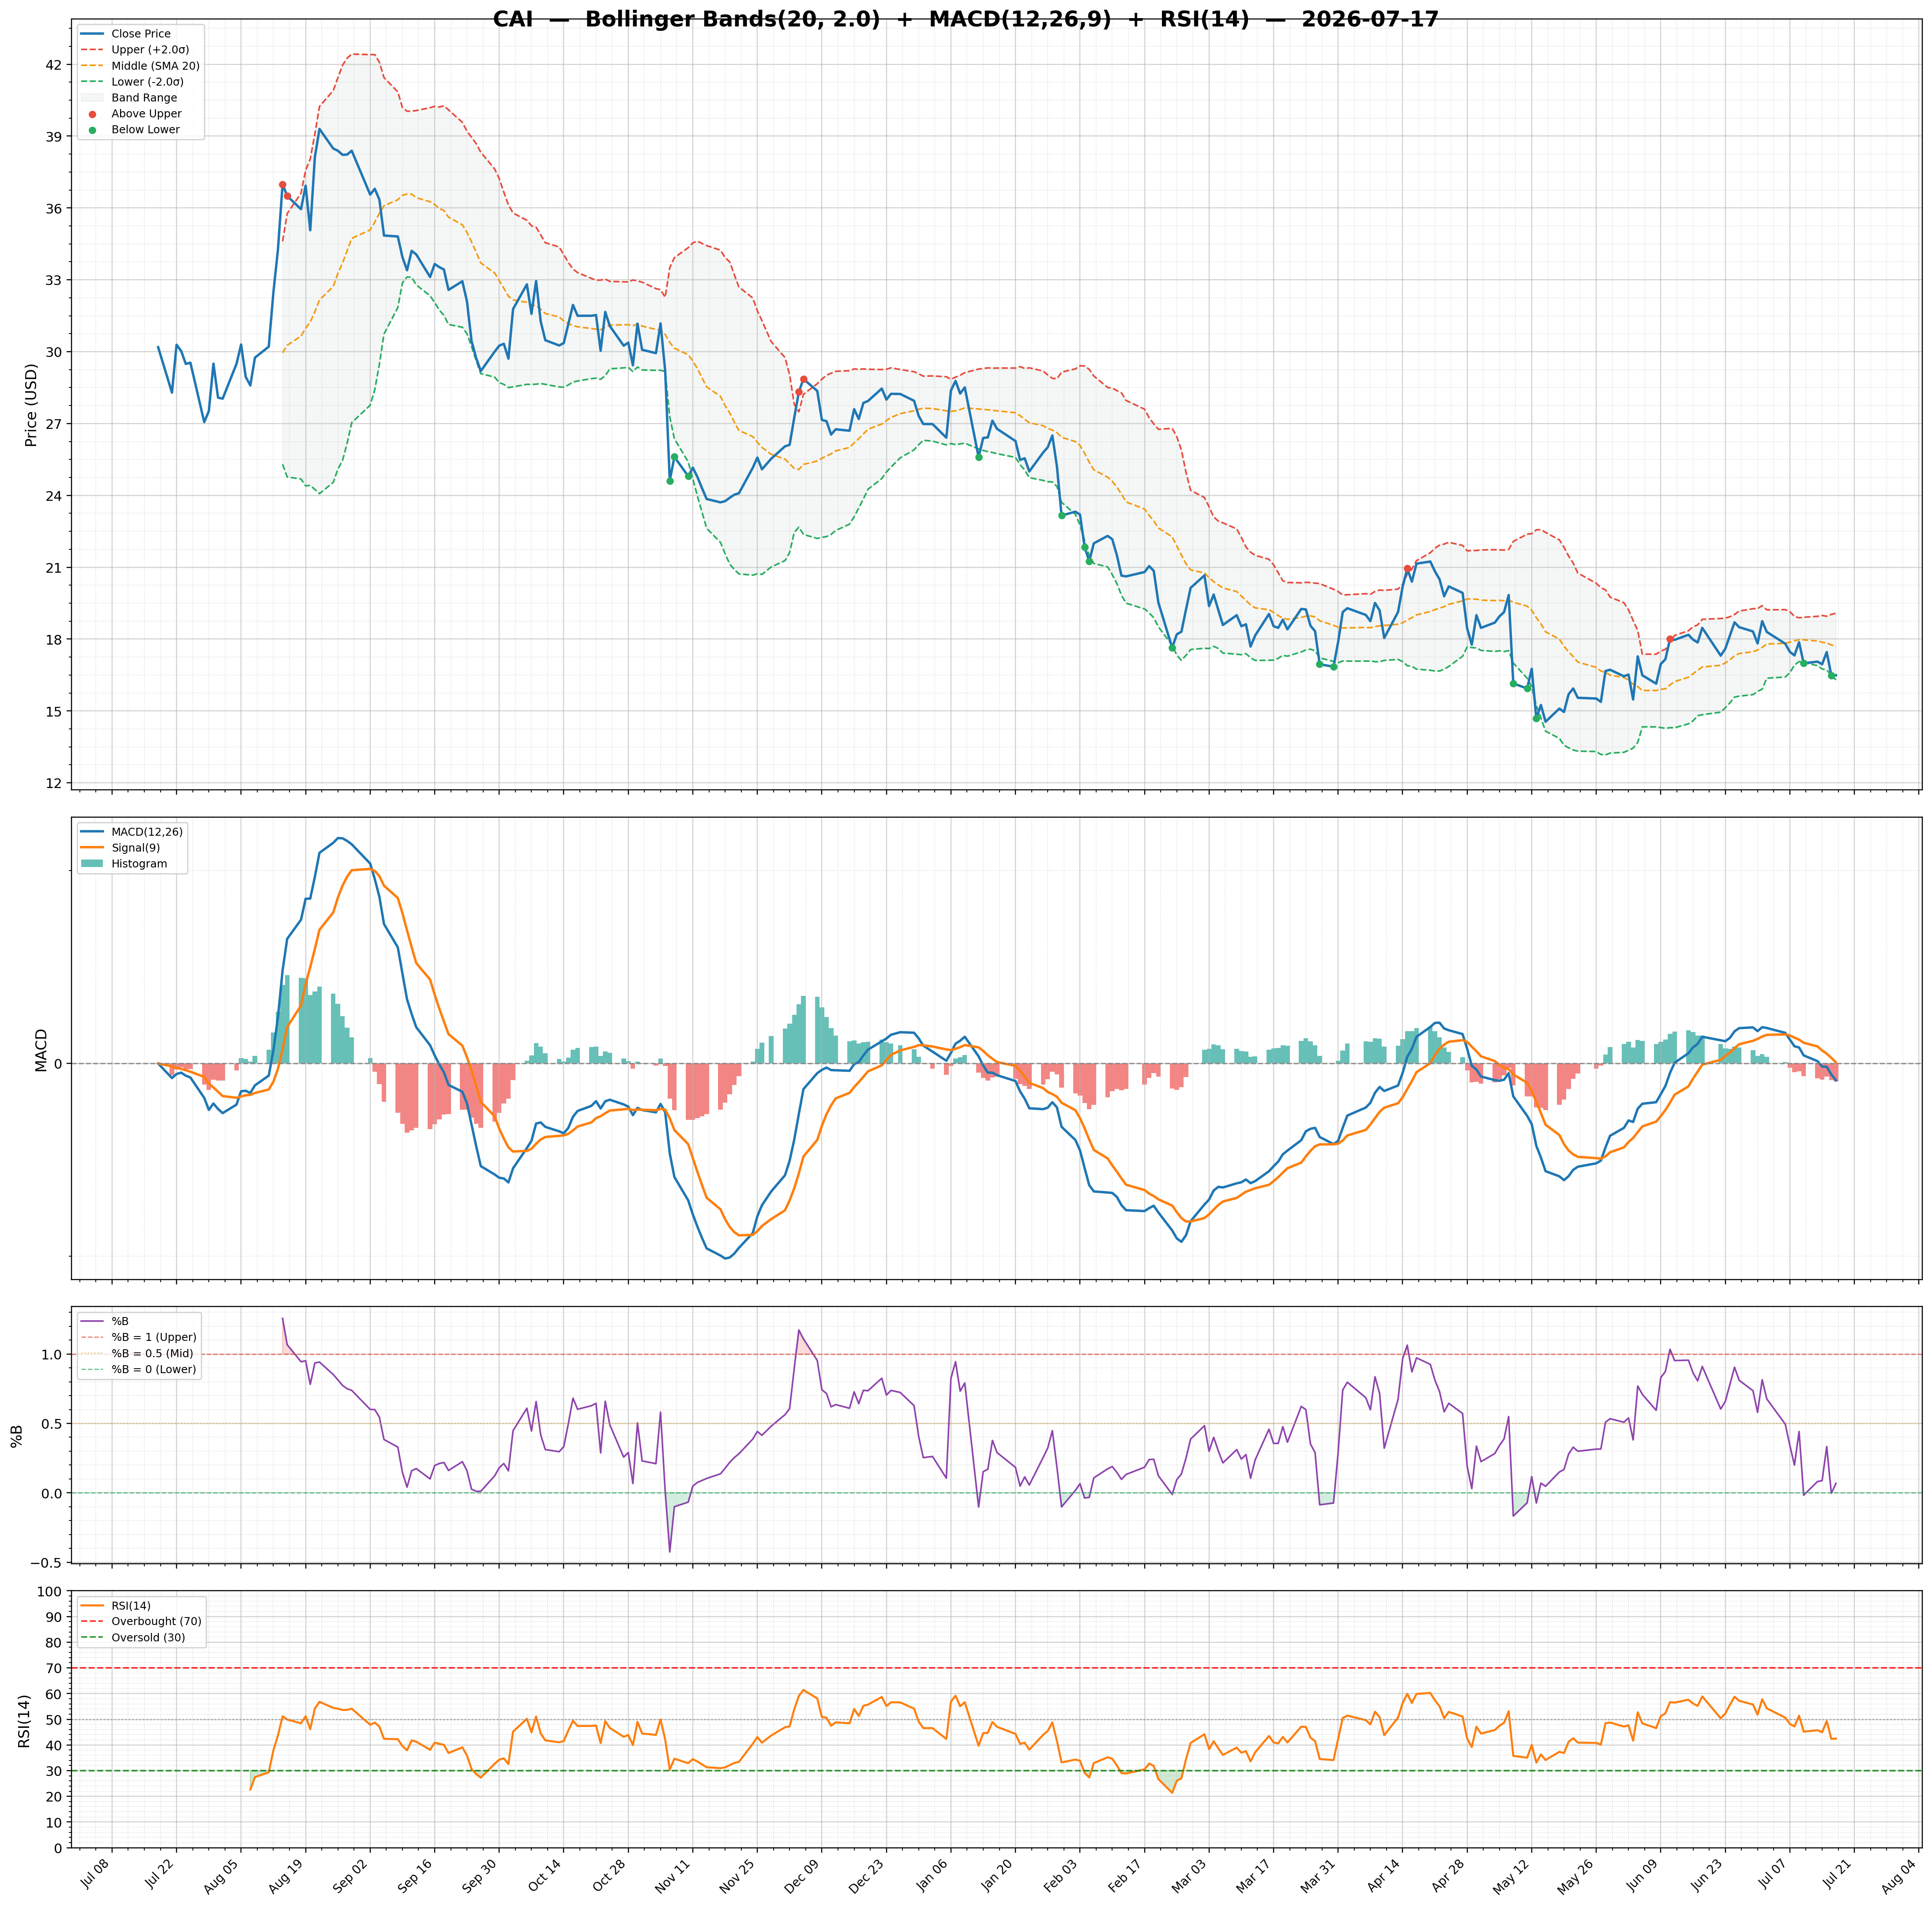
| 2026-07-17 | CAI | 16.49 | / | 7.84% | buy | 3,294,597/3,553,827 | 15.72/0.07 | 42.47/-0.1900 | -0.33 | -0.18/0.01 | Chart 3M 🌐 |
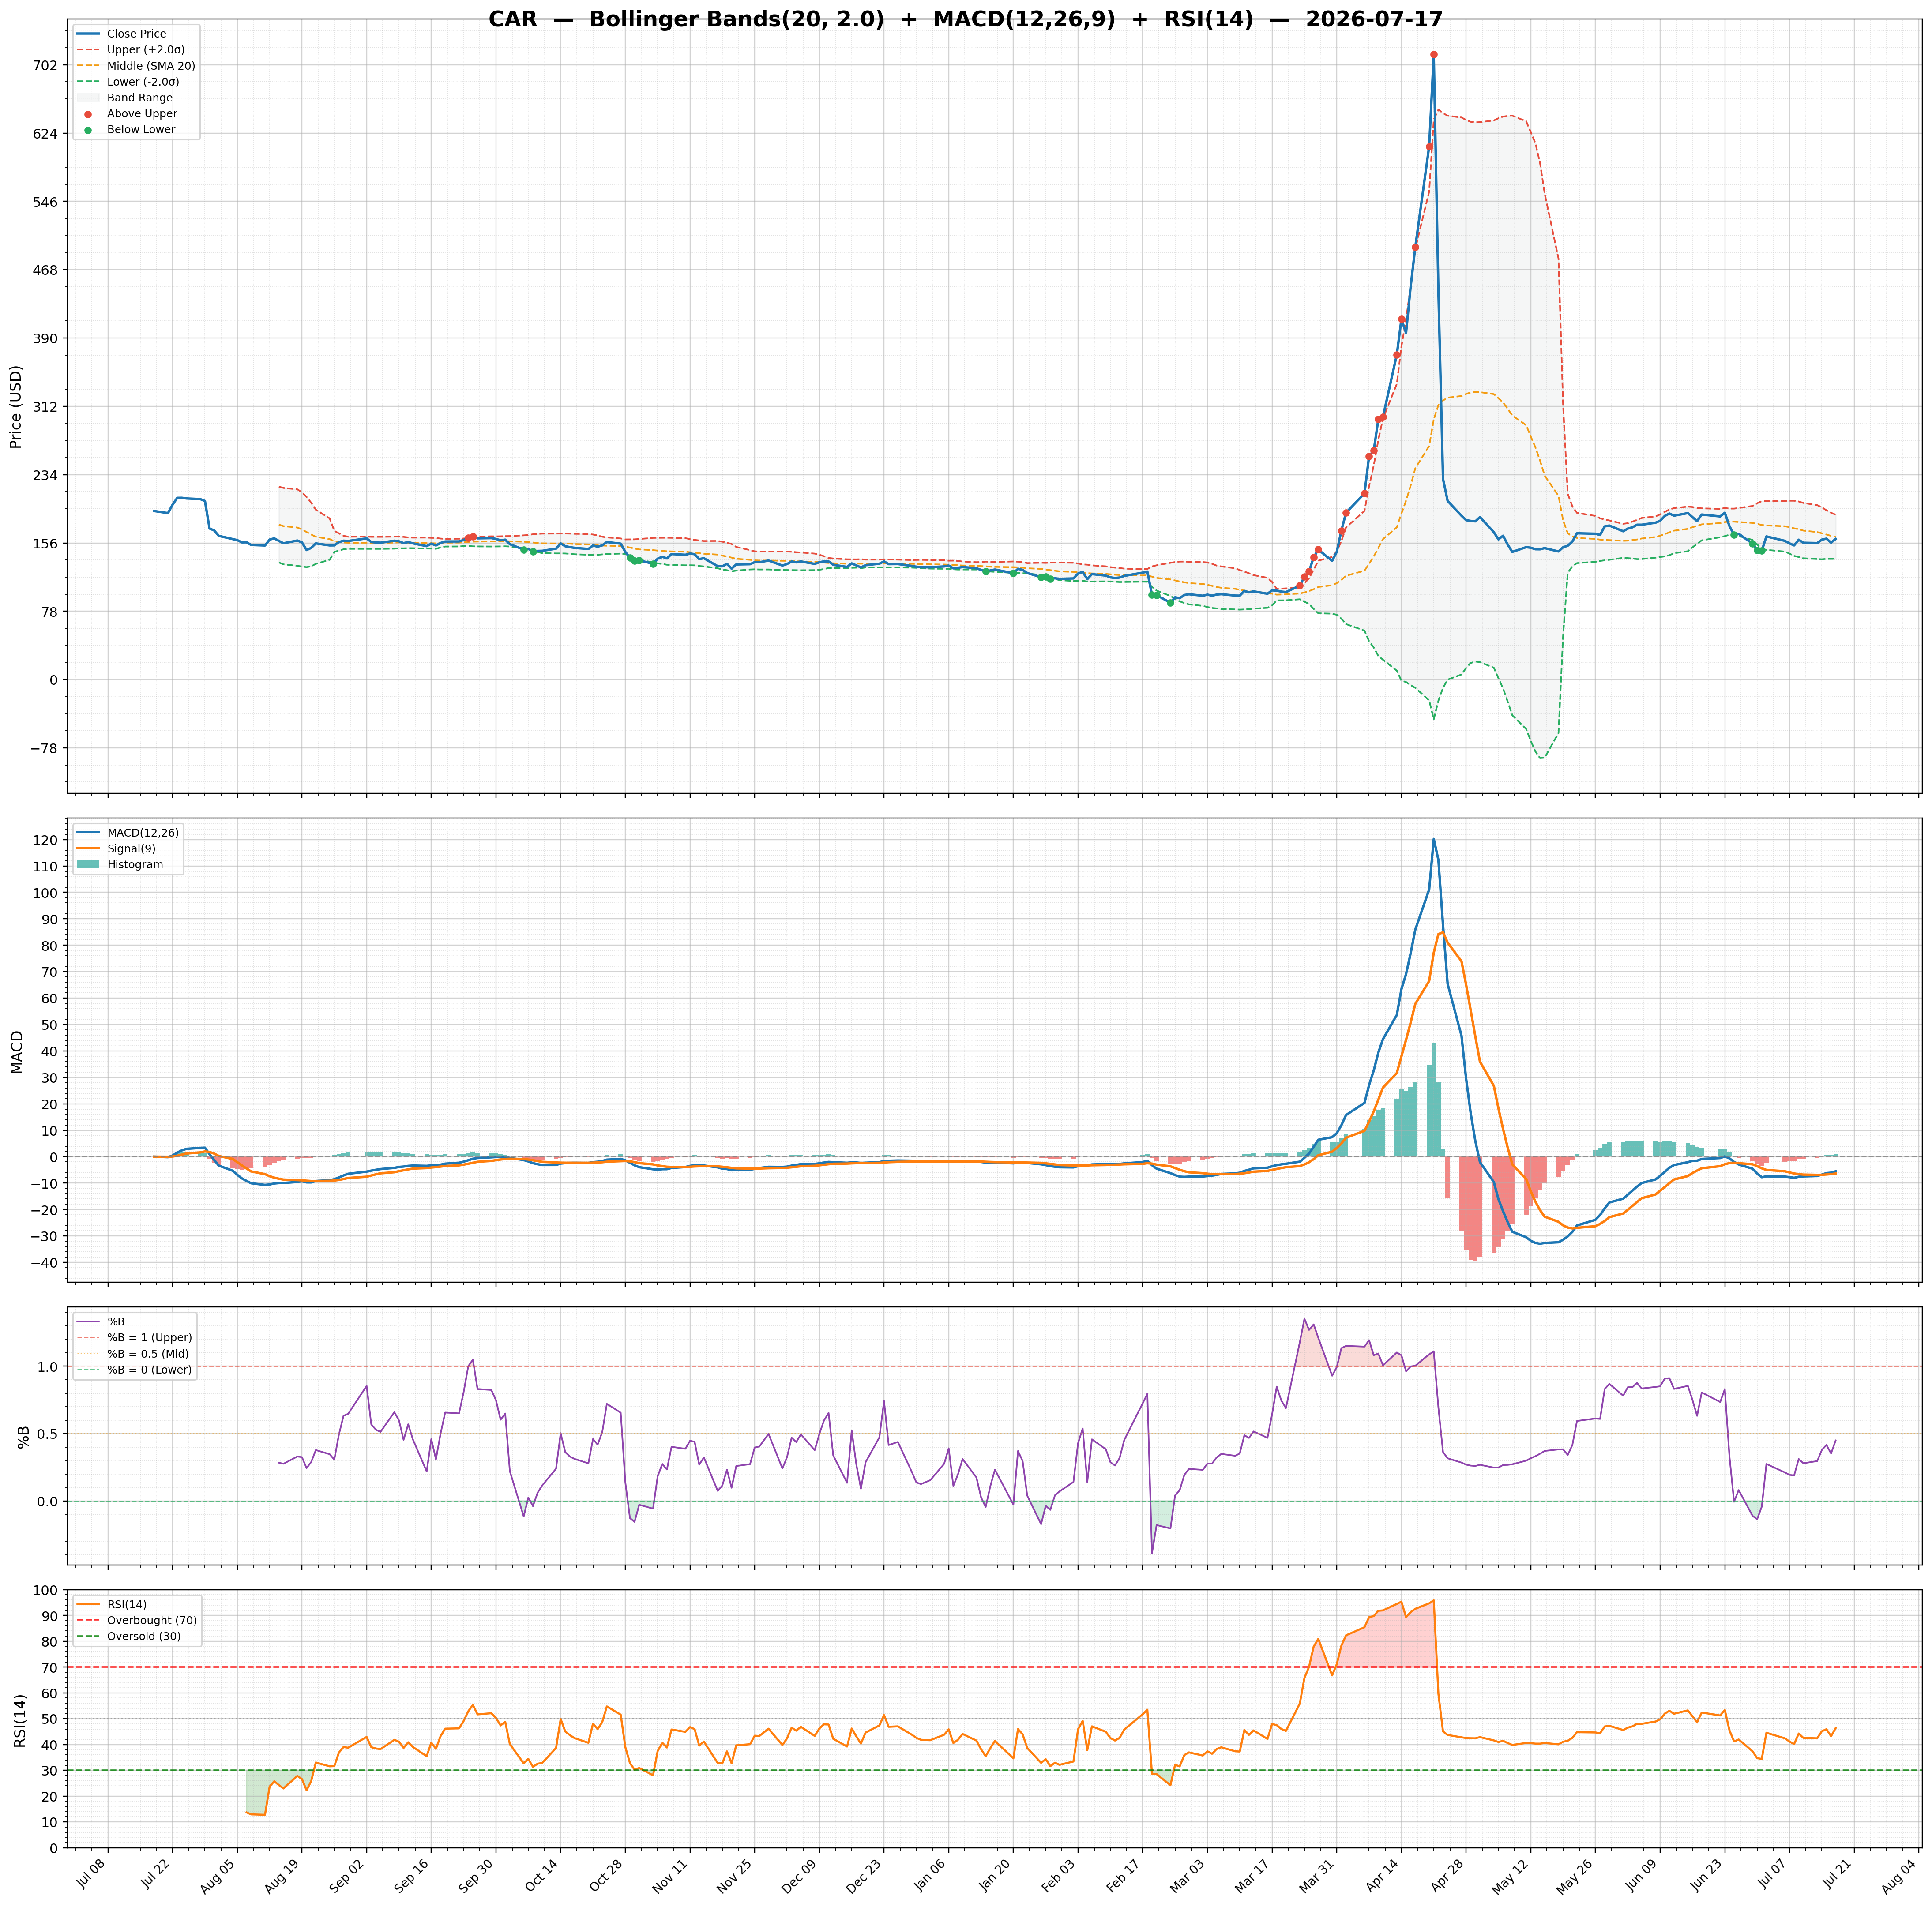
| 2026-07-17 | CAR | 160.57 | / | 11.64% | hold | 279,298/683,175 | 30.86/0.45 | 46.37/0.8600 | -0.22 | -5.53/-6.39 | Chart 3M 🌐 |
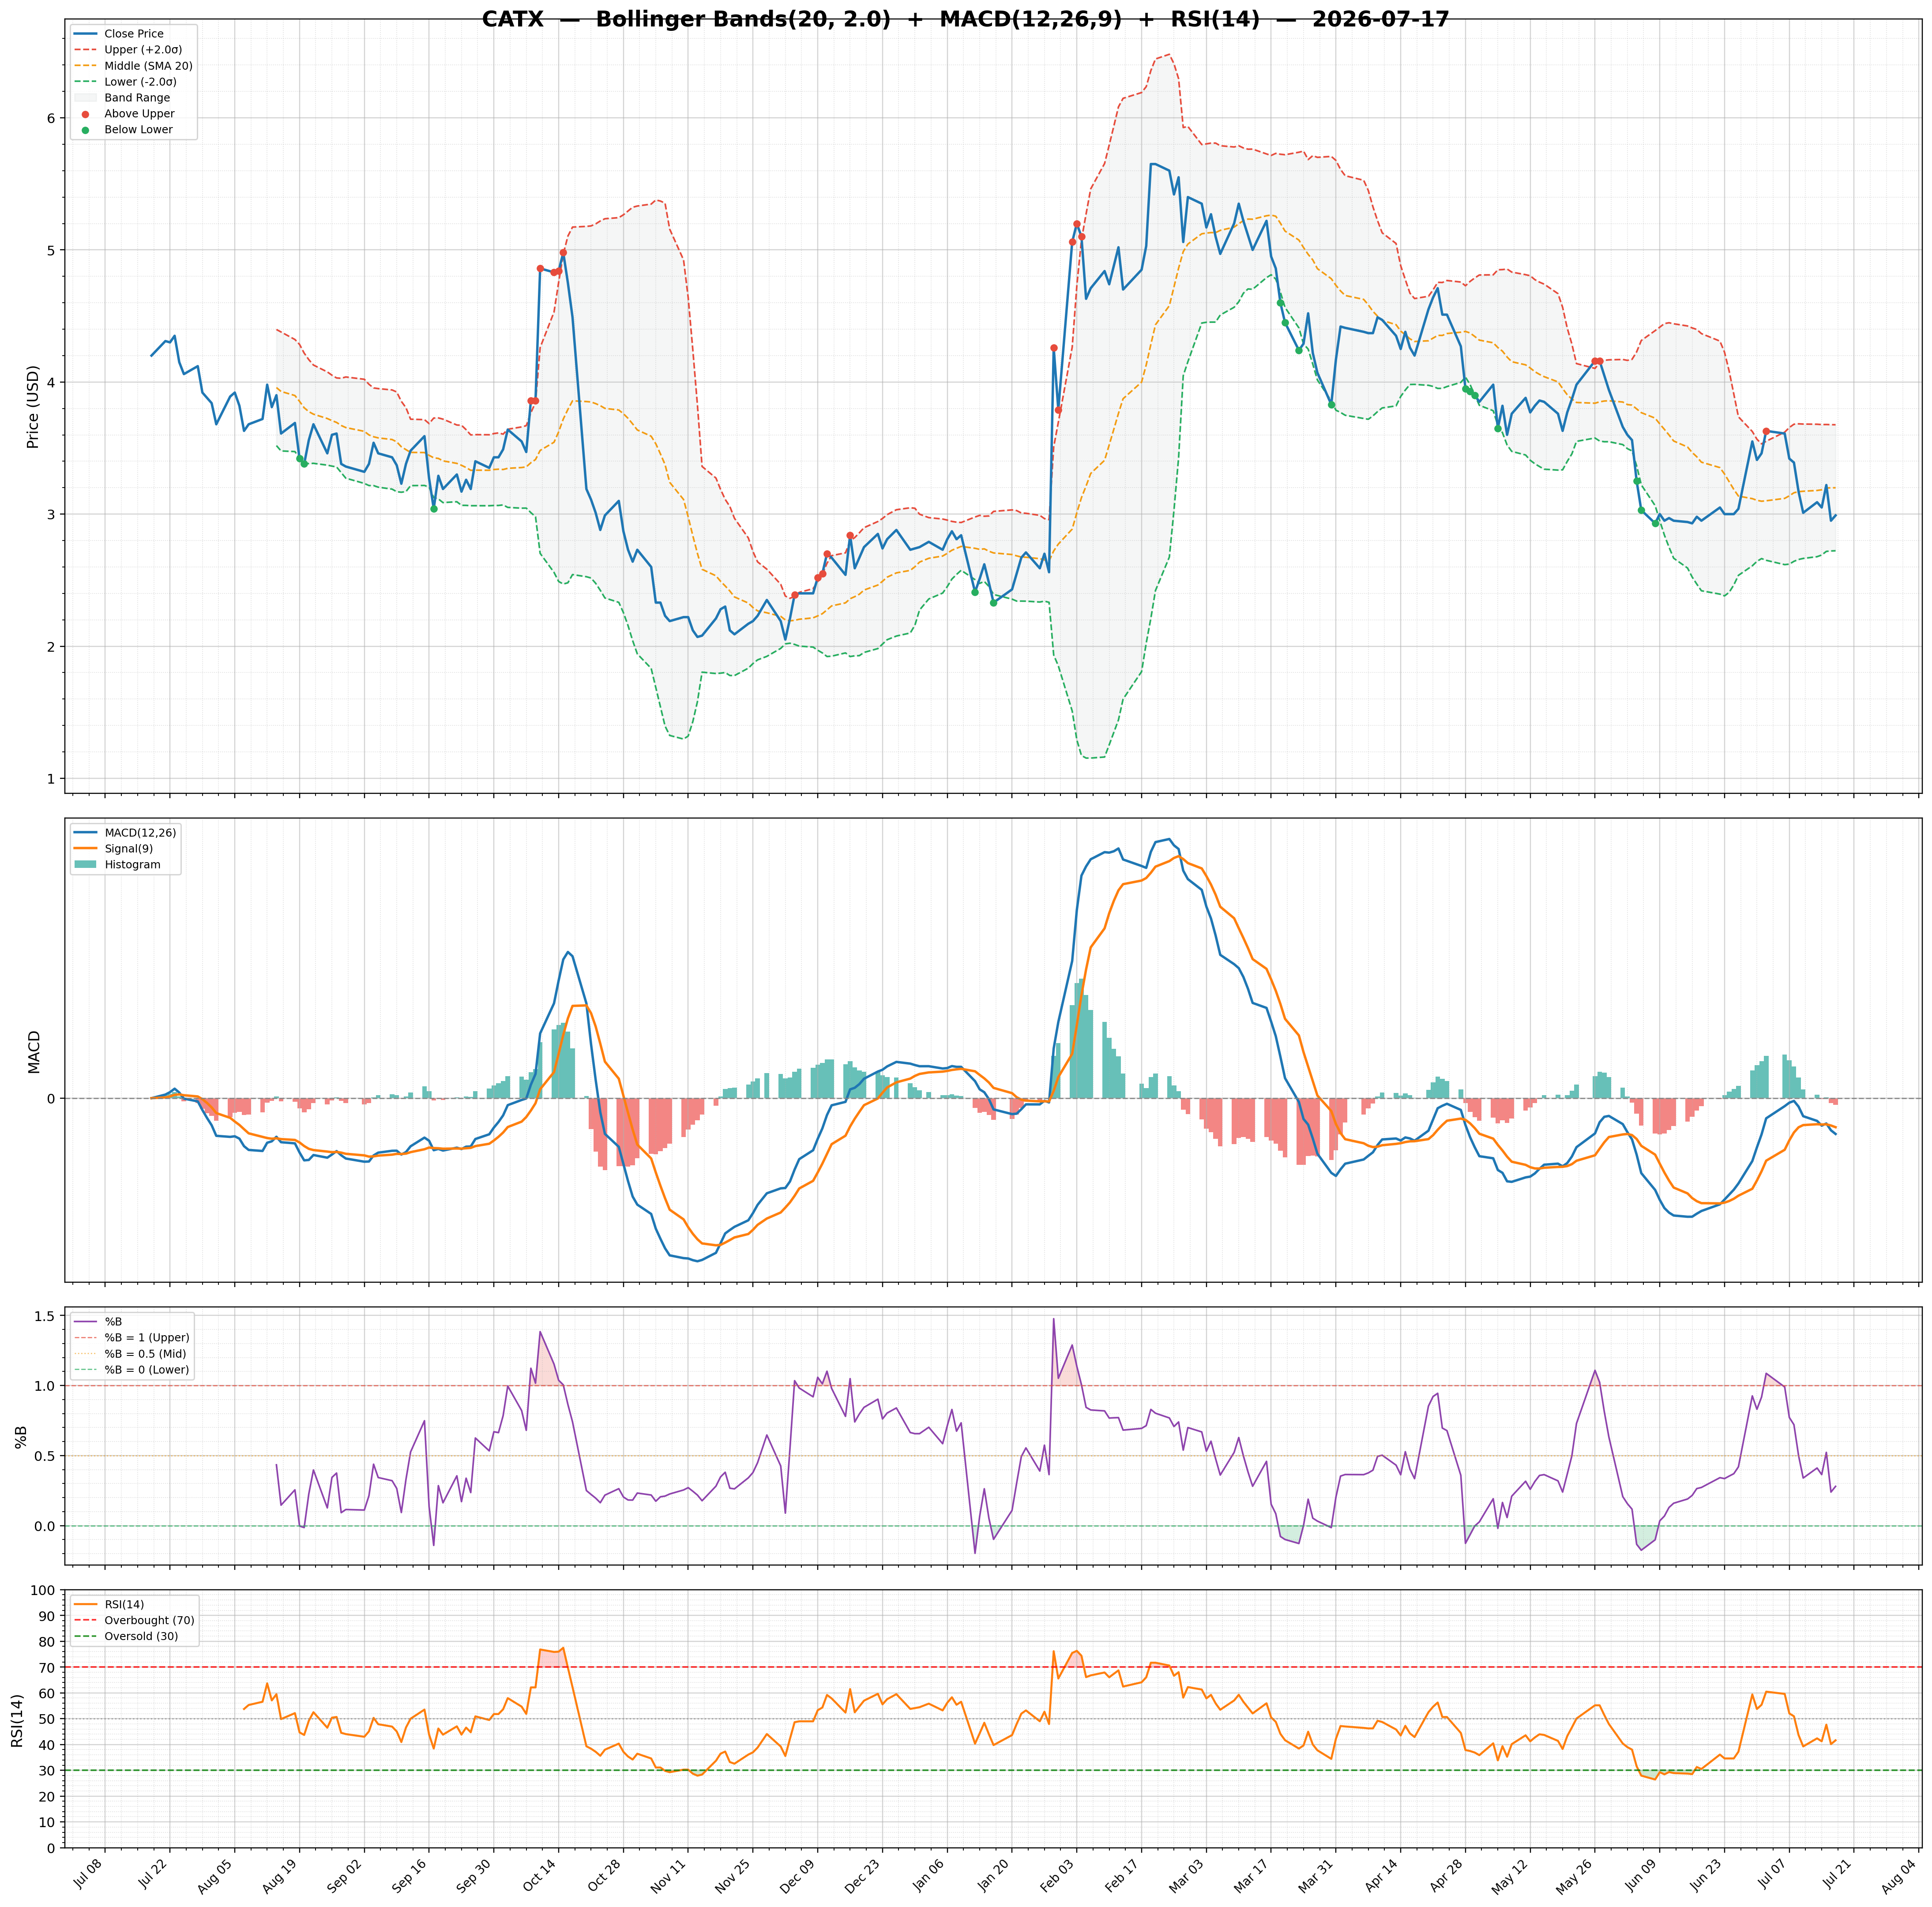
| 2026-07-17 | CATX | 2.99 | / | 26.11% | strong_buy | 849,823/2,673,081 | 29.82/0.28 | 41.62/-0.0200 | -0.23 | -0.09/-0.07 | Chart 3M 🌐 |
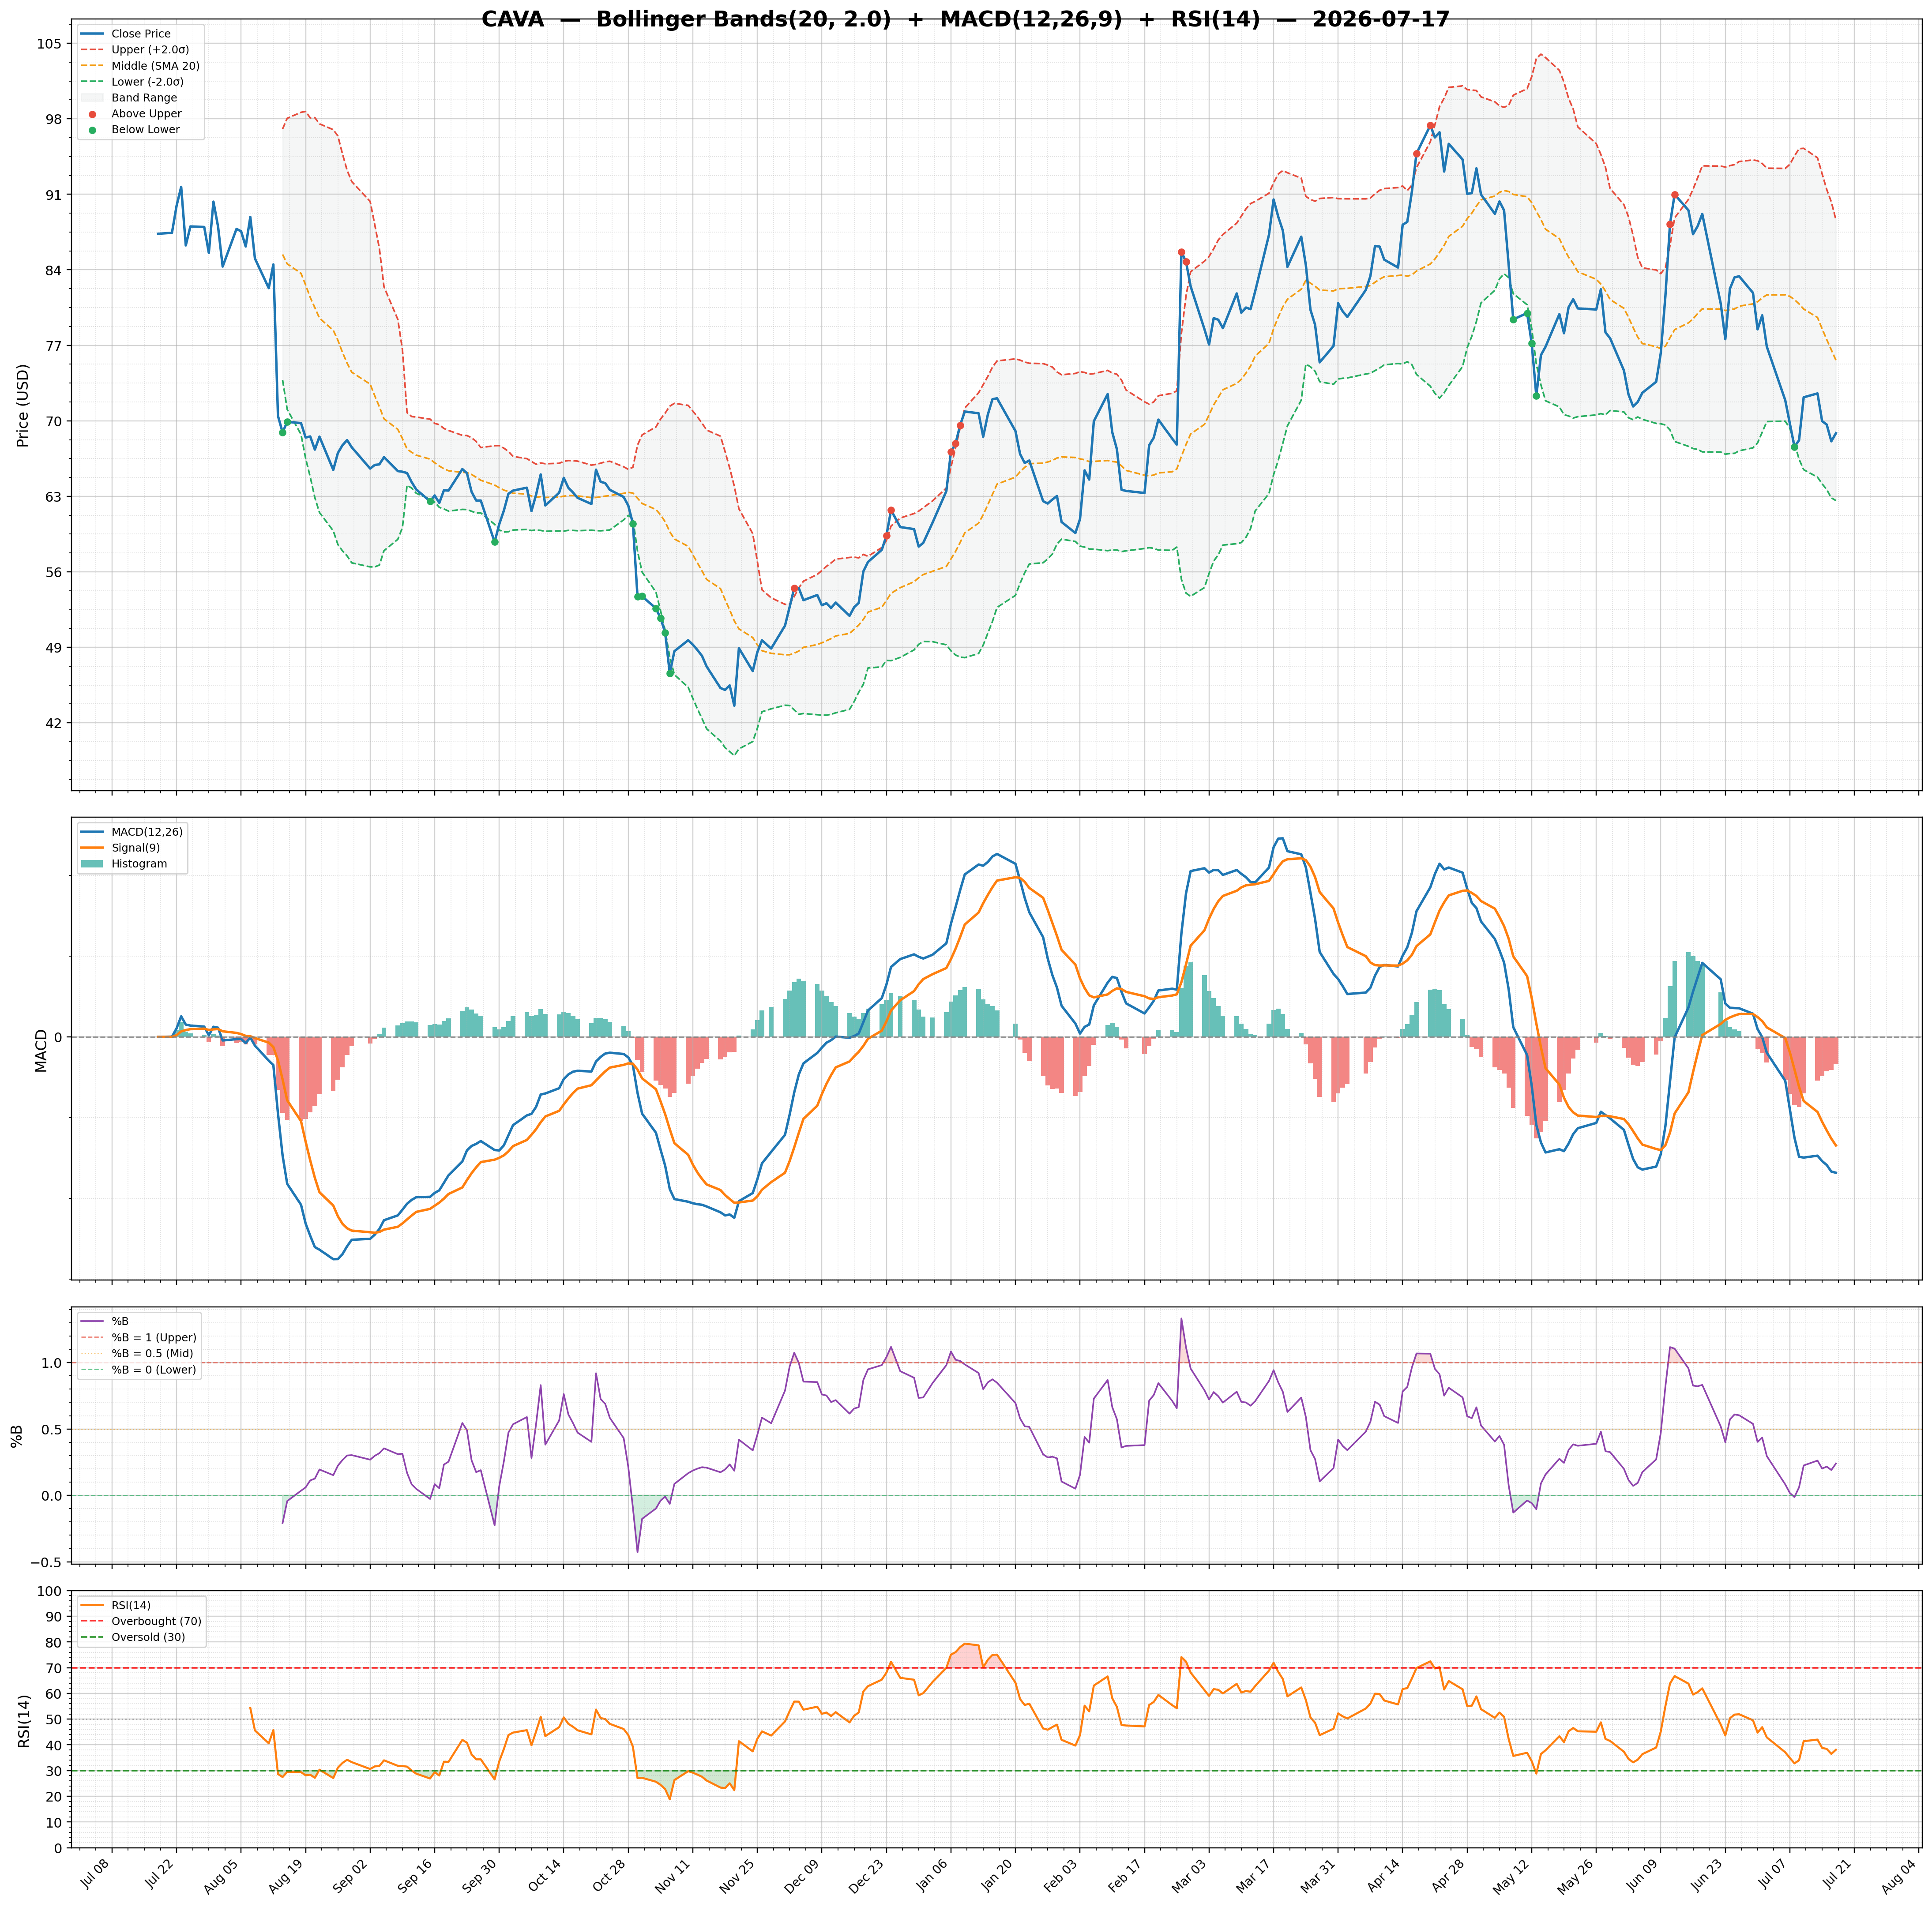
| 2026-07-17 | CAVA | 68.85 | / | 46.95% | buy | 2,142,961/2,975,393 | 34.41/0.24 | 38.11/-0.6800 | -0.13 | -3.36/-2.69 | Chart 3M 🌐 |
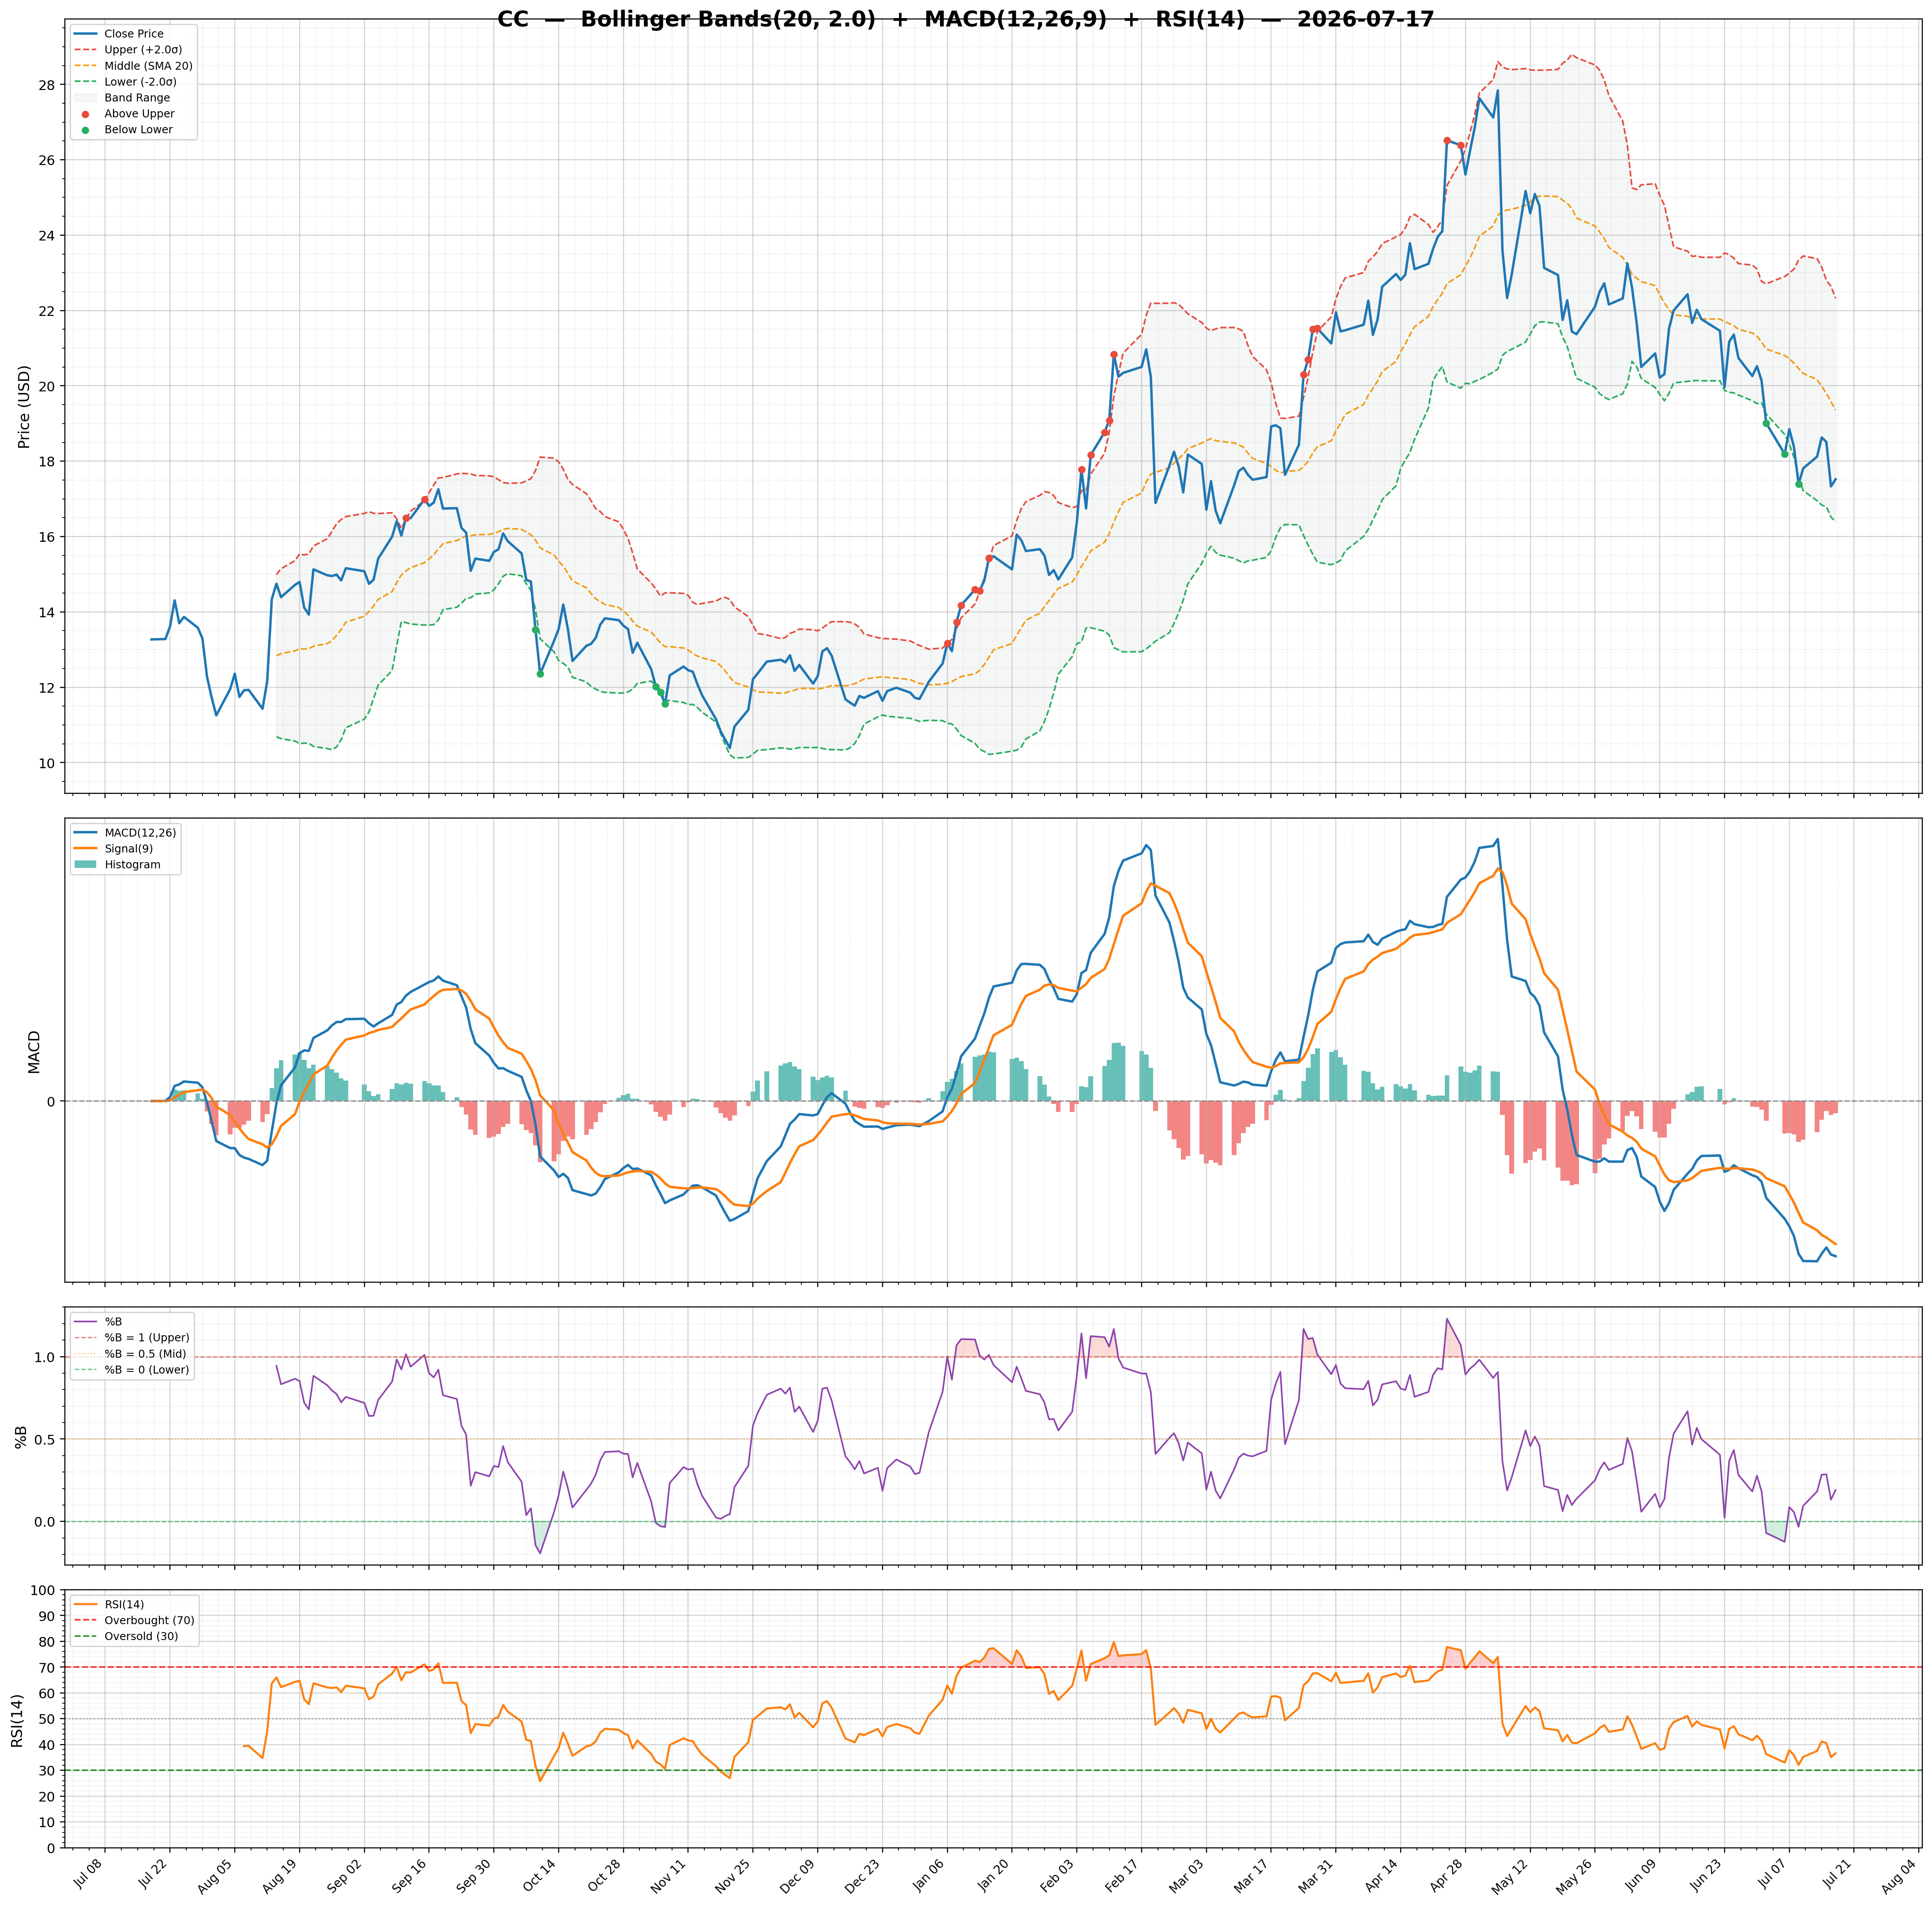
| 2026-07-17 | CC | 17.52 | / | 40.86% | buy | 1,517,314/2,902,268 | 30.66/0.19 | 36.58/-0.0800 | 0.05 | -1.06/-0.98 | Chart 3M 🌐 |
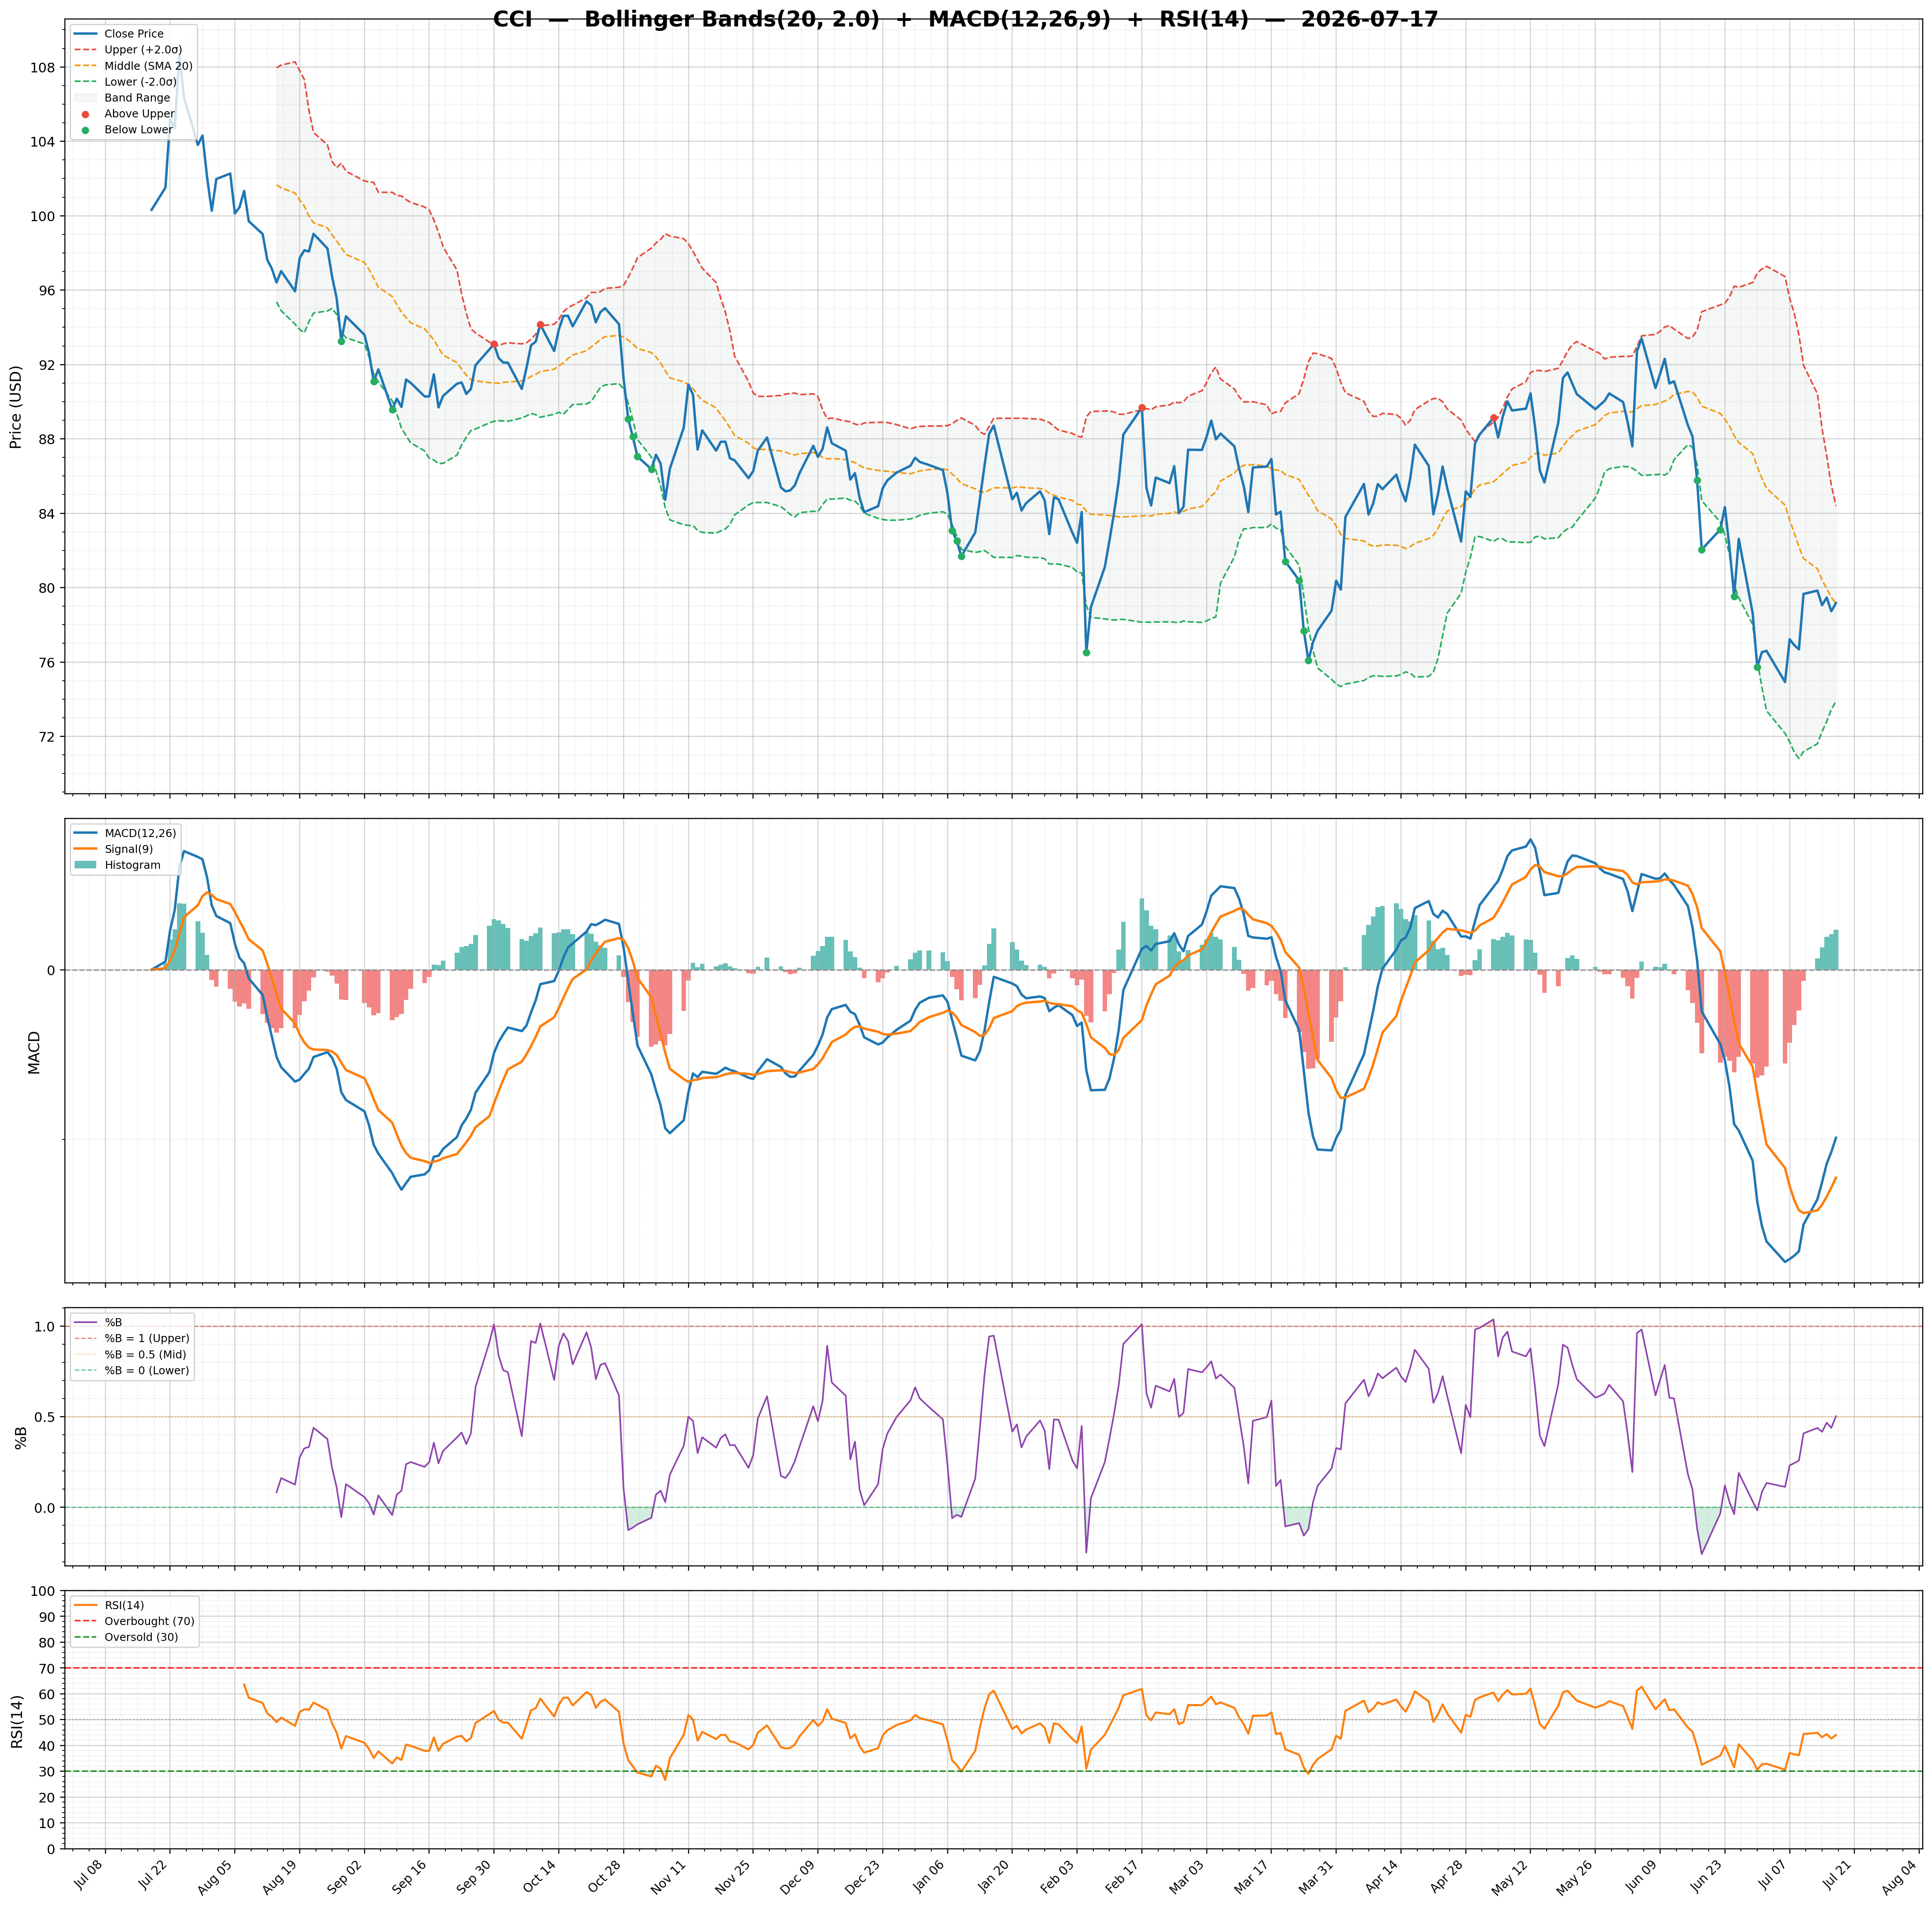
| 2026-07-17 | CCI | 79.17 | / | 12.59% | buy | 2,934,109/4,445,328 | 13.28/0.50 | 44.04/0.4700 | -0.12 | -1.98/-2.45 | Chart 3M 🌐 |
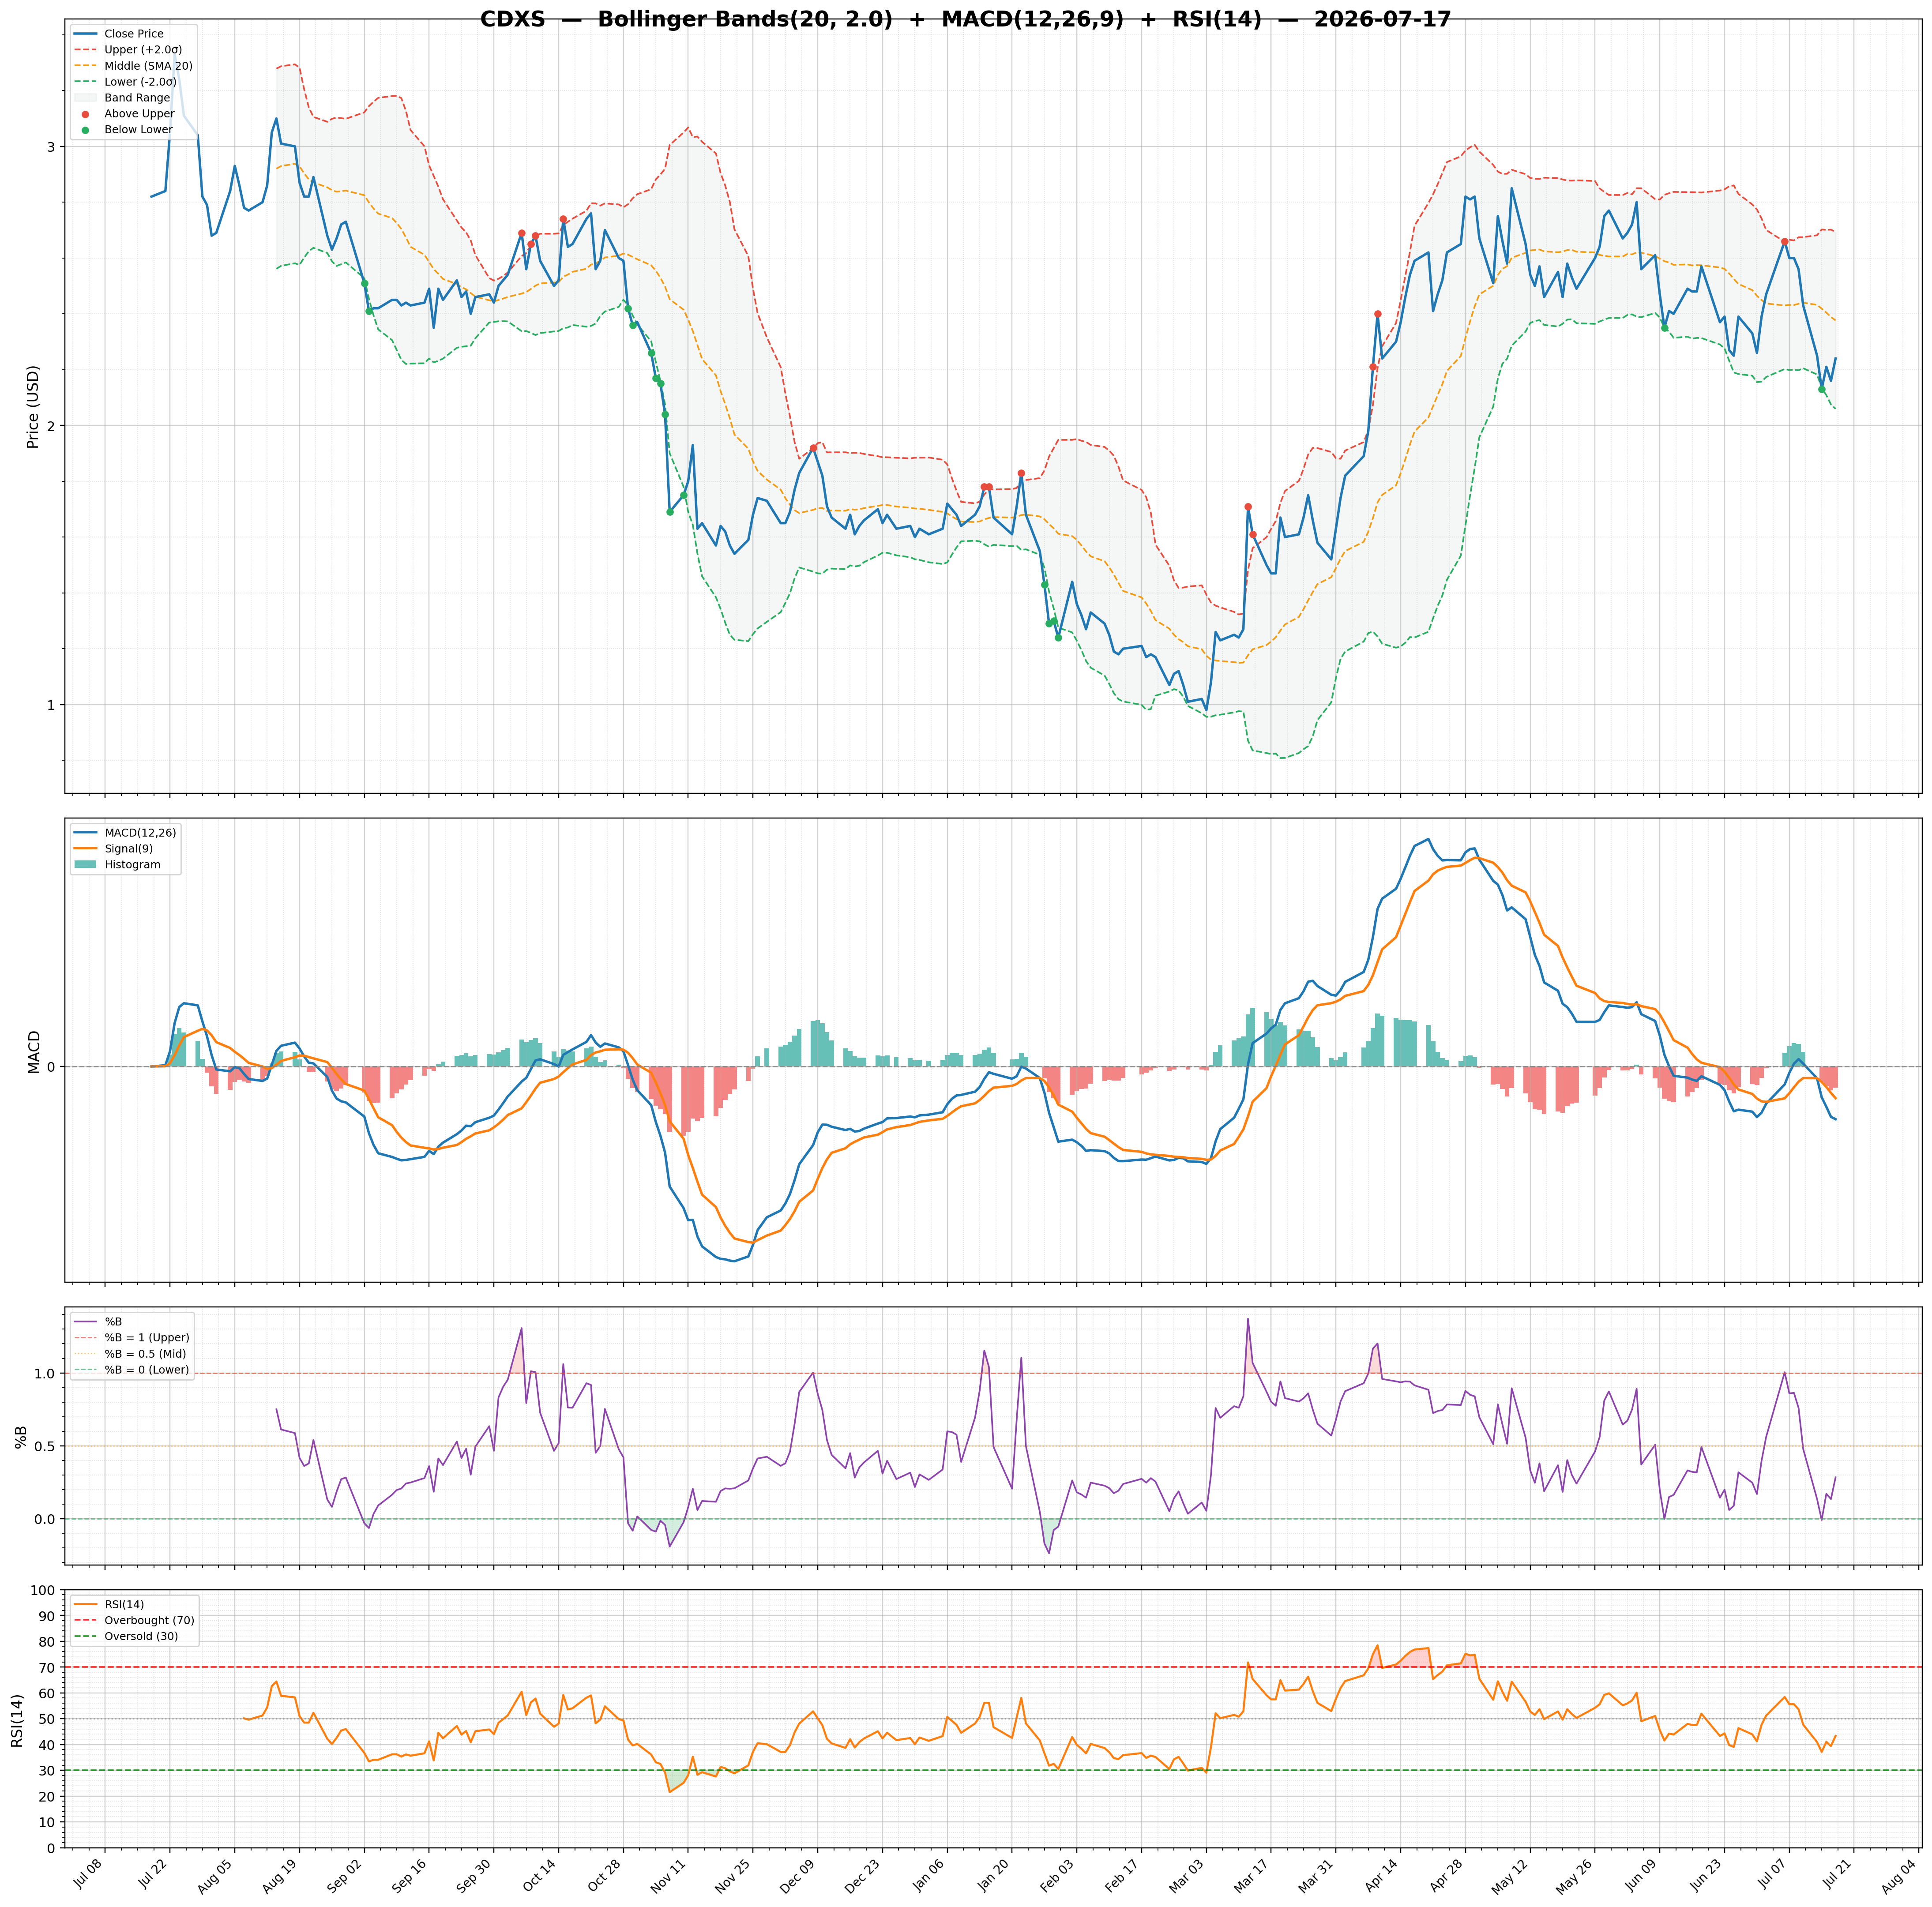
| 2026-07-17 | CDXS | 2.24 | / | 53.62% | none | 404,375/899,701 | 26.66/0.28 | 43.32/-0.0300 | -0.06 | -0.07/-0.04 | Chart 3M 🌐 |
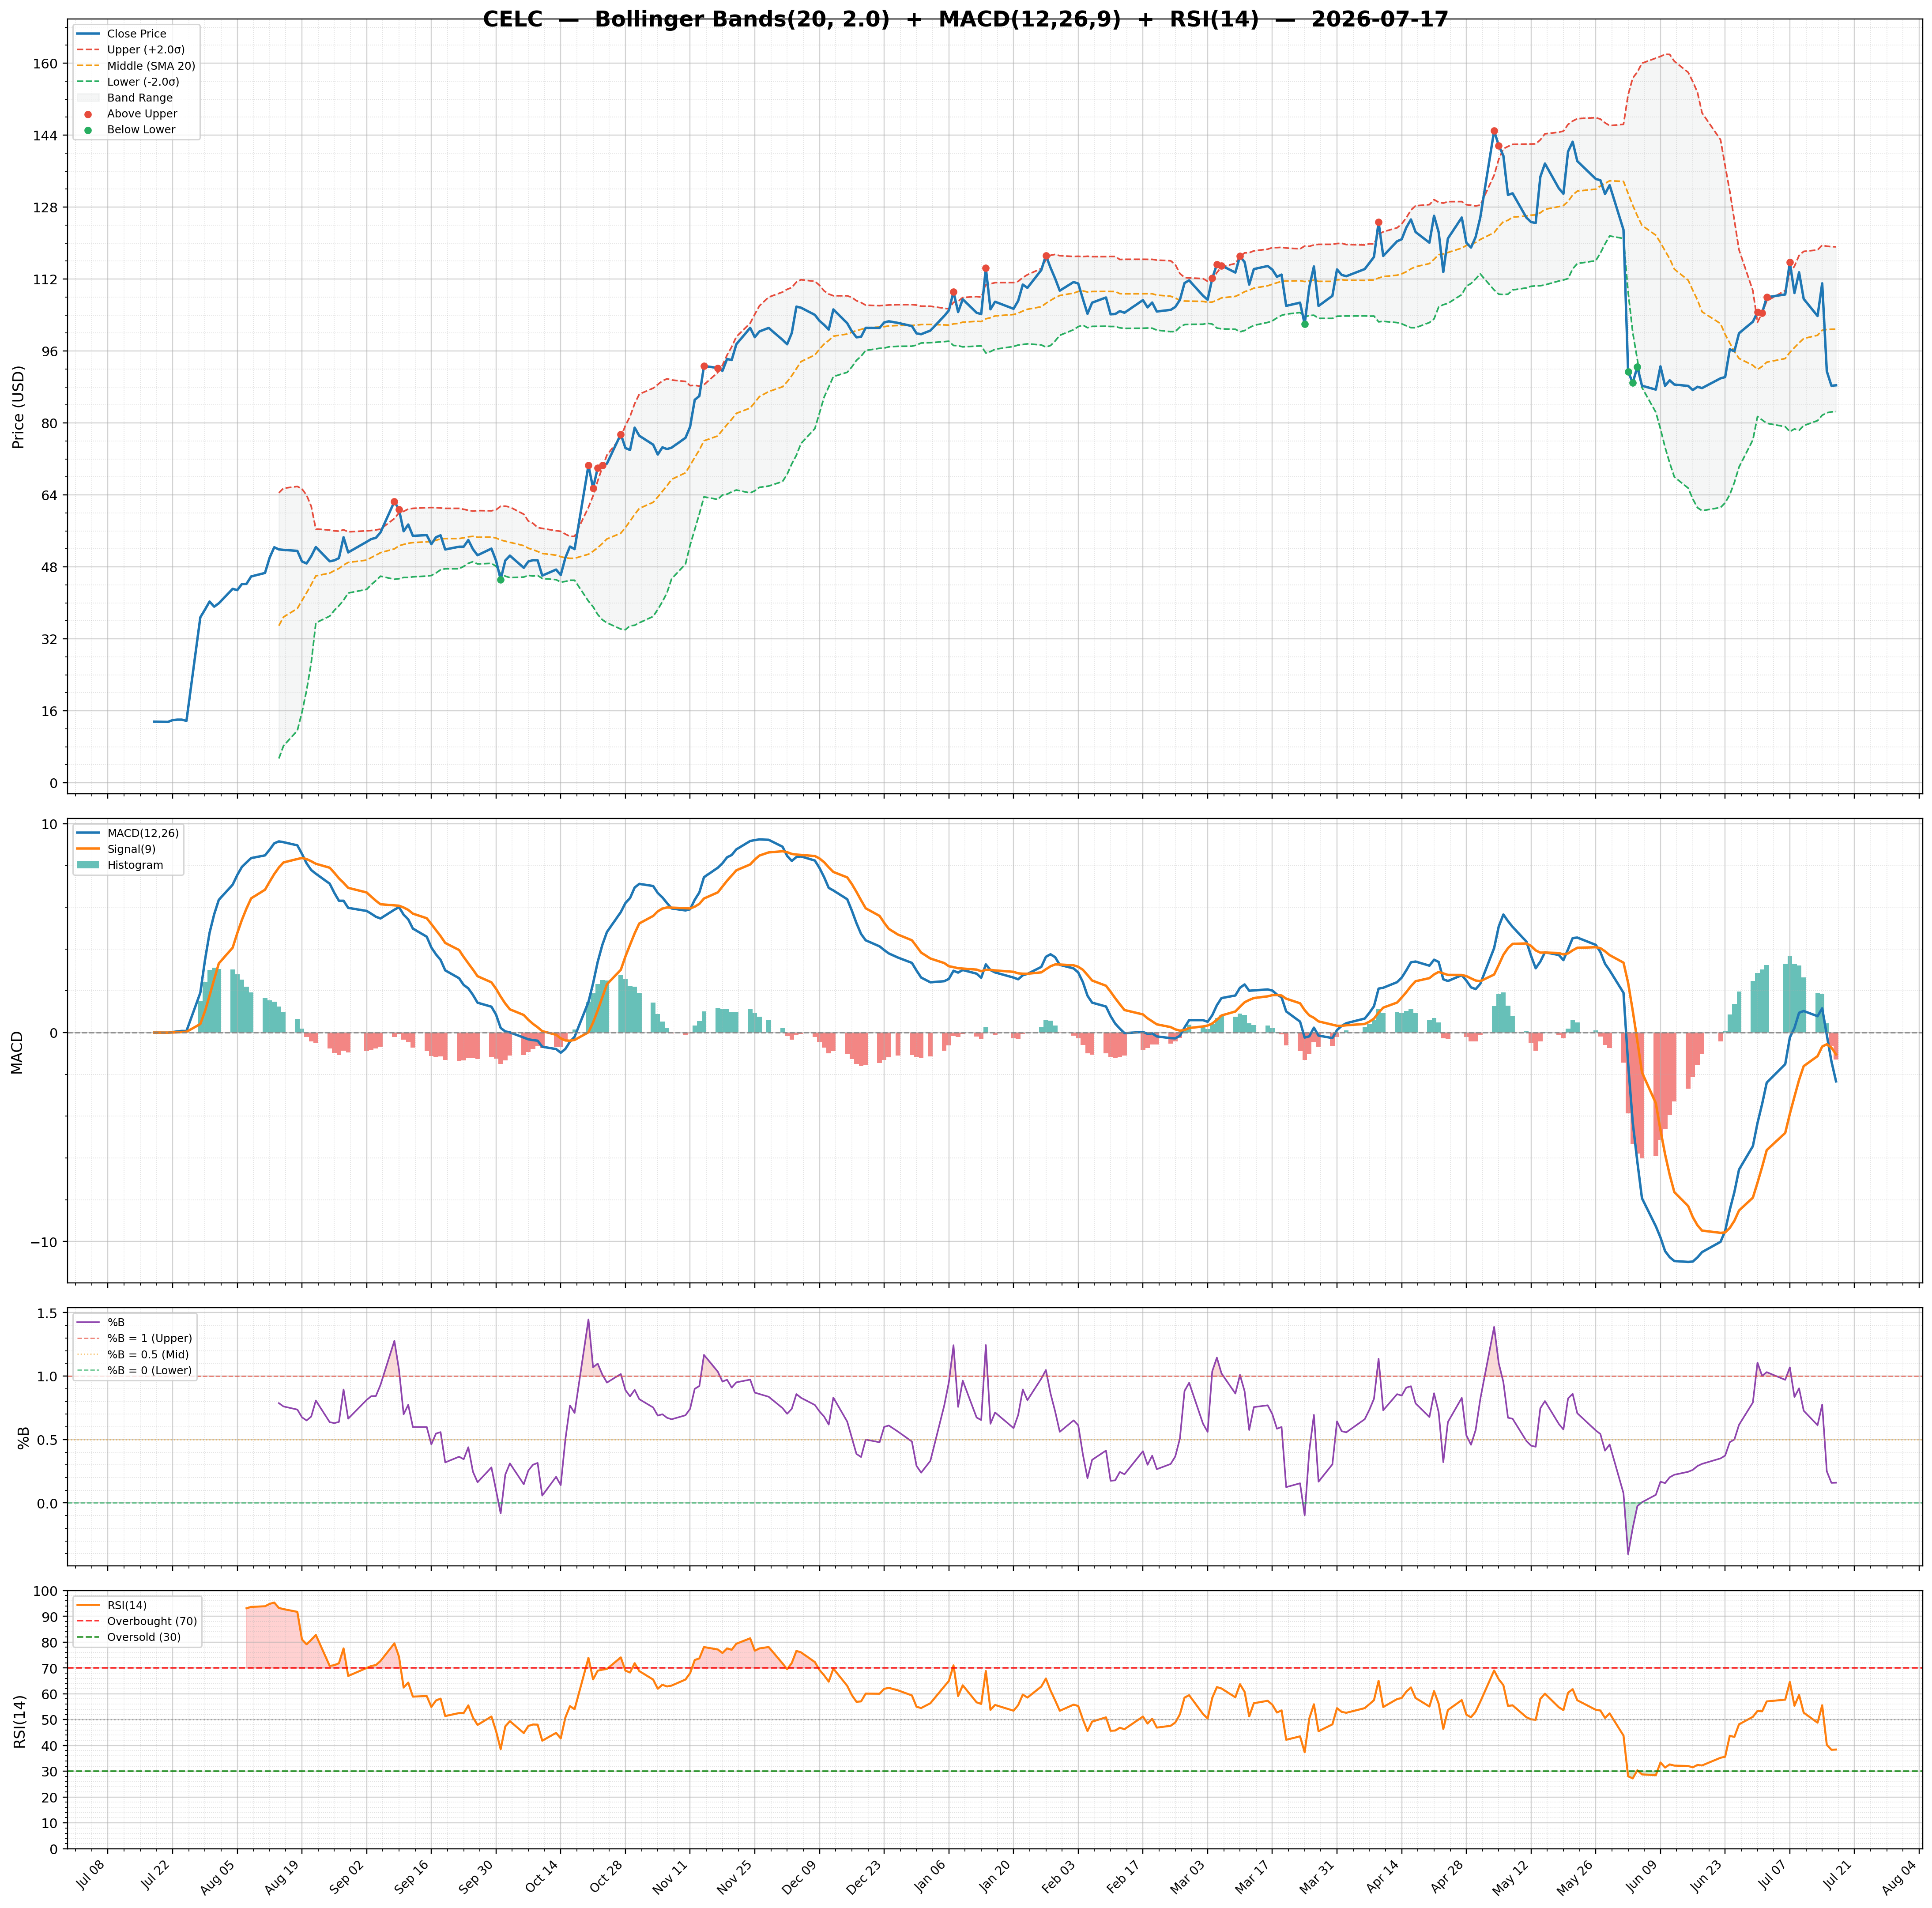
| 2026-07-17 | CELC | 88.38 | / | 56.94% | strong_buy | 1,305,505/1,782,075 | 36.33/0.16 | 38.40/-1.2900 | 1.12 | -2.34/-1.04 | Chart 3M 🌐 |
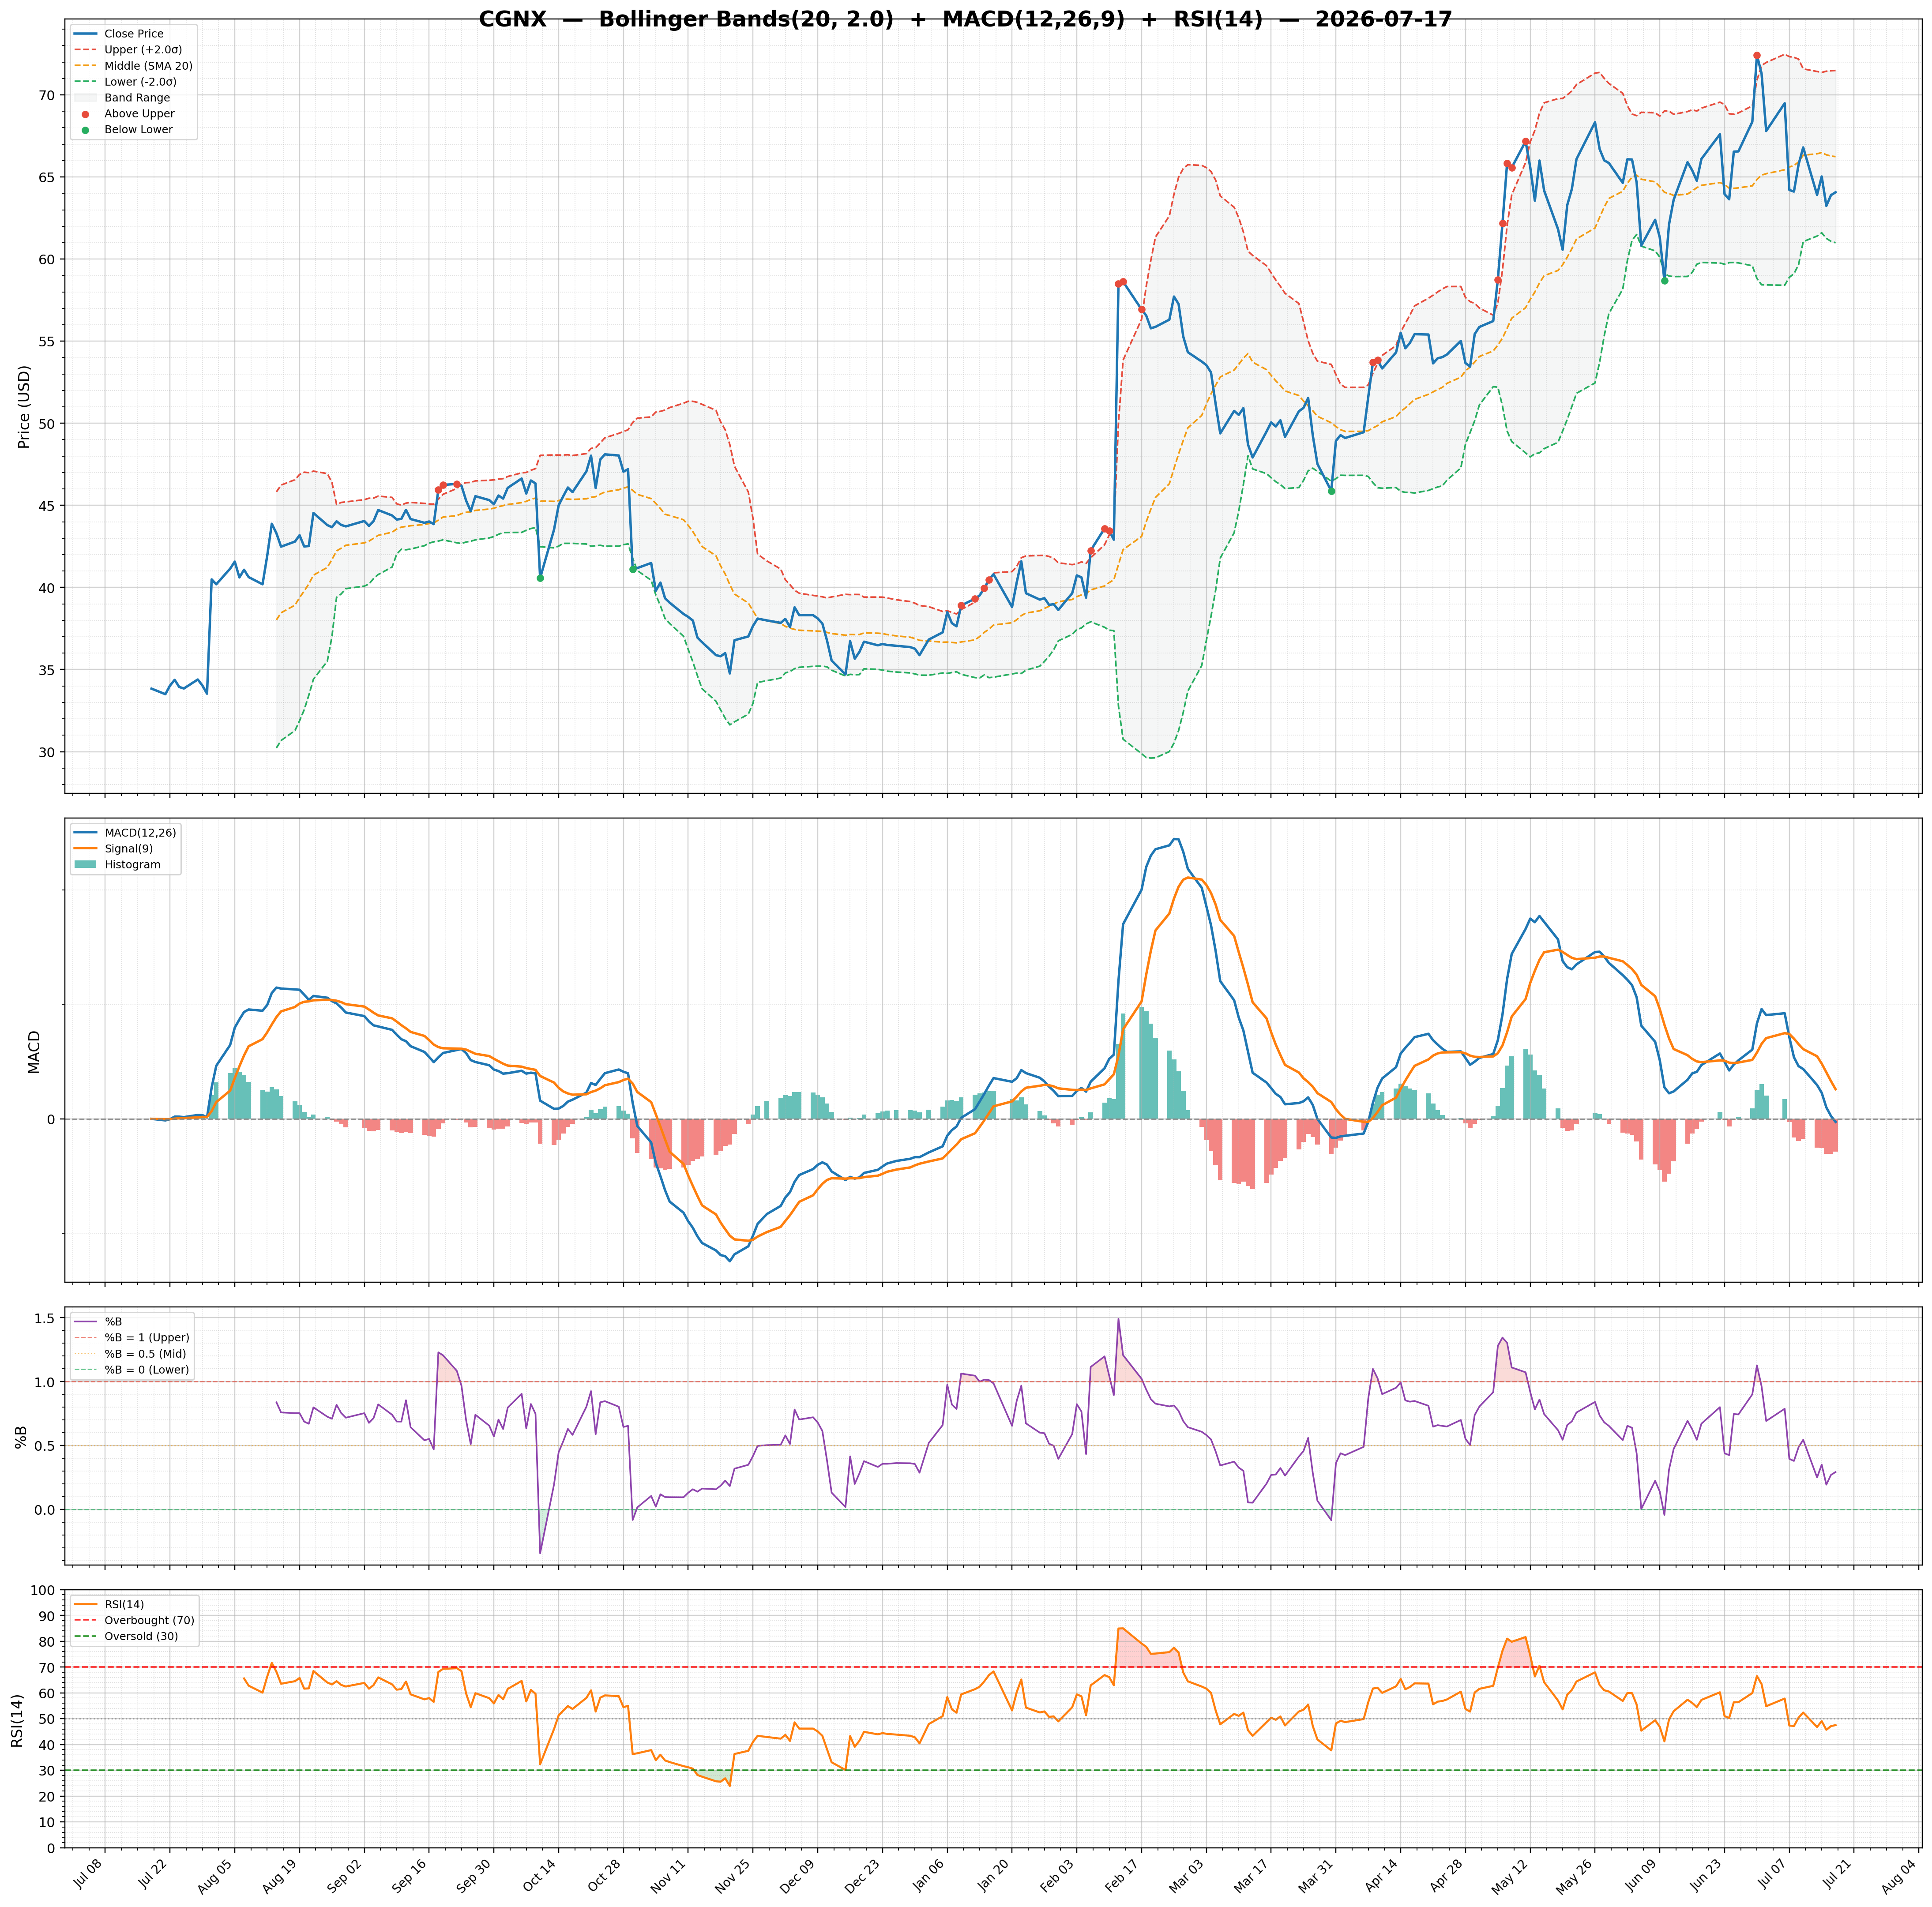
| 2026-07-17 | CGNX | 64.07 | / | 78.55% | buy | 1,189,405/2,488,130 | 15.84/0.29 | 47.52/-0.5700 | 0.45 | -0.05/0.52 | Chart 3M 🌐 |
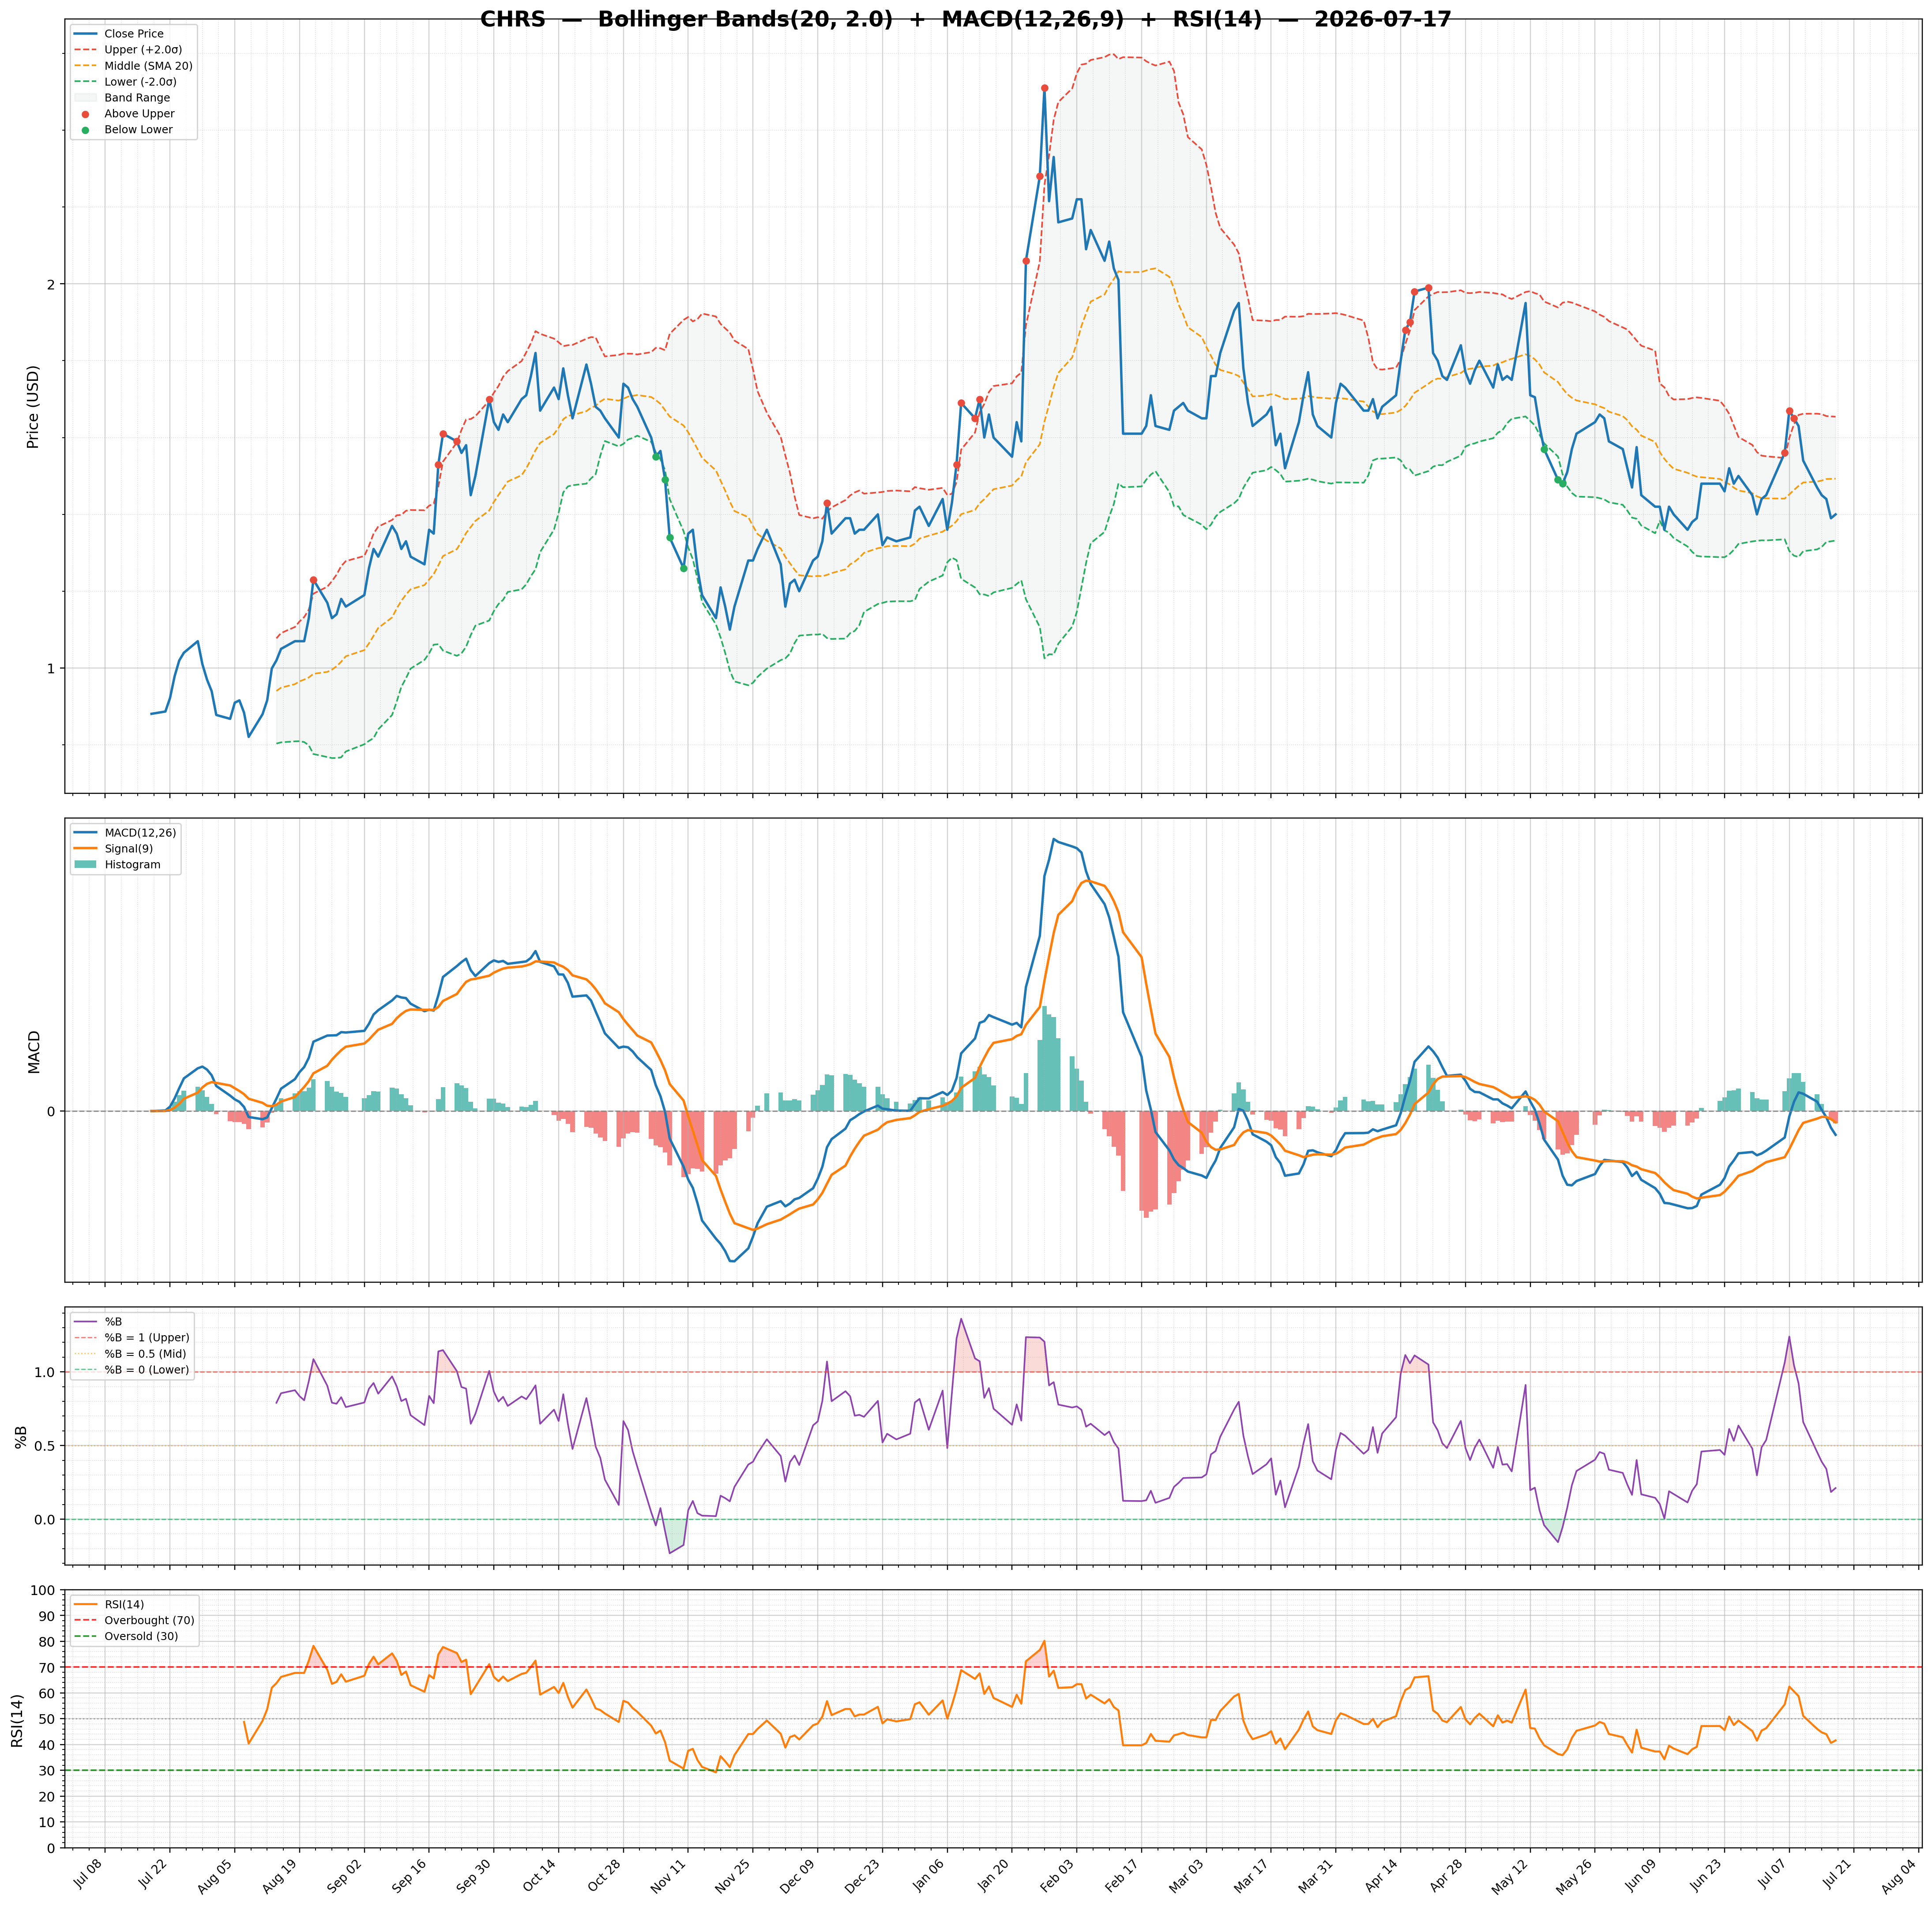
| 2026-07-17 | CHRS | 1.40 | / | 34.32% | none | 567,919/1,064,346 | 21.59/0.21 | 41.58/-0.0100 | -0.05 | -0.02/-0.01 | Chart 3M 🌐 |
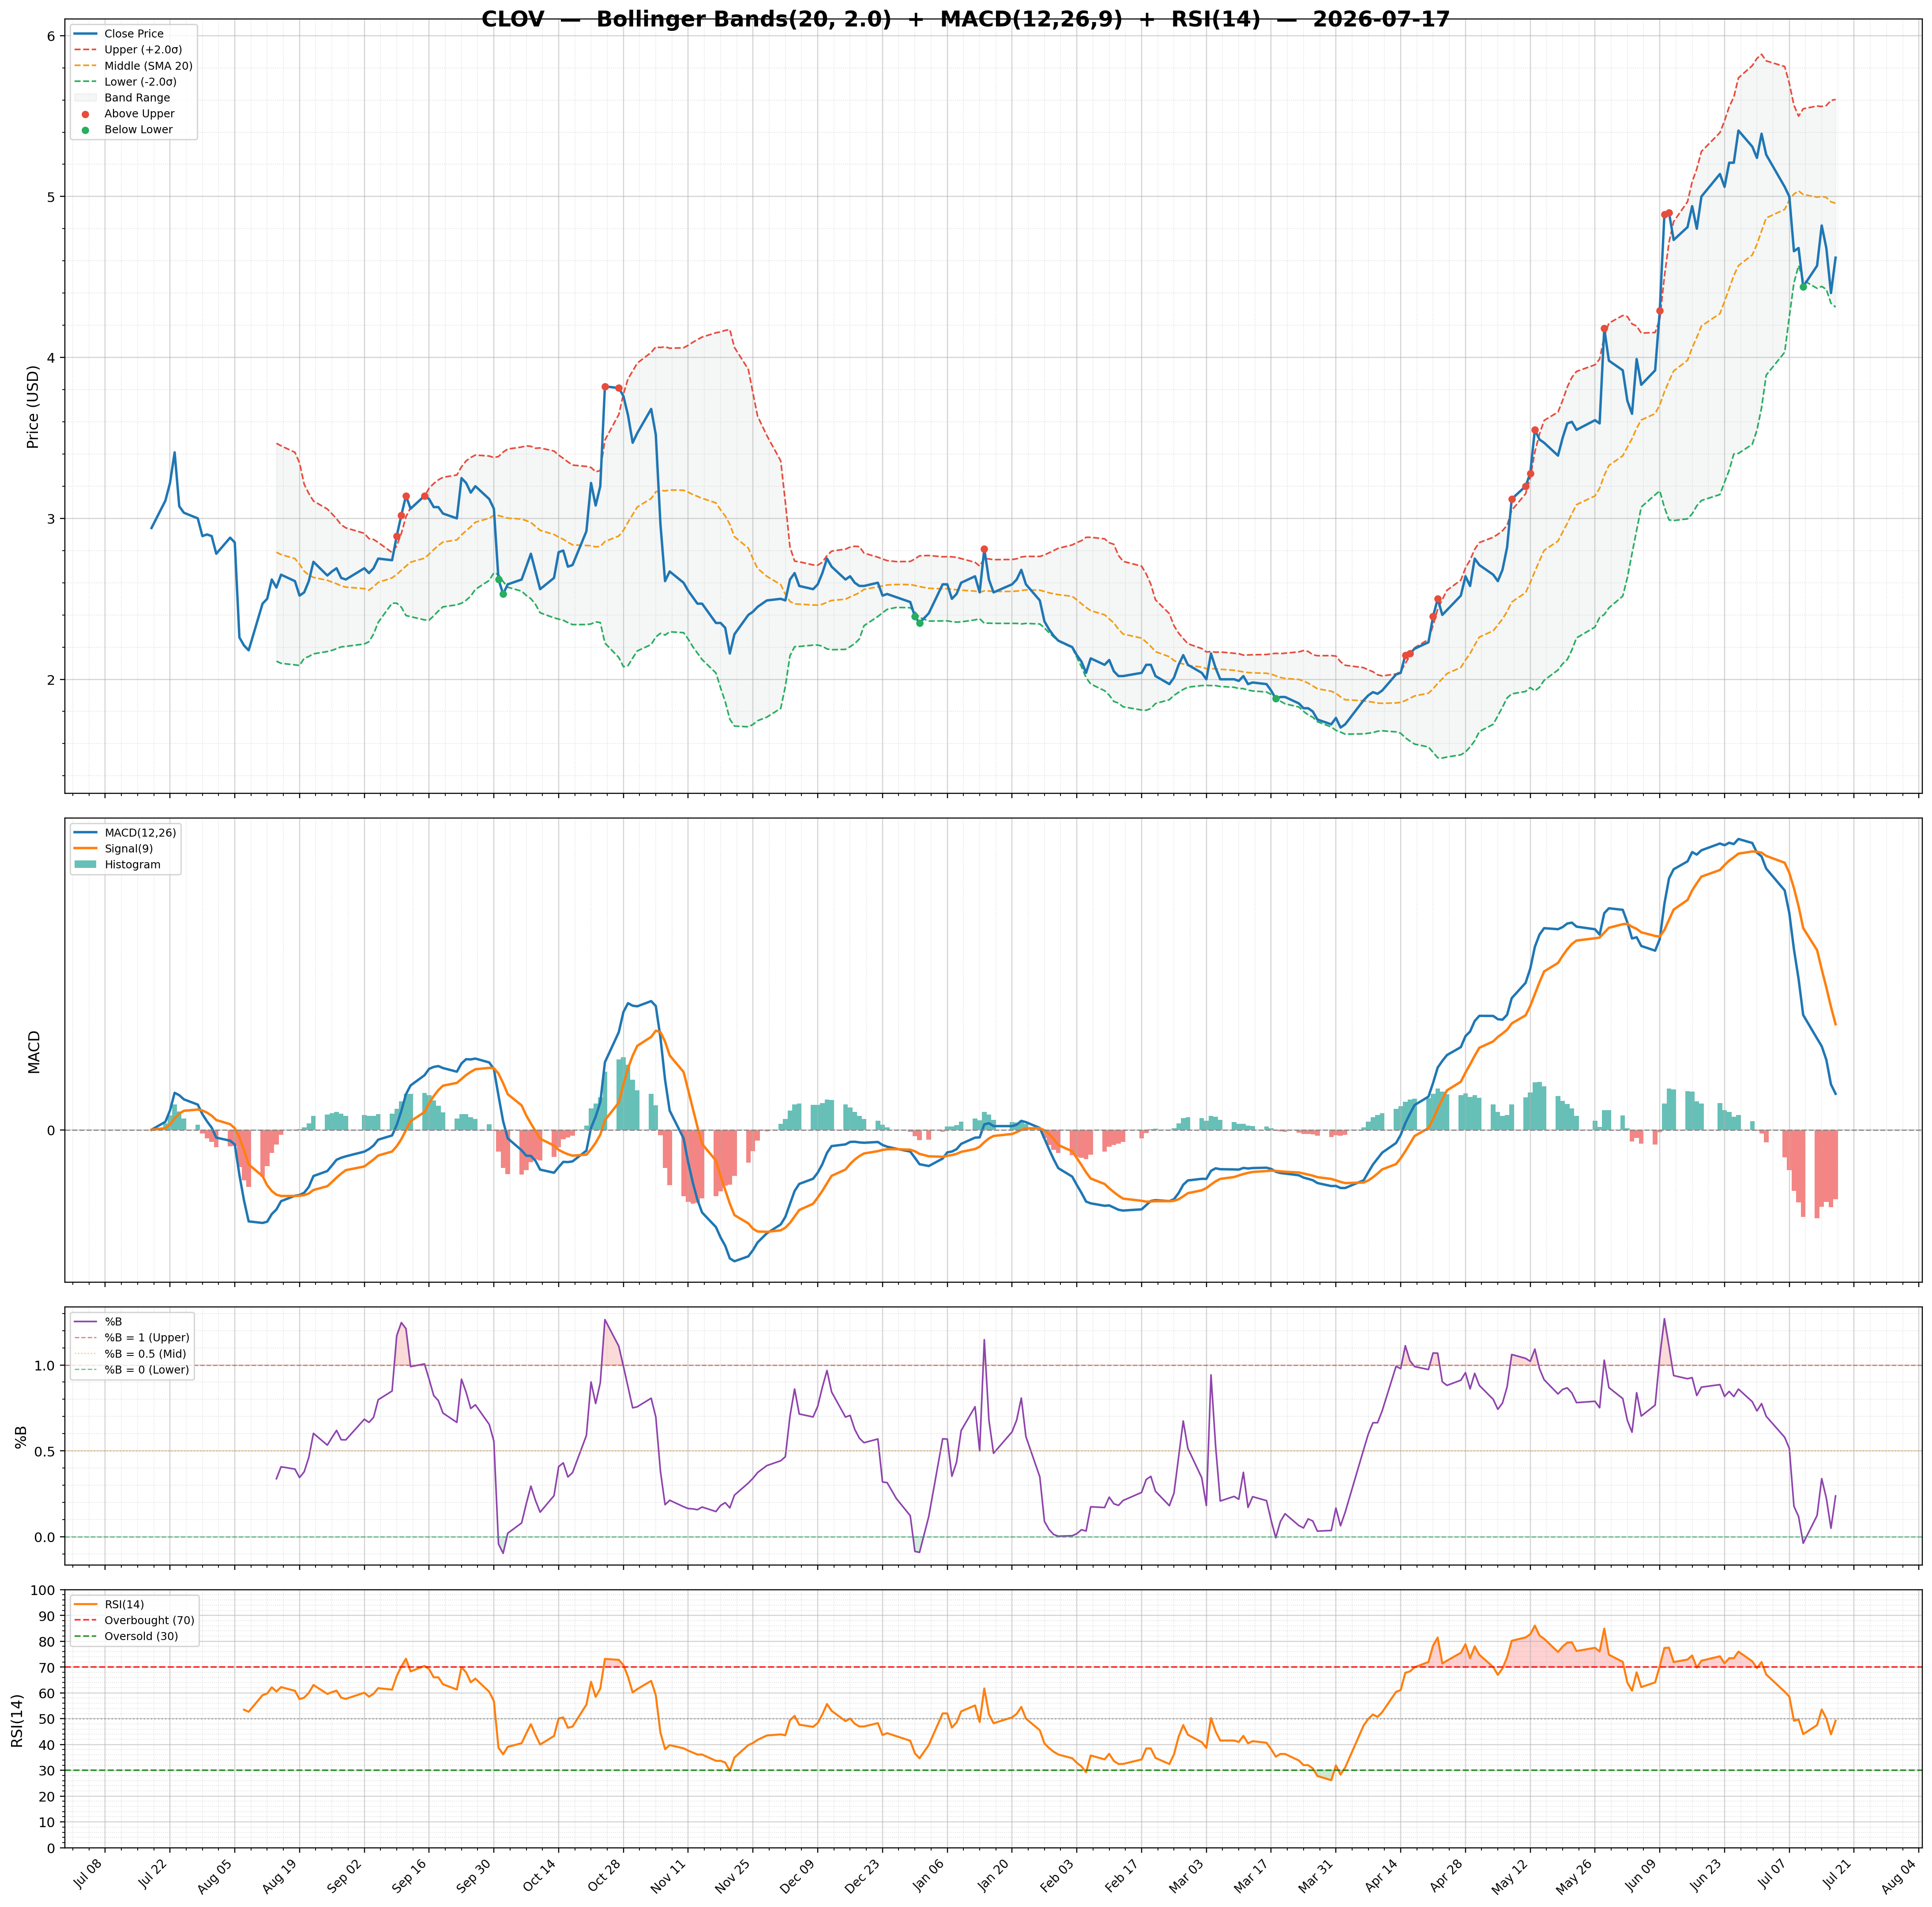
| 2026-07-17 | CLOV | 4.62 | / | 78.71% | none | 5,360,921/6,731,971 | 26.02/0.24 | 49.21/-0.1200 | 0.81 | 0.06/0.18 | Chart 3M 🌐 |
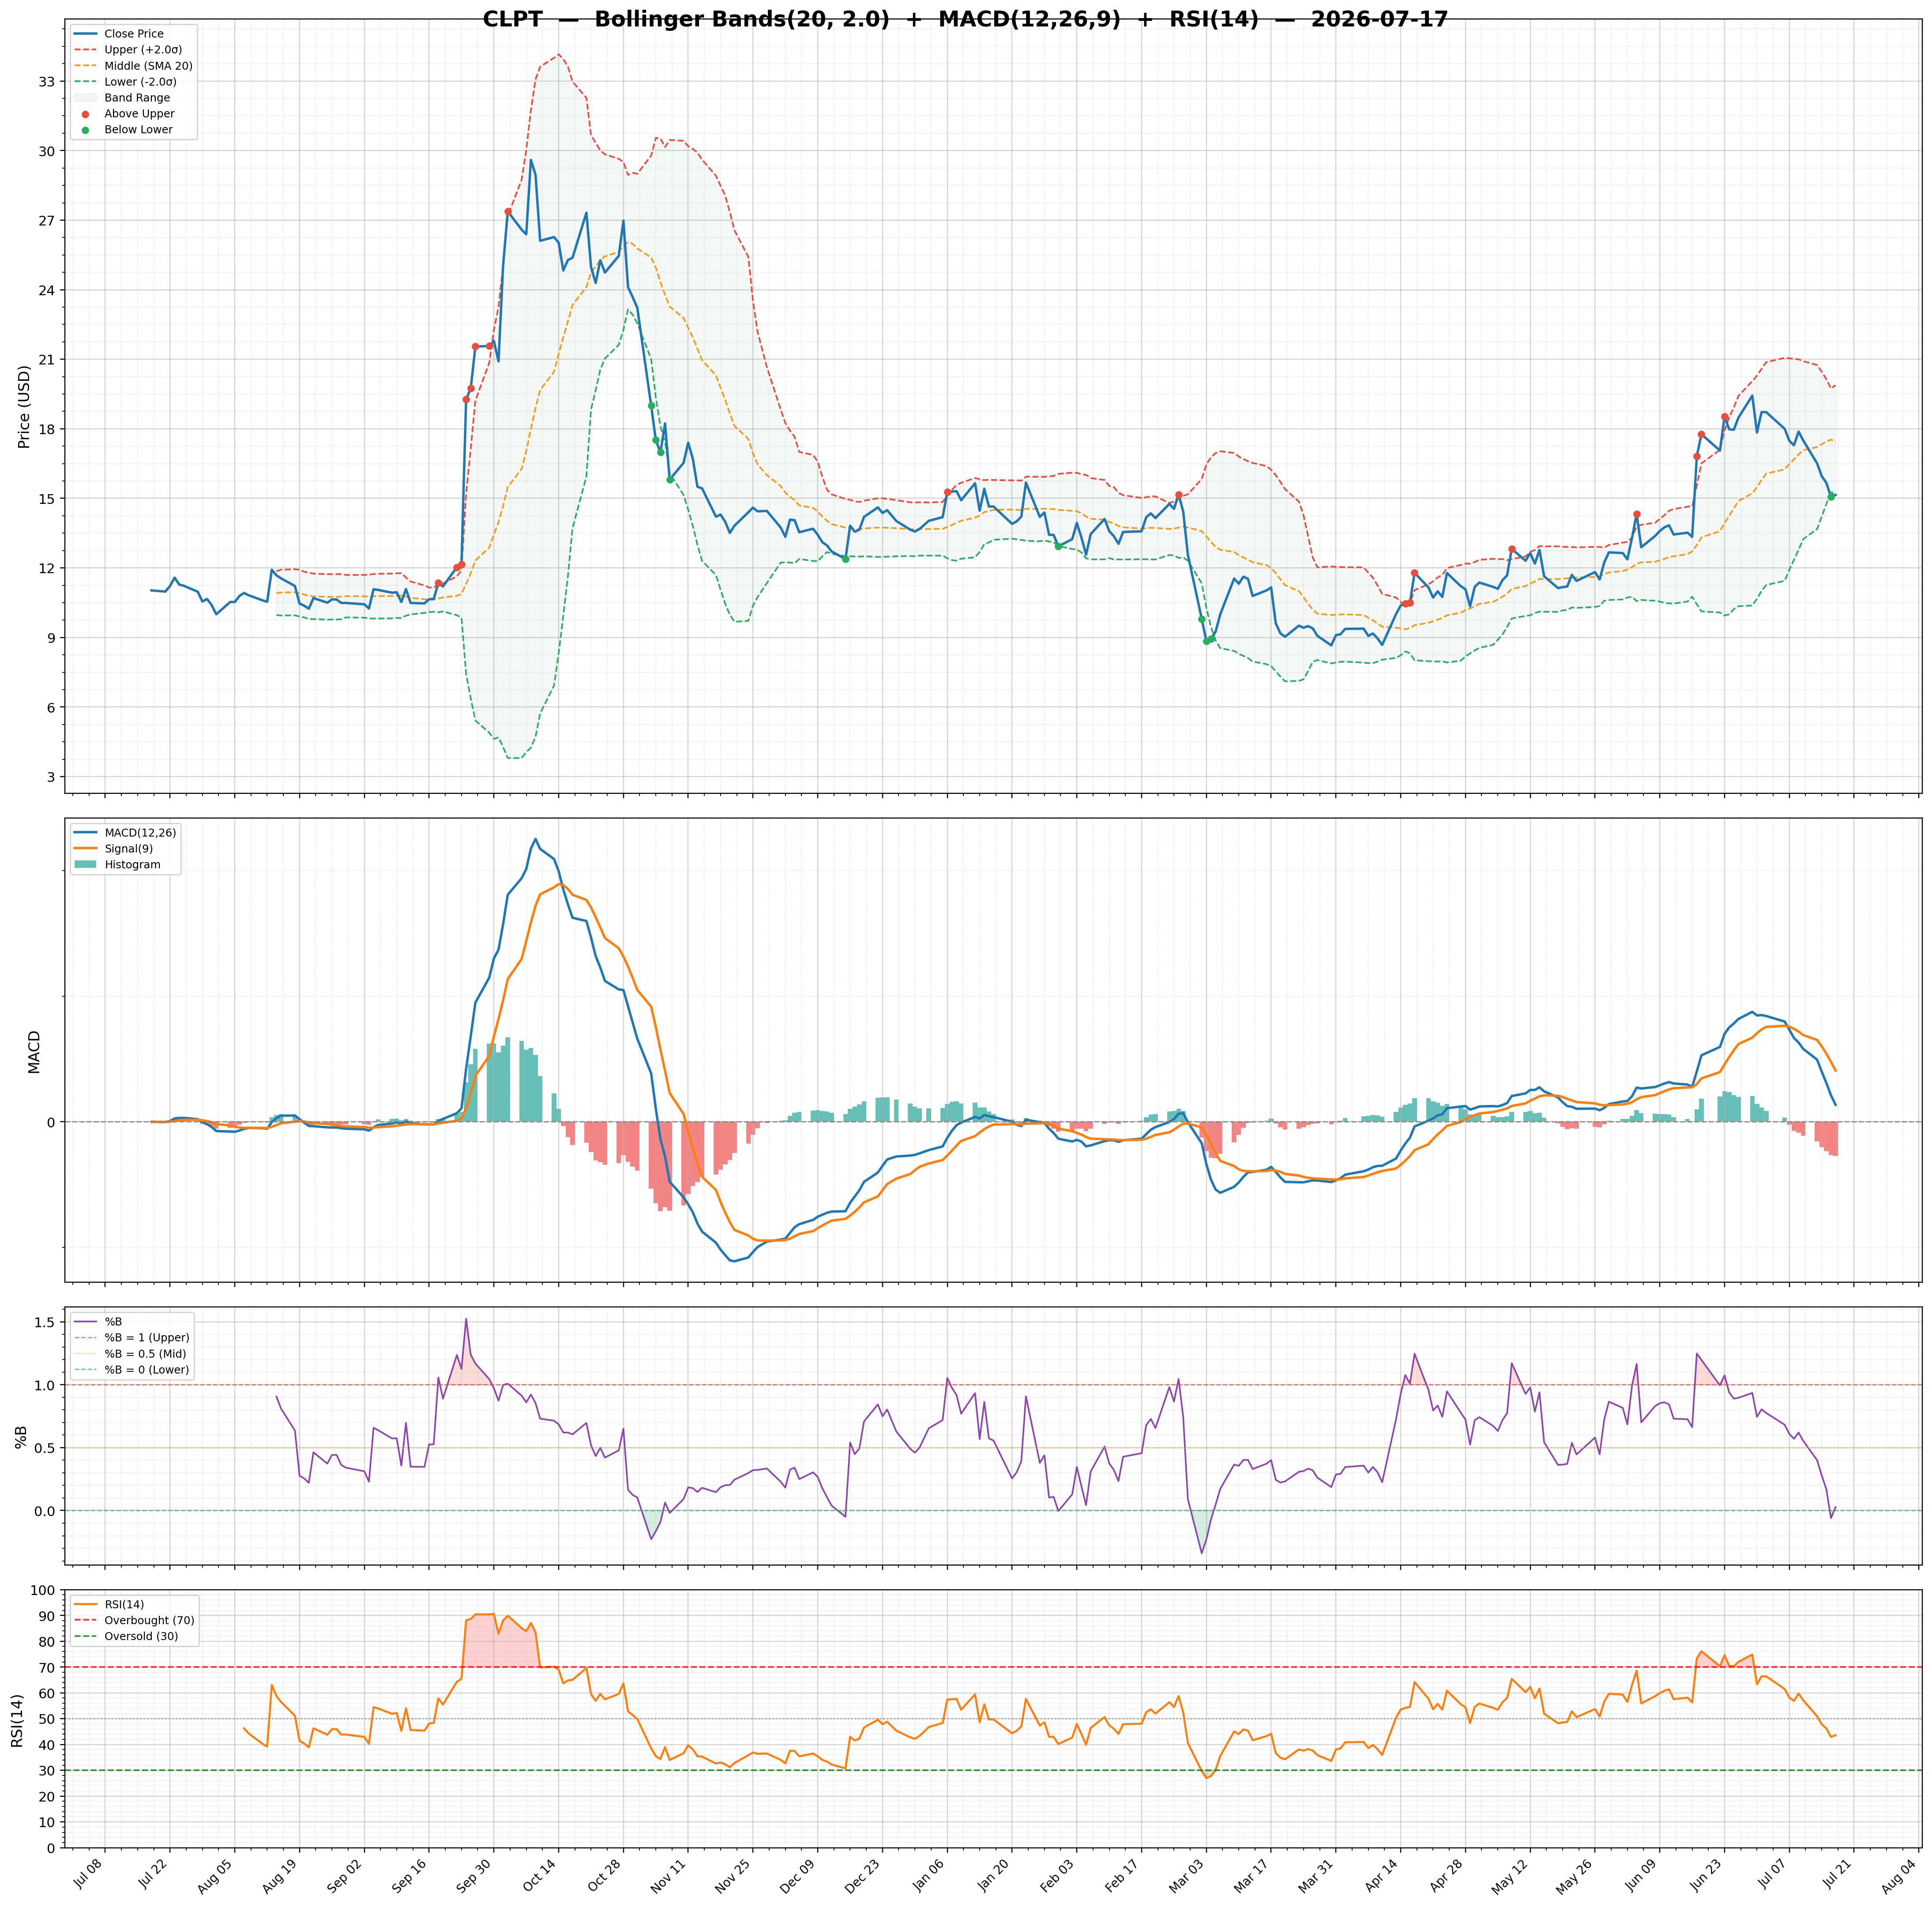
| 2026-07-17 | CLPT | 15.15 | / | 30.99% | none | 560,237/743,592 | 27.88/0.03 | 43.60/-0.5500 | 0.17 | 0.27/0.82 | Chart 3M 🌐 |
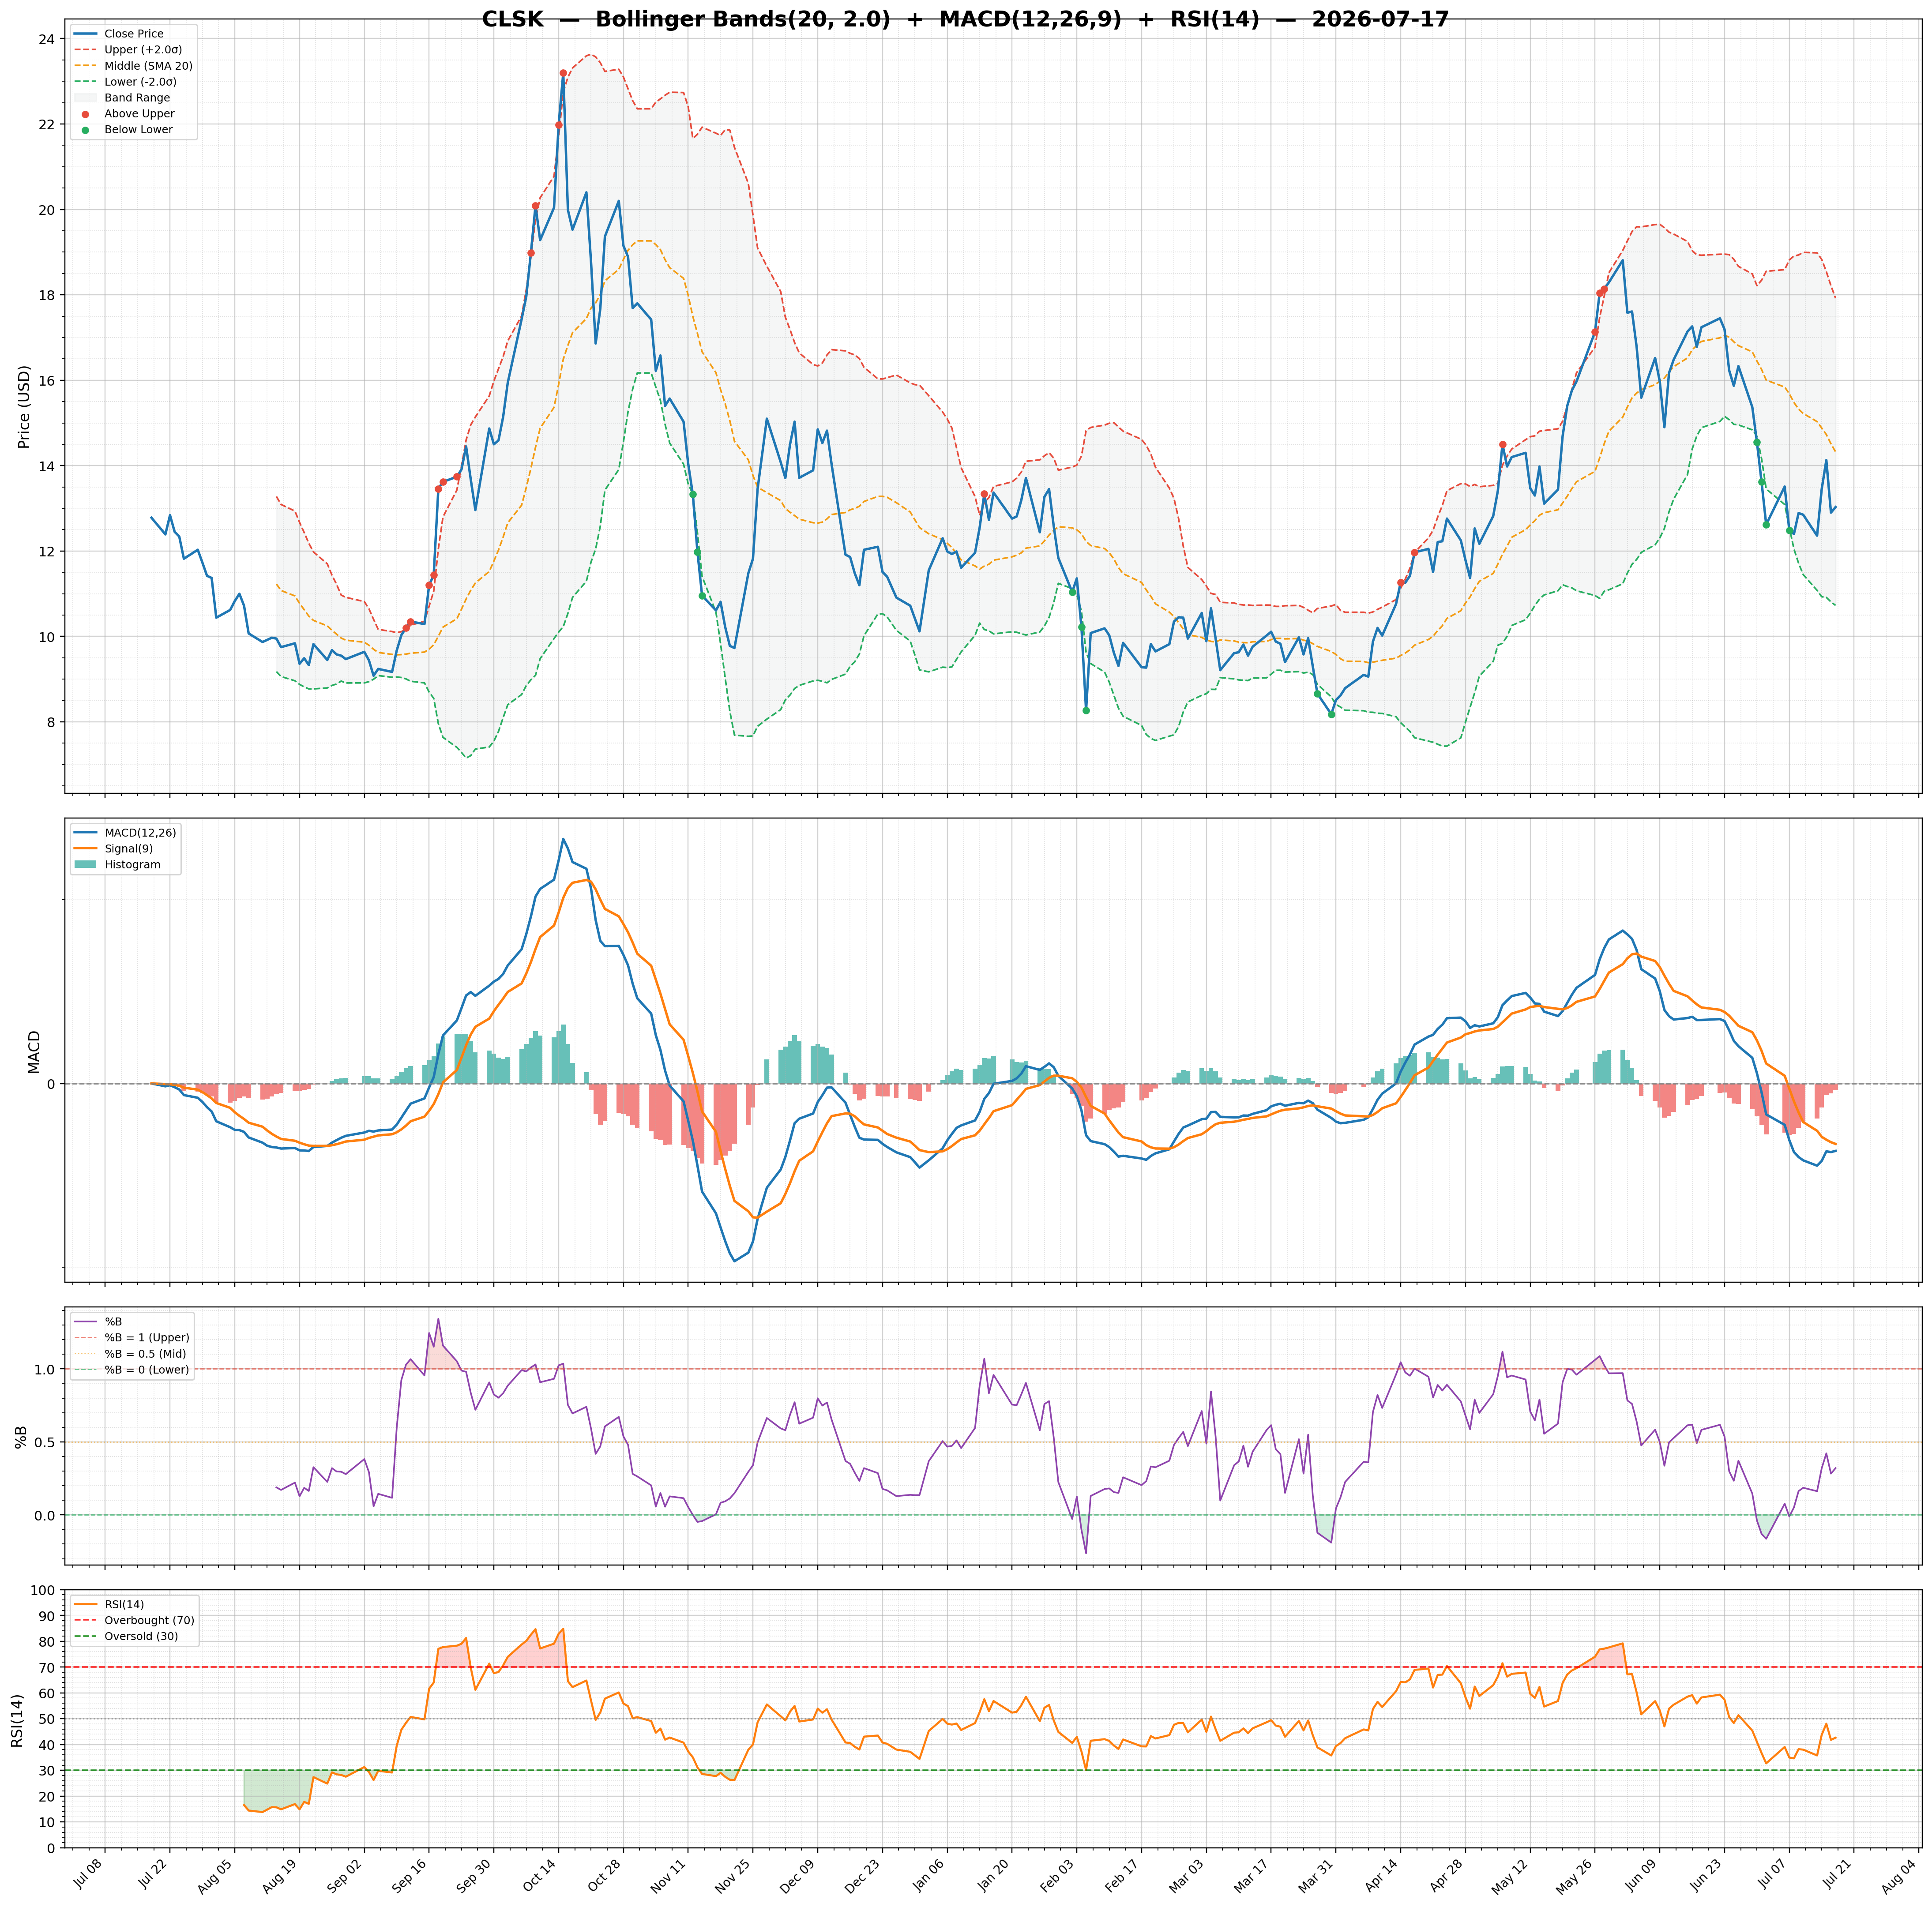
| 2026-07-17 | CLSK | 13.03 | / | 32.29% | strong_buy | 21,851,577/22,889,269 | 50.22/0.32 | 42.65/-0.0800 | -0.02 | -0.73/-0.66 | Chart 3M 🌐 |
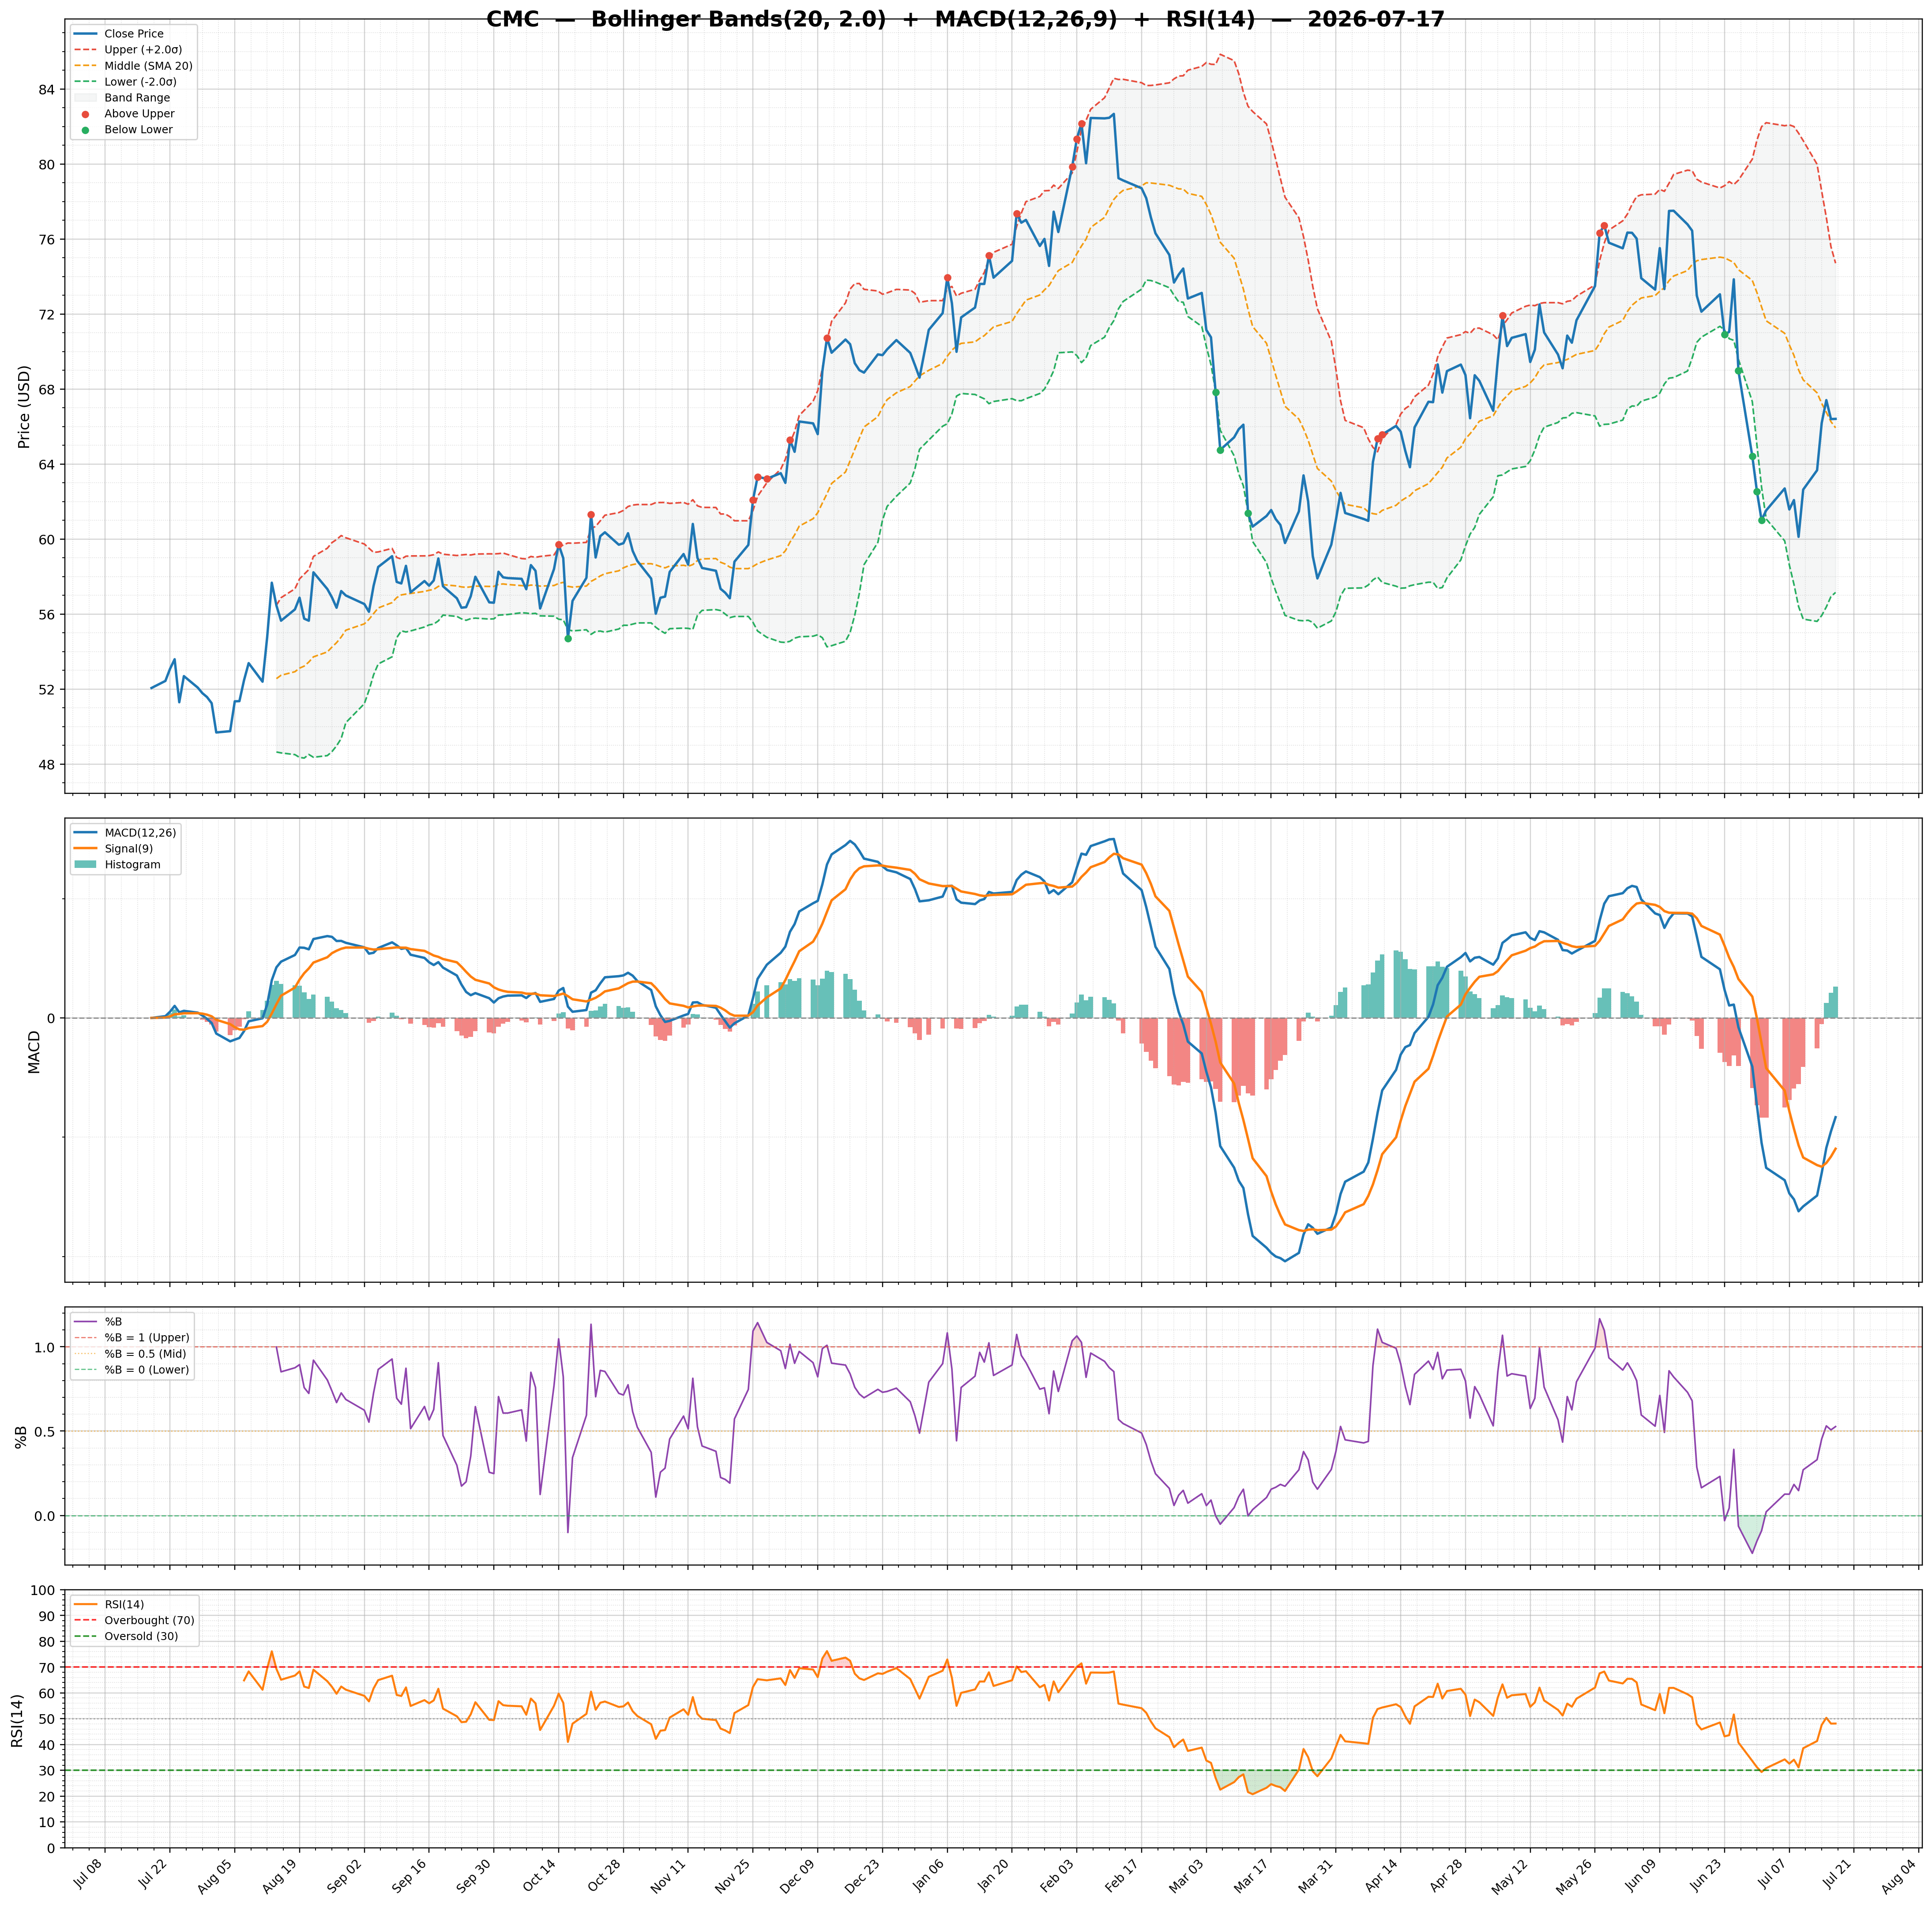
| 2026-07-17 | CMC | 66.41 | / | 50.70% | buy | 1,016,667/1,678,998 | 26.63/0.53 | 48.12/0.5300 | 0.07 | -1.66/-2.19 | Chart 3M 🌐 |
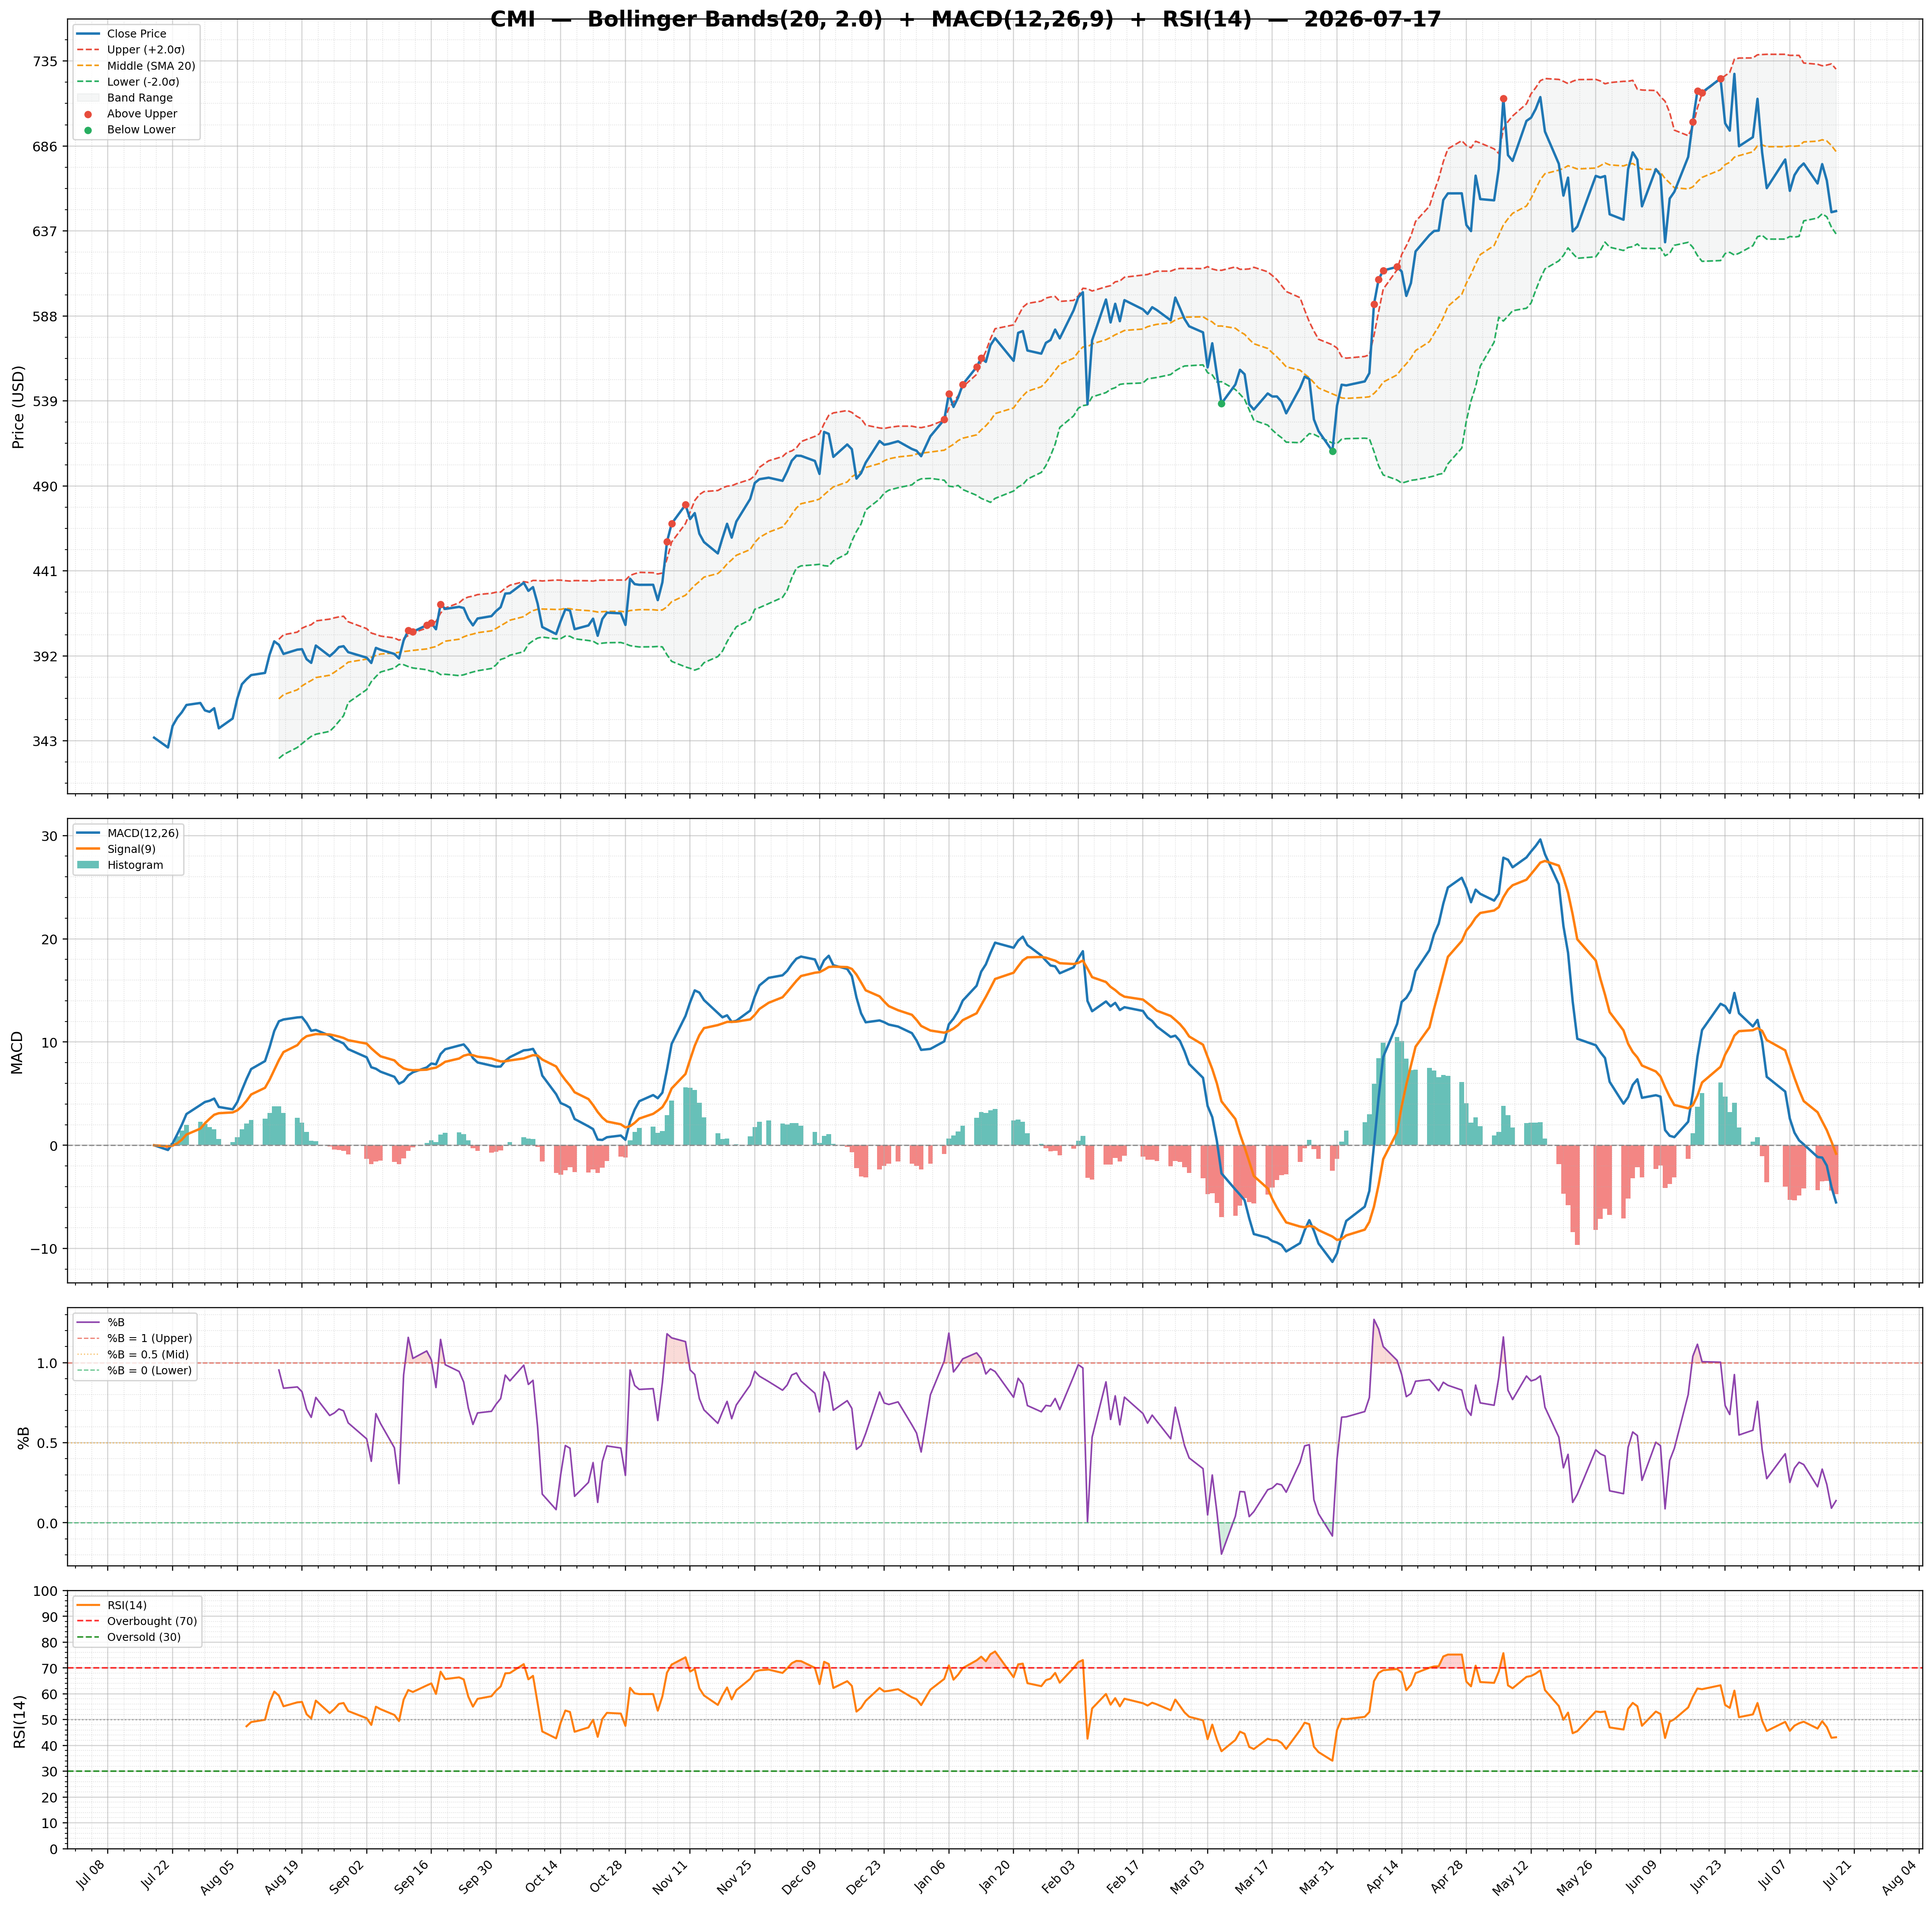
| 2026-07-17 | CMI | 648.48 | / | 79.63% | buy | 842,619/1,083,861 | 13.92/0.14 | 43.15/-4.7200 | 0.36 | -5.53/-0.81 | Chart 3M 🌐 |
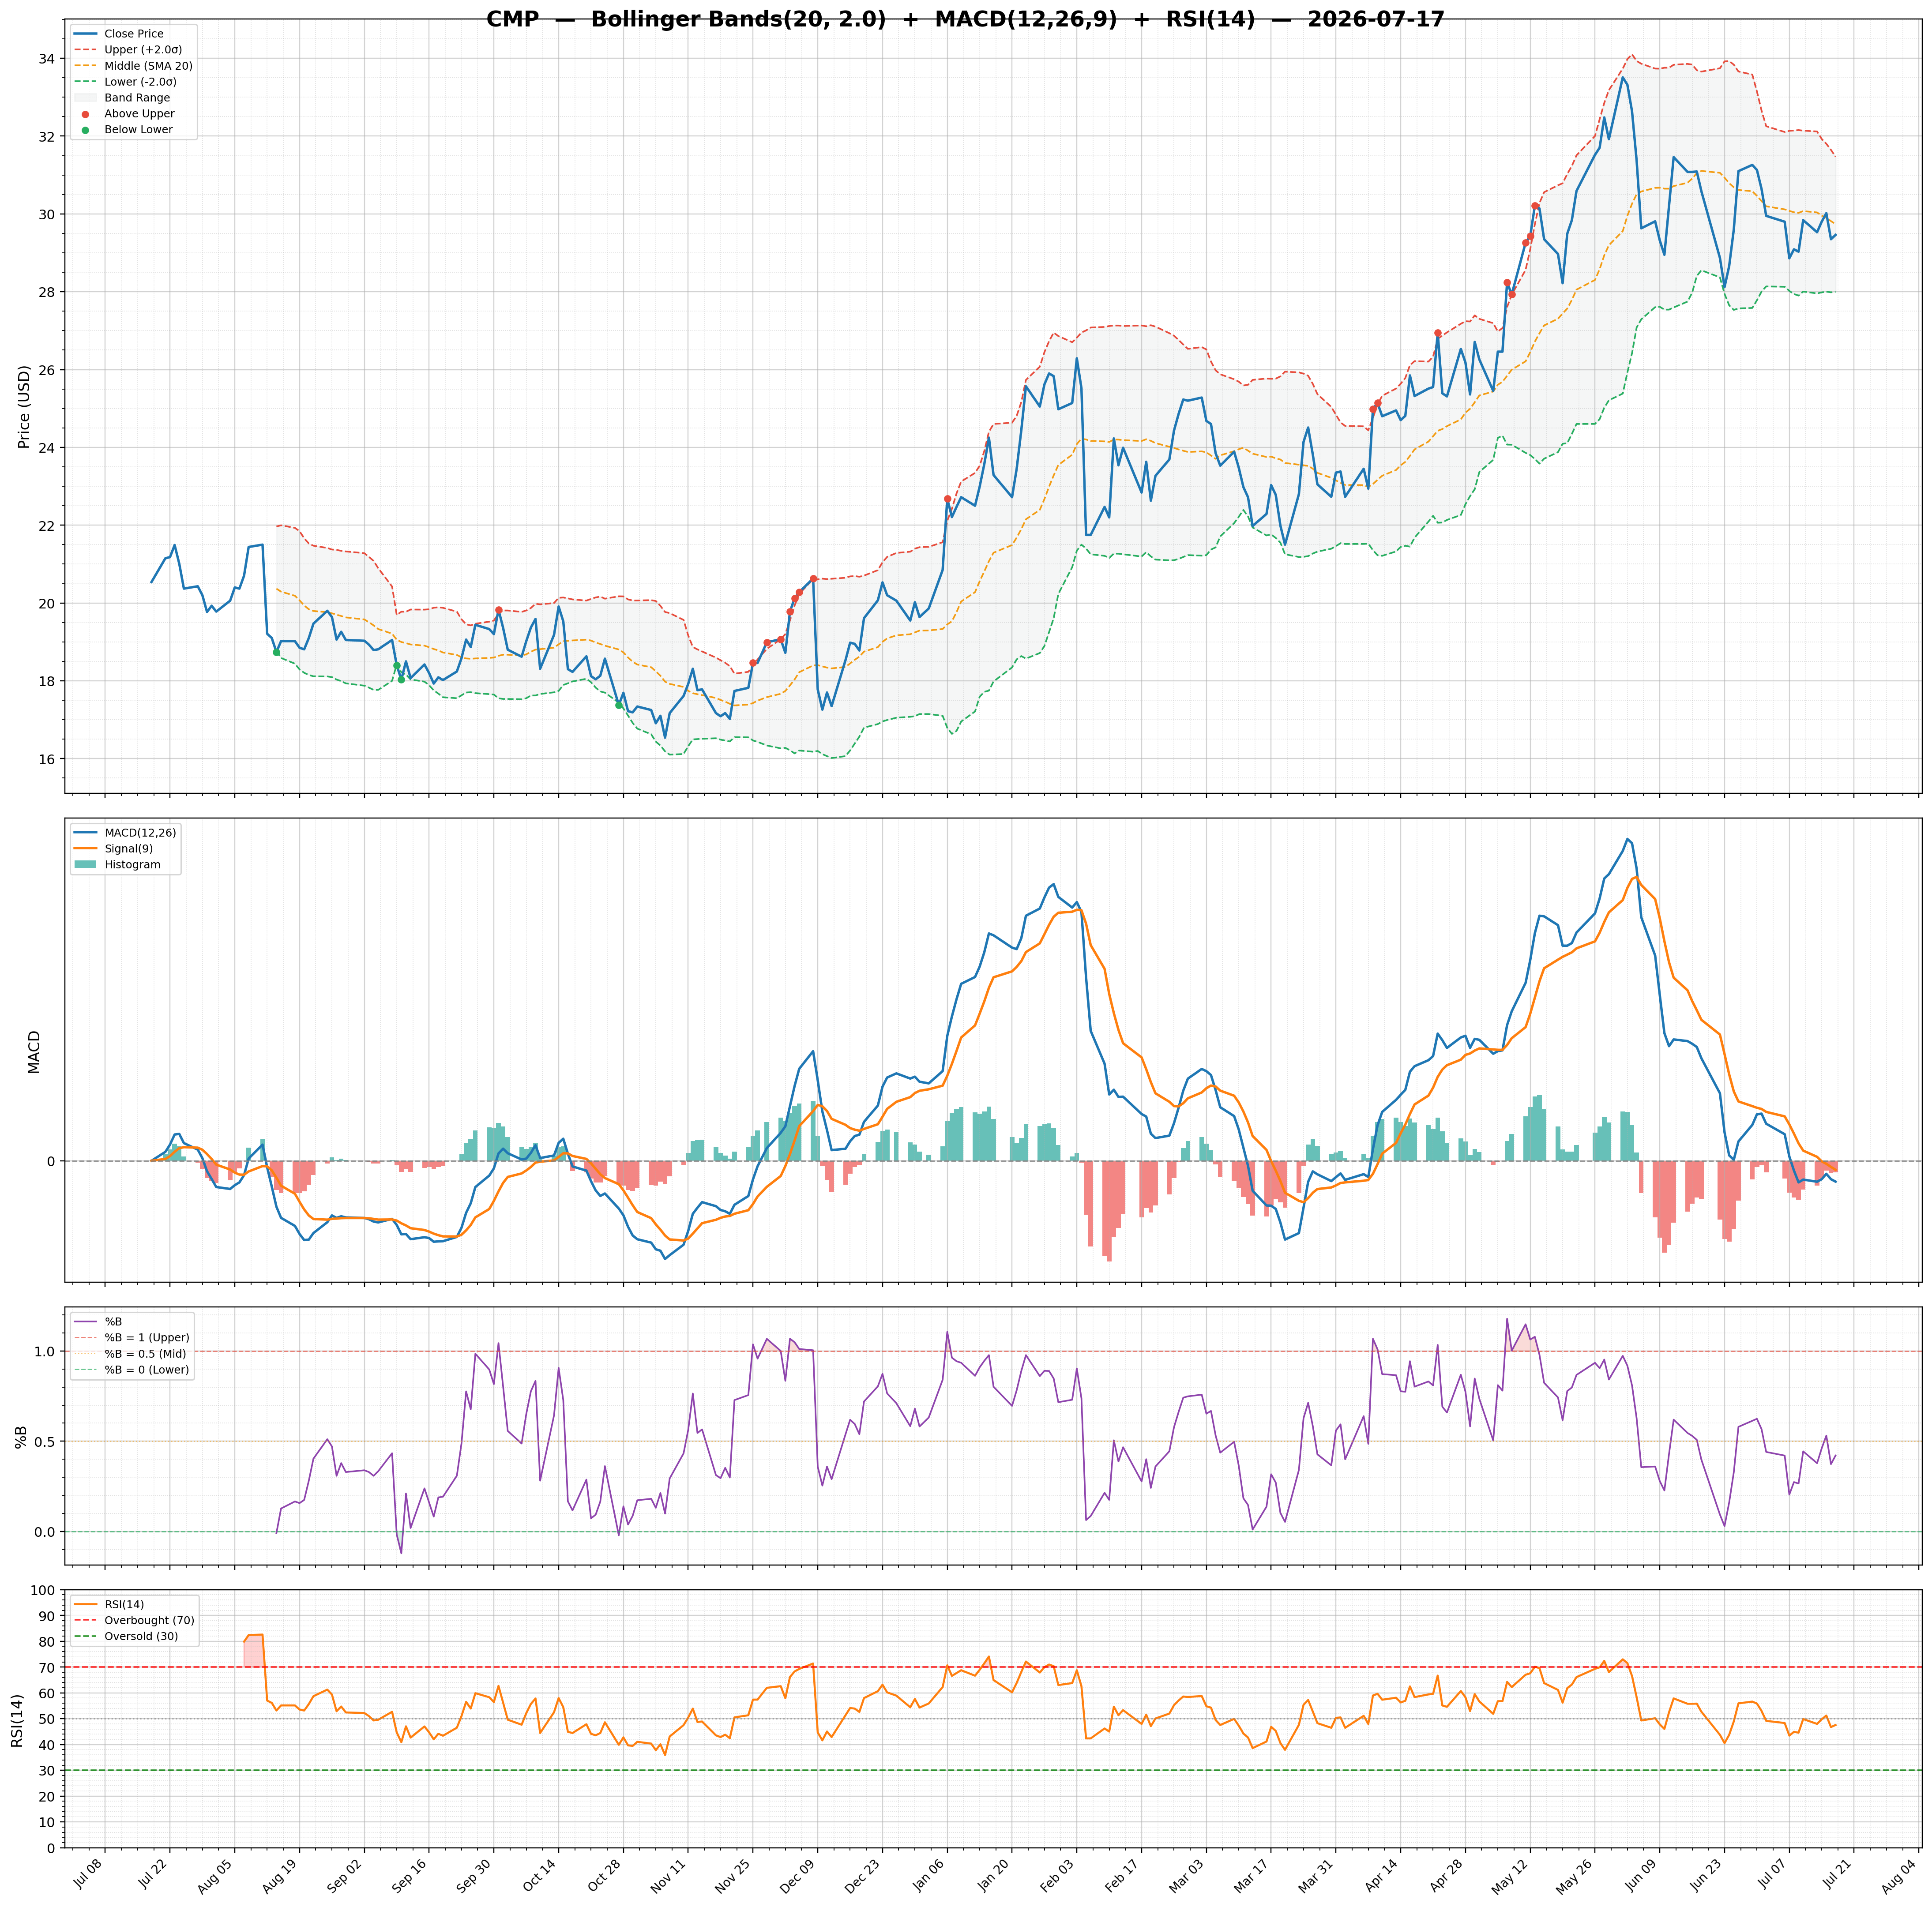
| 2026-07-17 | CMP | 29.46 | / | 76.13% | none | 240,323/440,106 | 11.67/0.42 | 47.56/-0.0600 | 0.28 | -0.11/-0.05 | Chart 3M 🌐 |
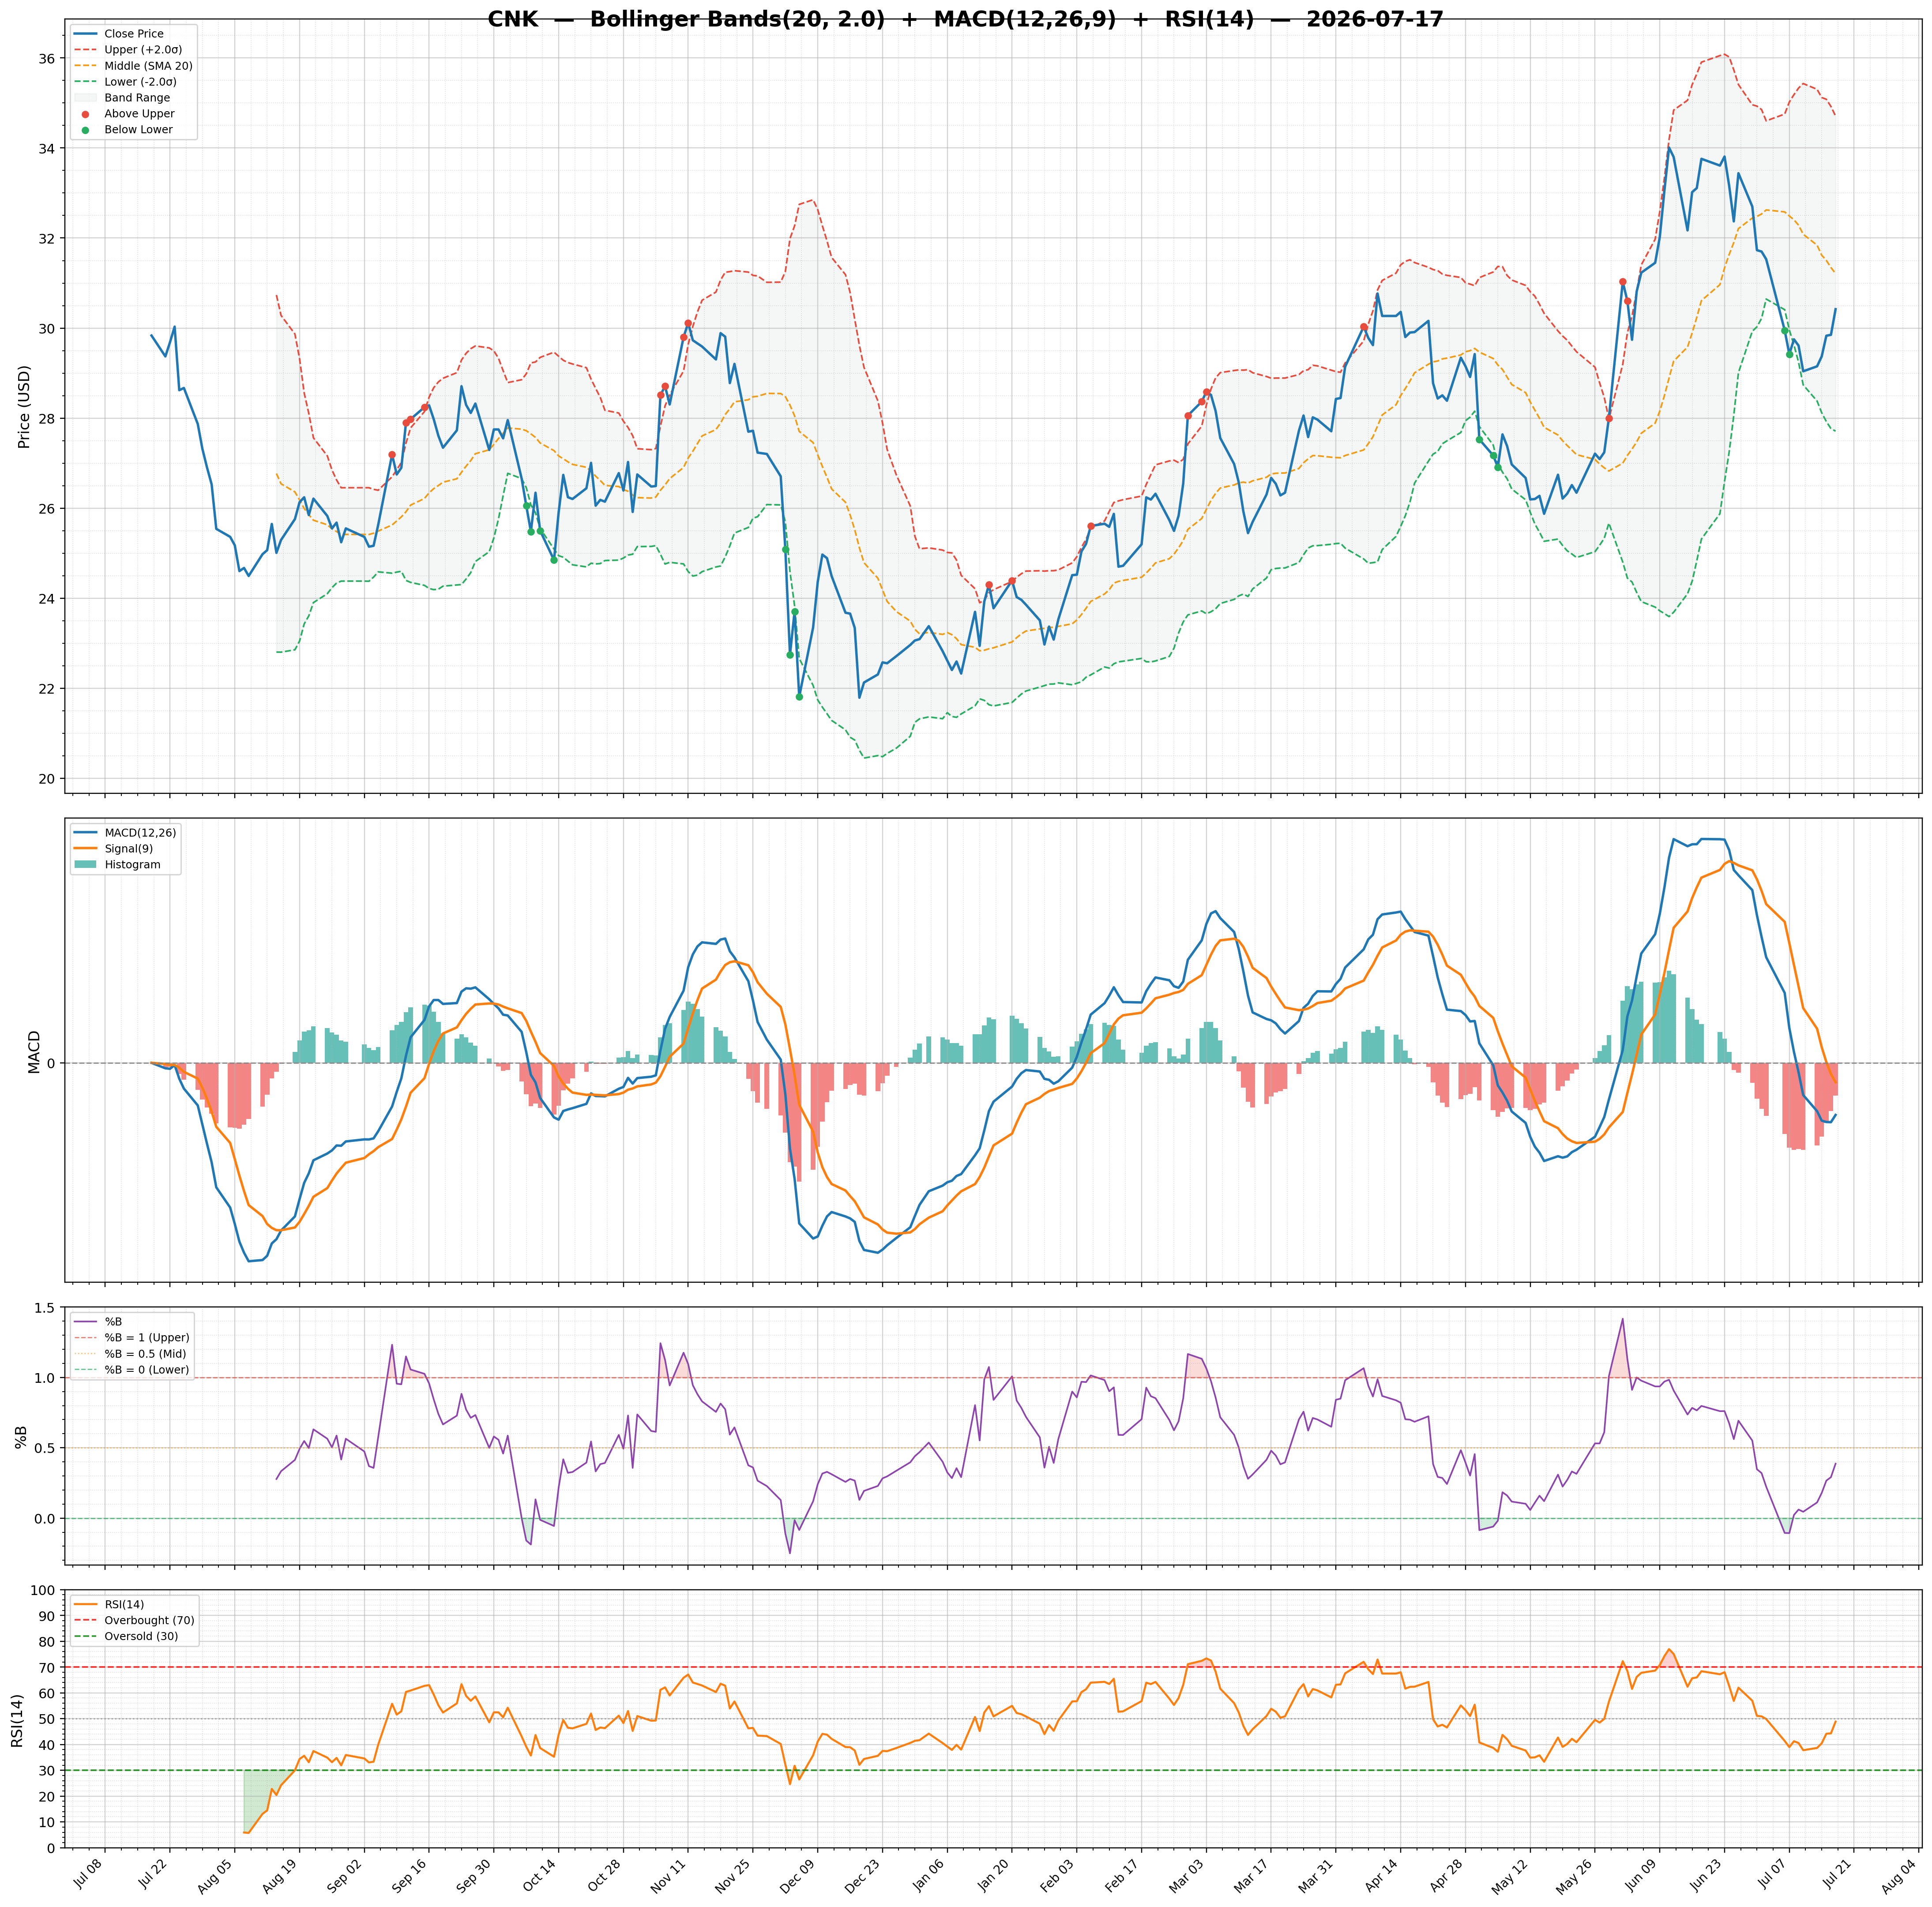
| 2026-07-17 | CNK | 30.42 | / | 70.62% | buy | 2,448,529/2,362,381 | 22.43/0.39 | 48.87/-0.2200 | 0.10 | -0.35/-0.13 | Chart 3M 🌐 |
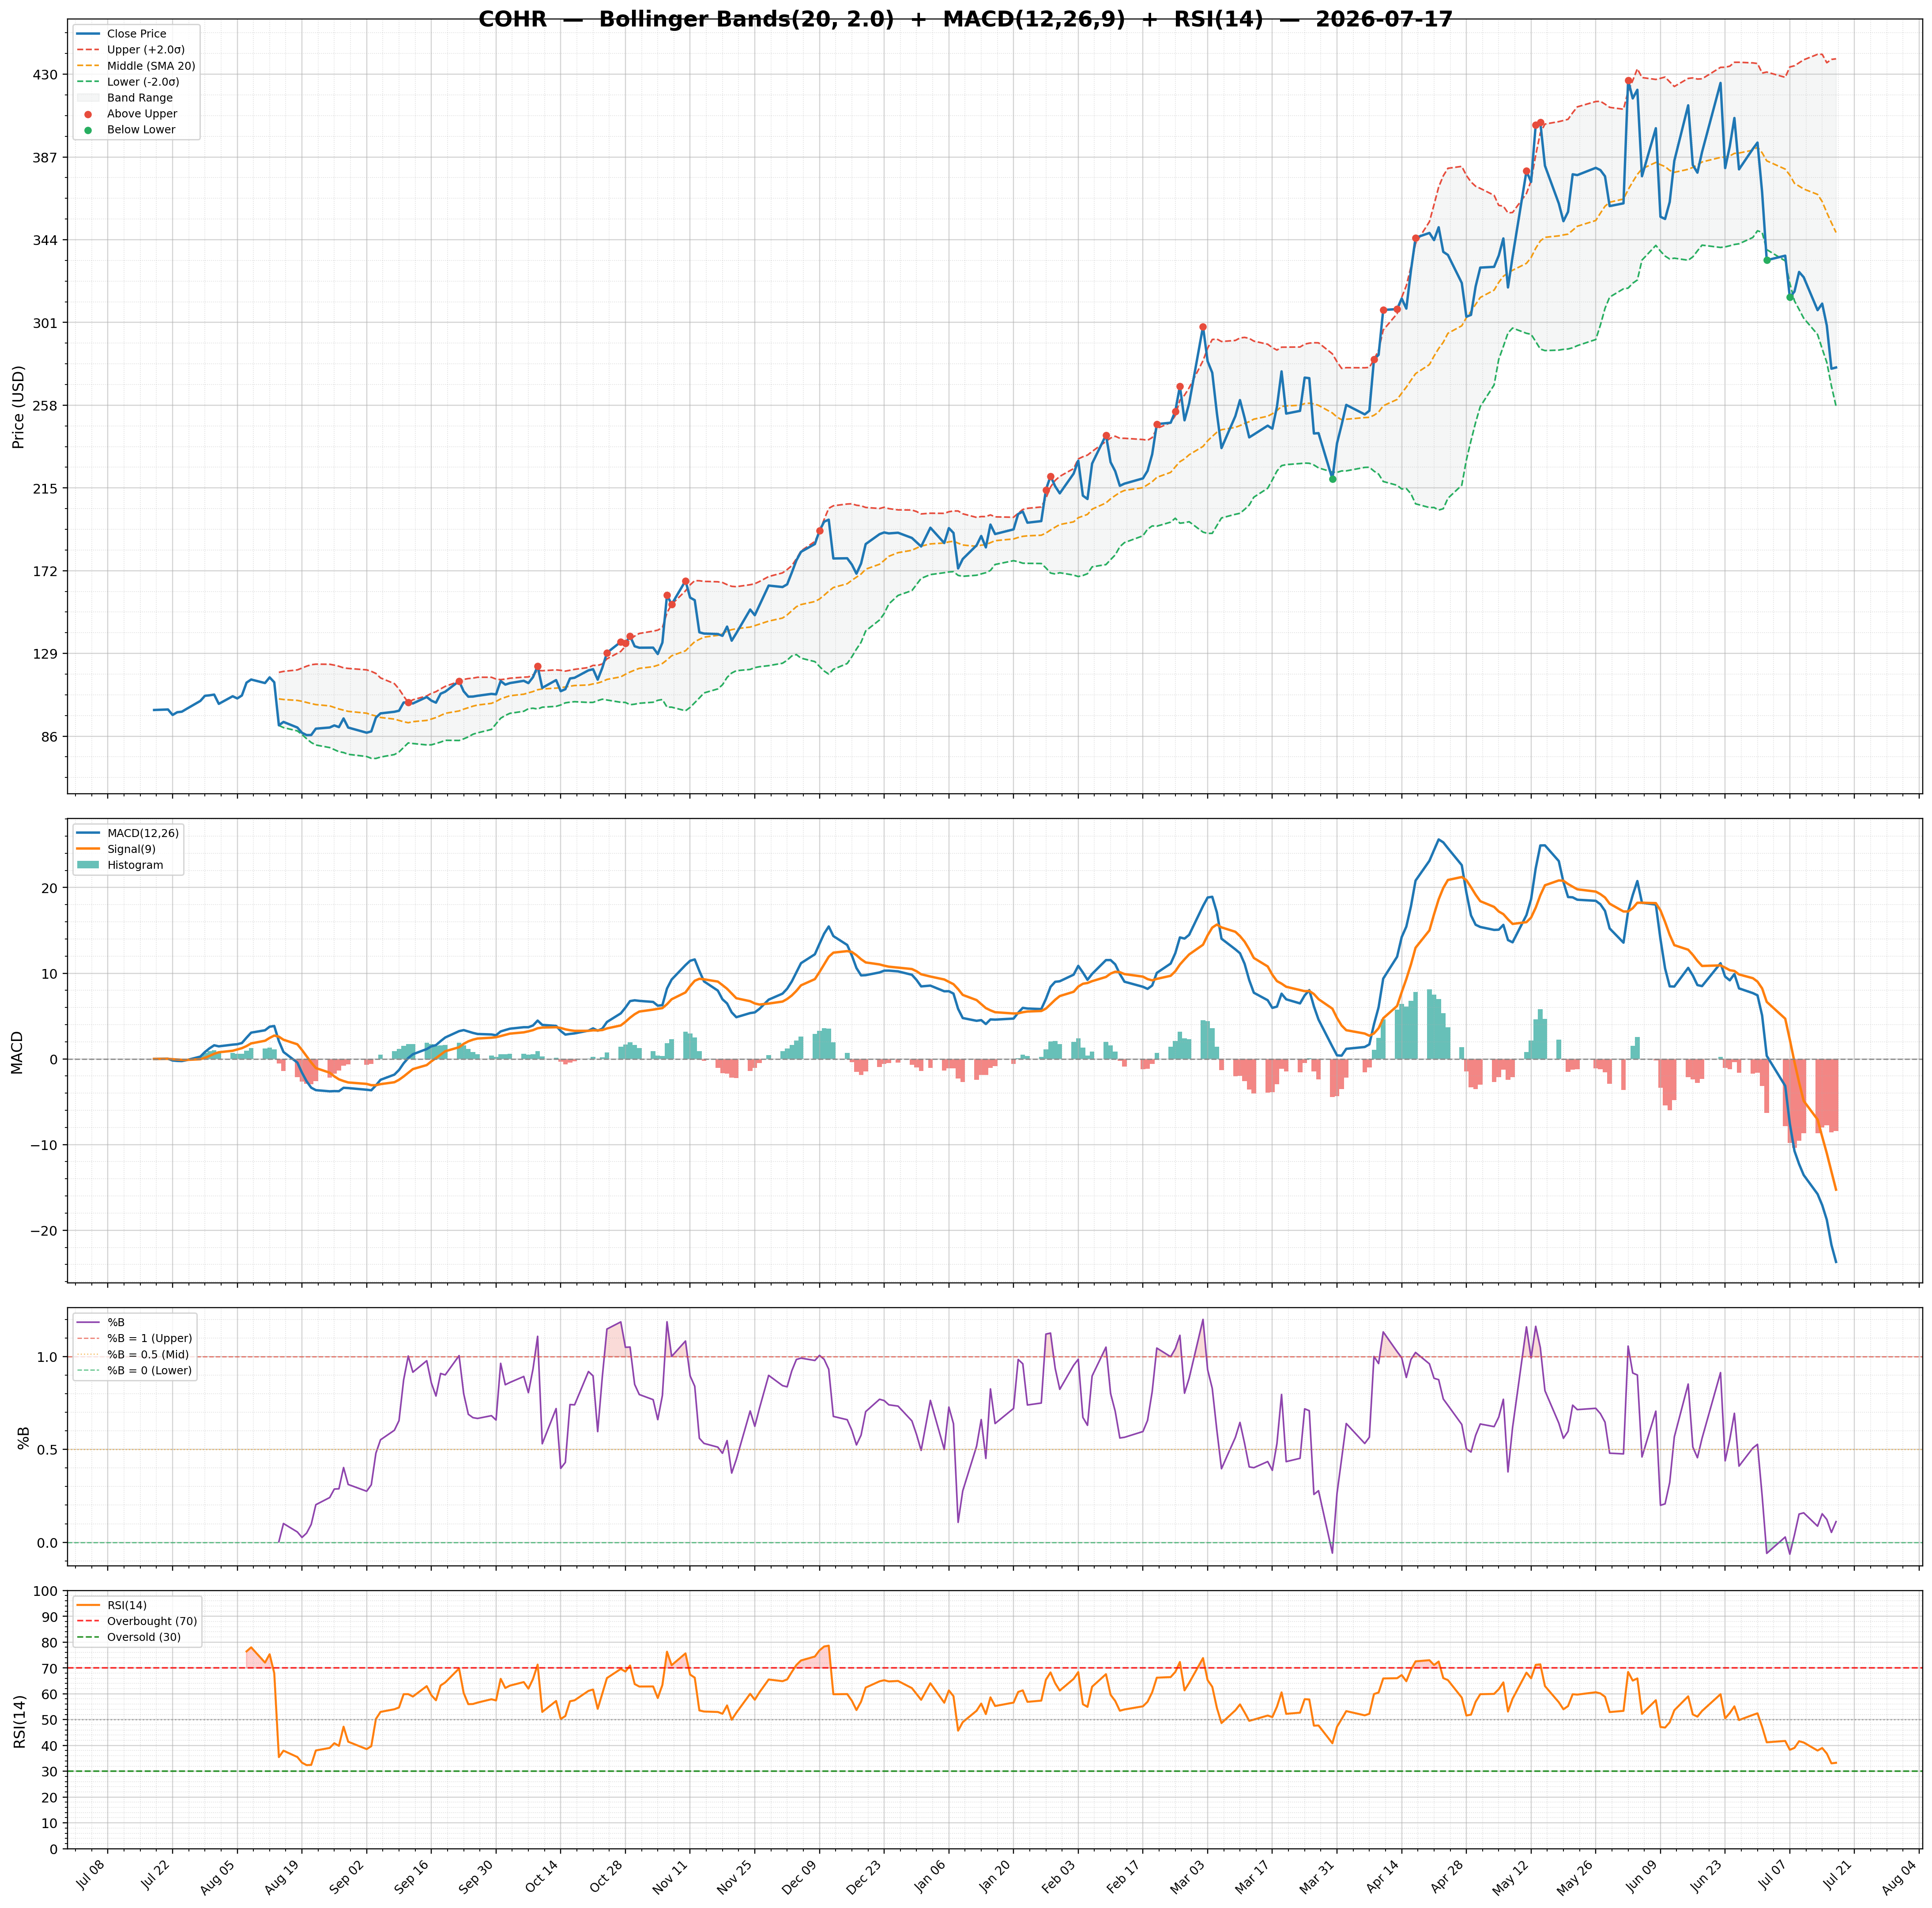
| 2026-07-17 | COHR | 277.60 | / | 56.14% | buy | 5,950,597/5,209,080 | 51.91/0.11 | 33.27/-8.4400 | 0.70 | -23.70/-15.26 | Chart 3M 🌐 |
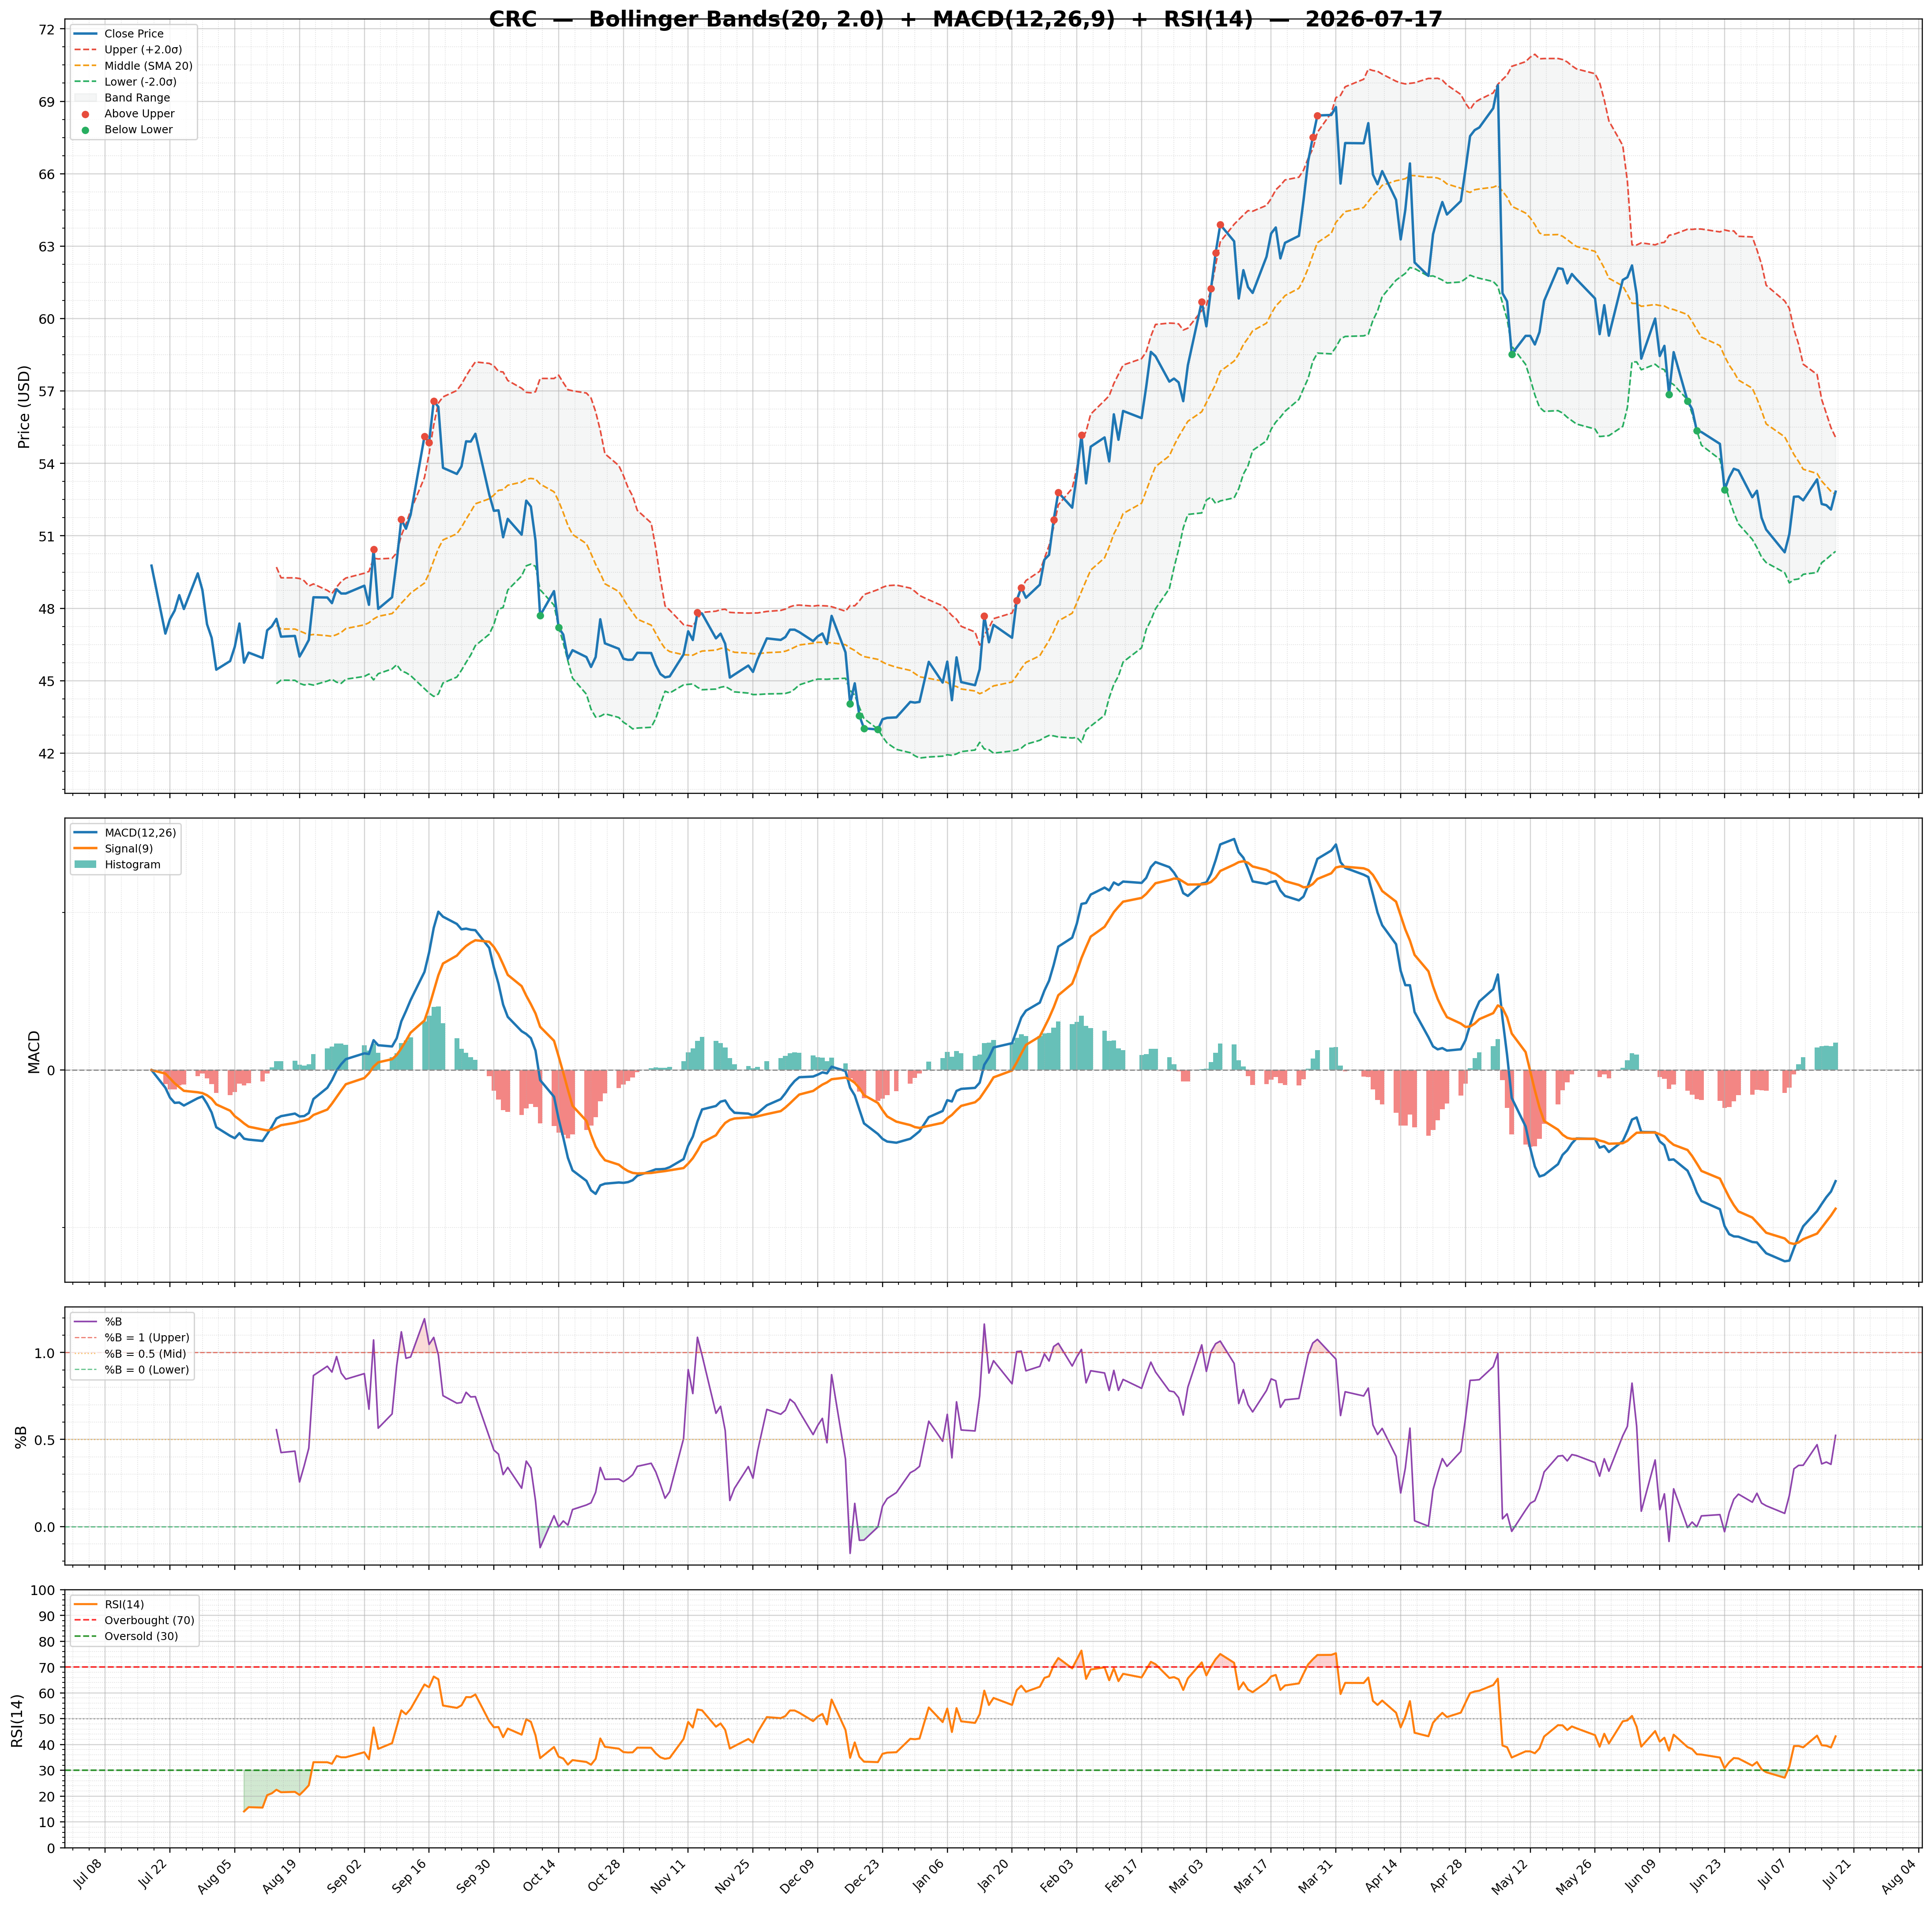
| 2026-07-17 | CRC | 52.83 | / | 36.92% | strong_buy | 483,566/899,508 | 8.96/0.52 | 43.17/0.3500 | -0.01 | -1.41/-1.76 | Chart 3M 🌐 |
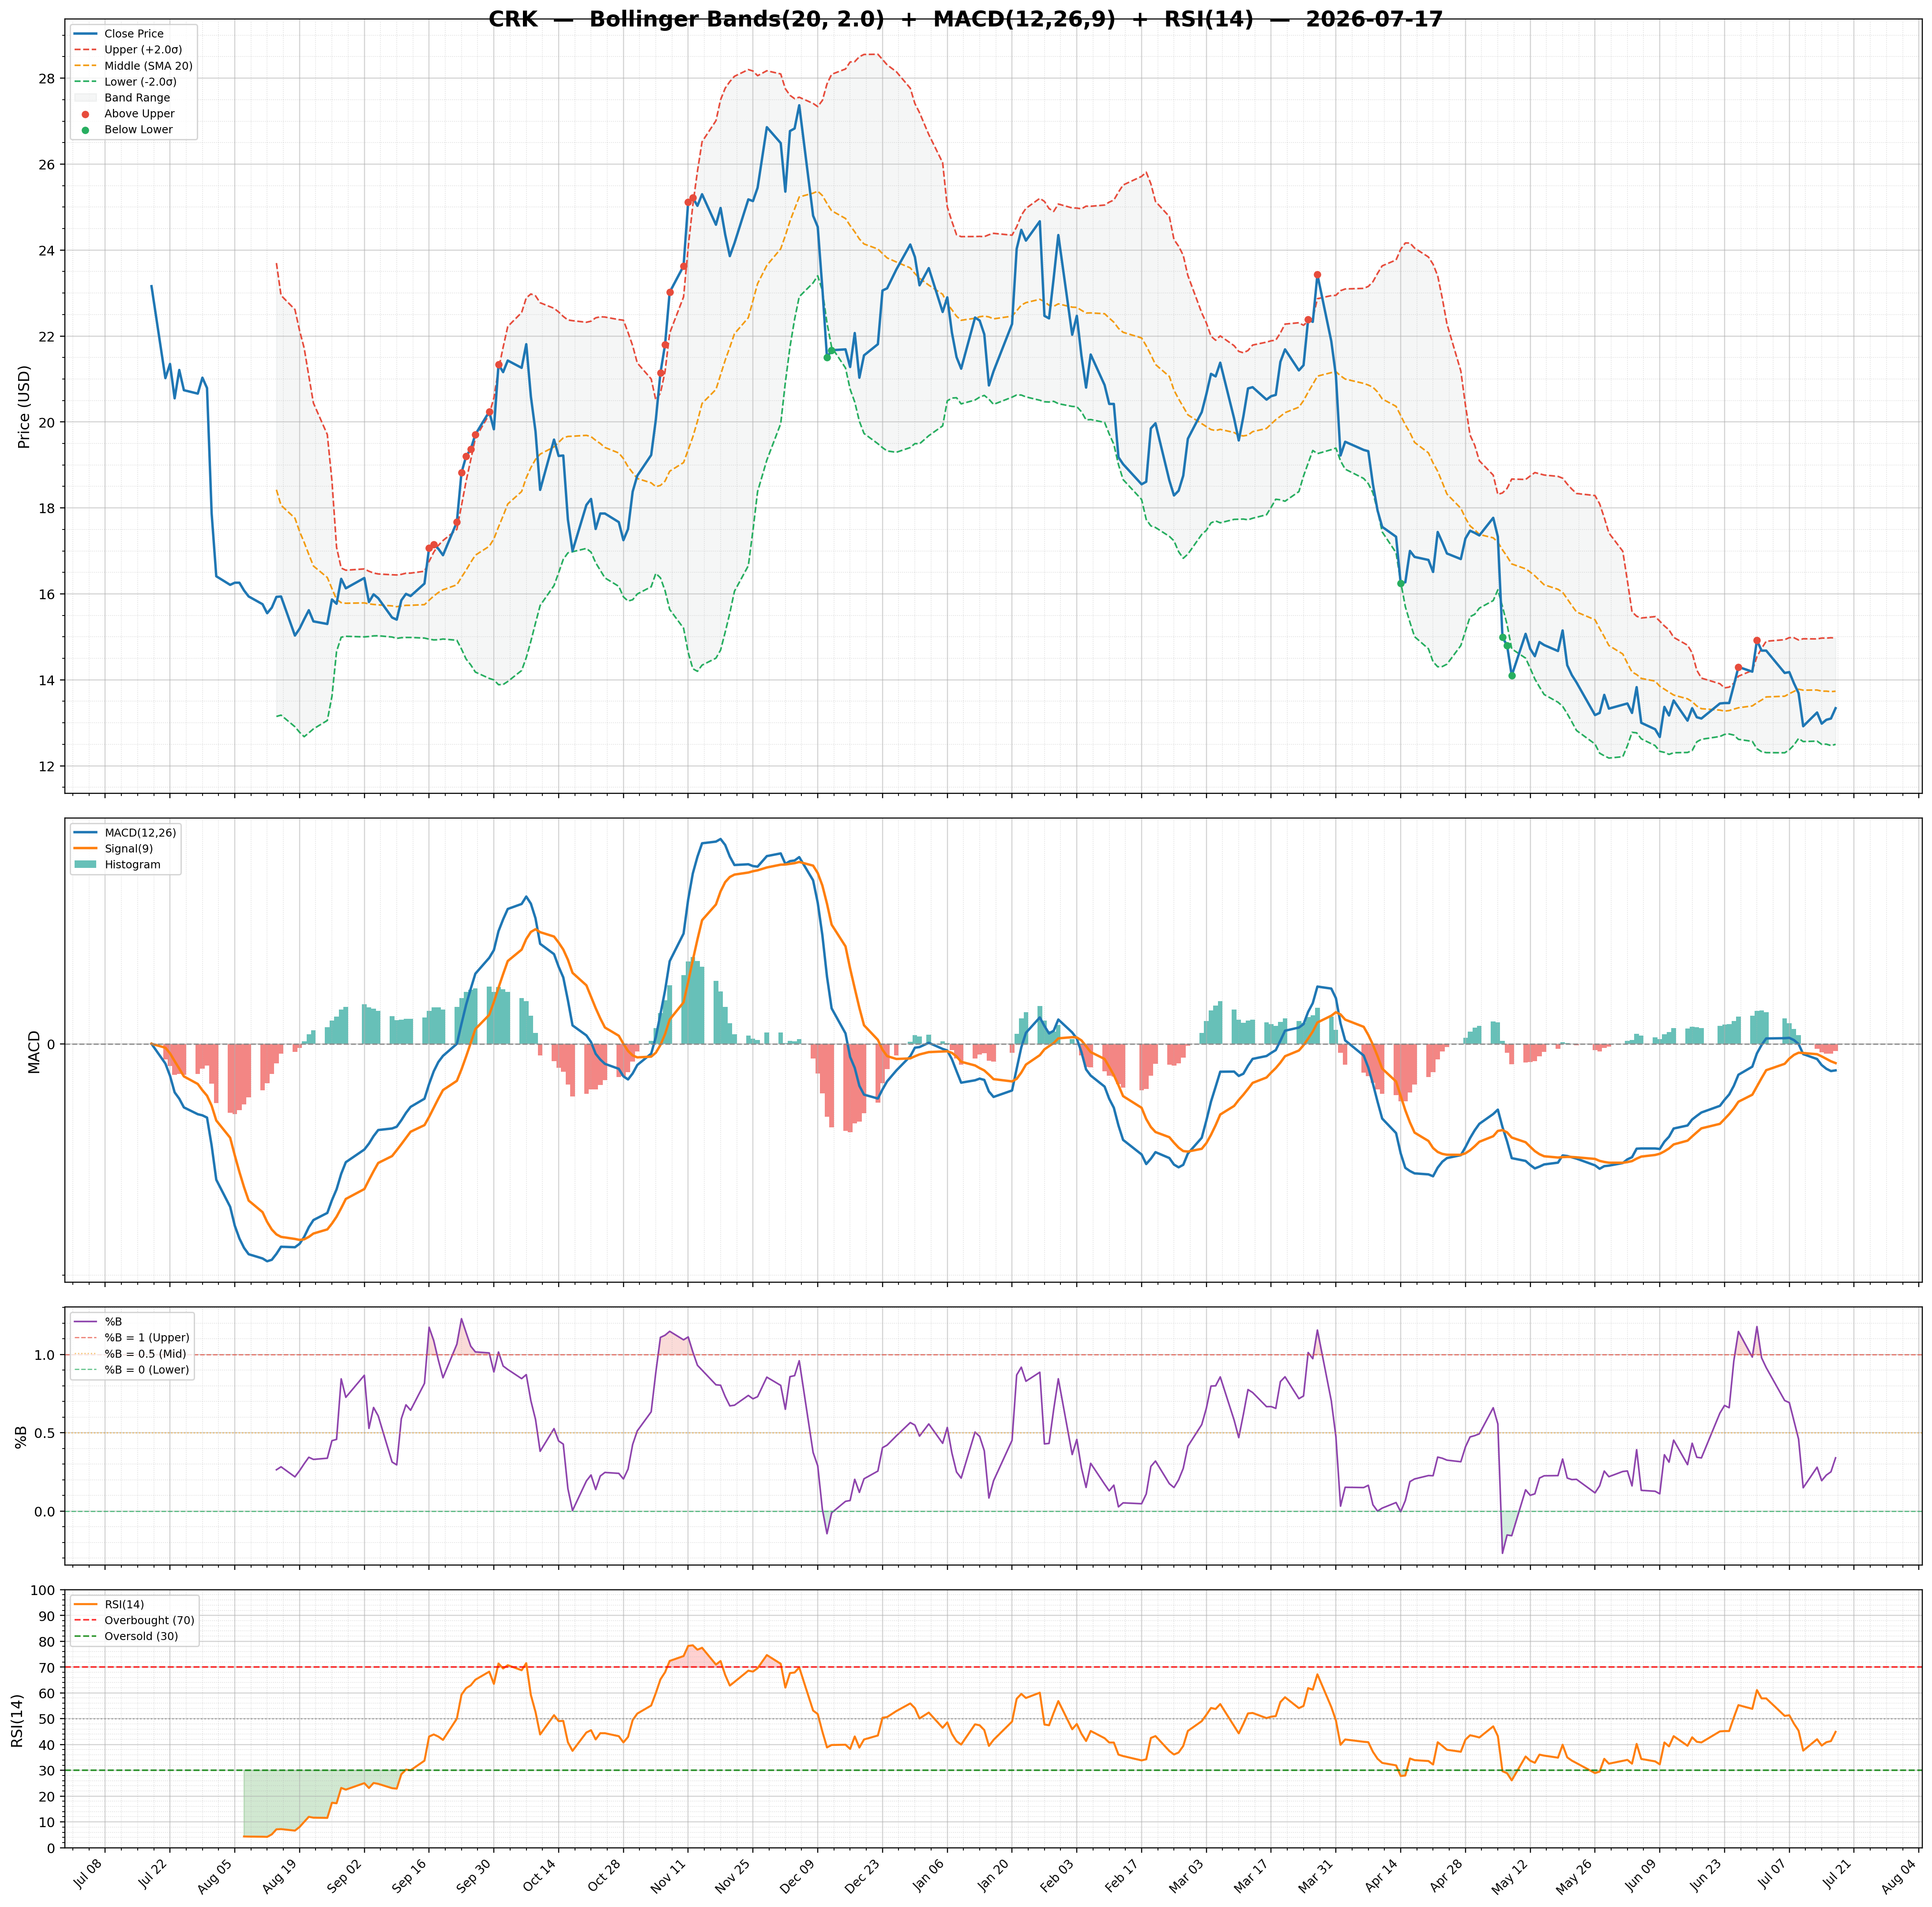
| 2026-07-17 | CRK | 13.34 | / | 4.56% | hold | 1,553,241/2,665,167 | 18.01/0.34 | 44.92/-0.0600 | -0.30 | -0.23/-0.17 | Chart 3M 🌐 |
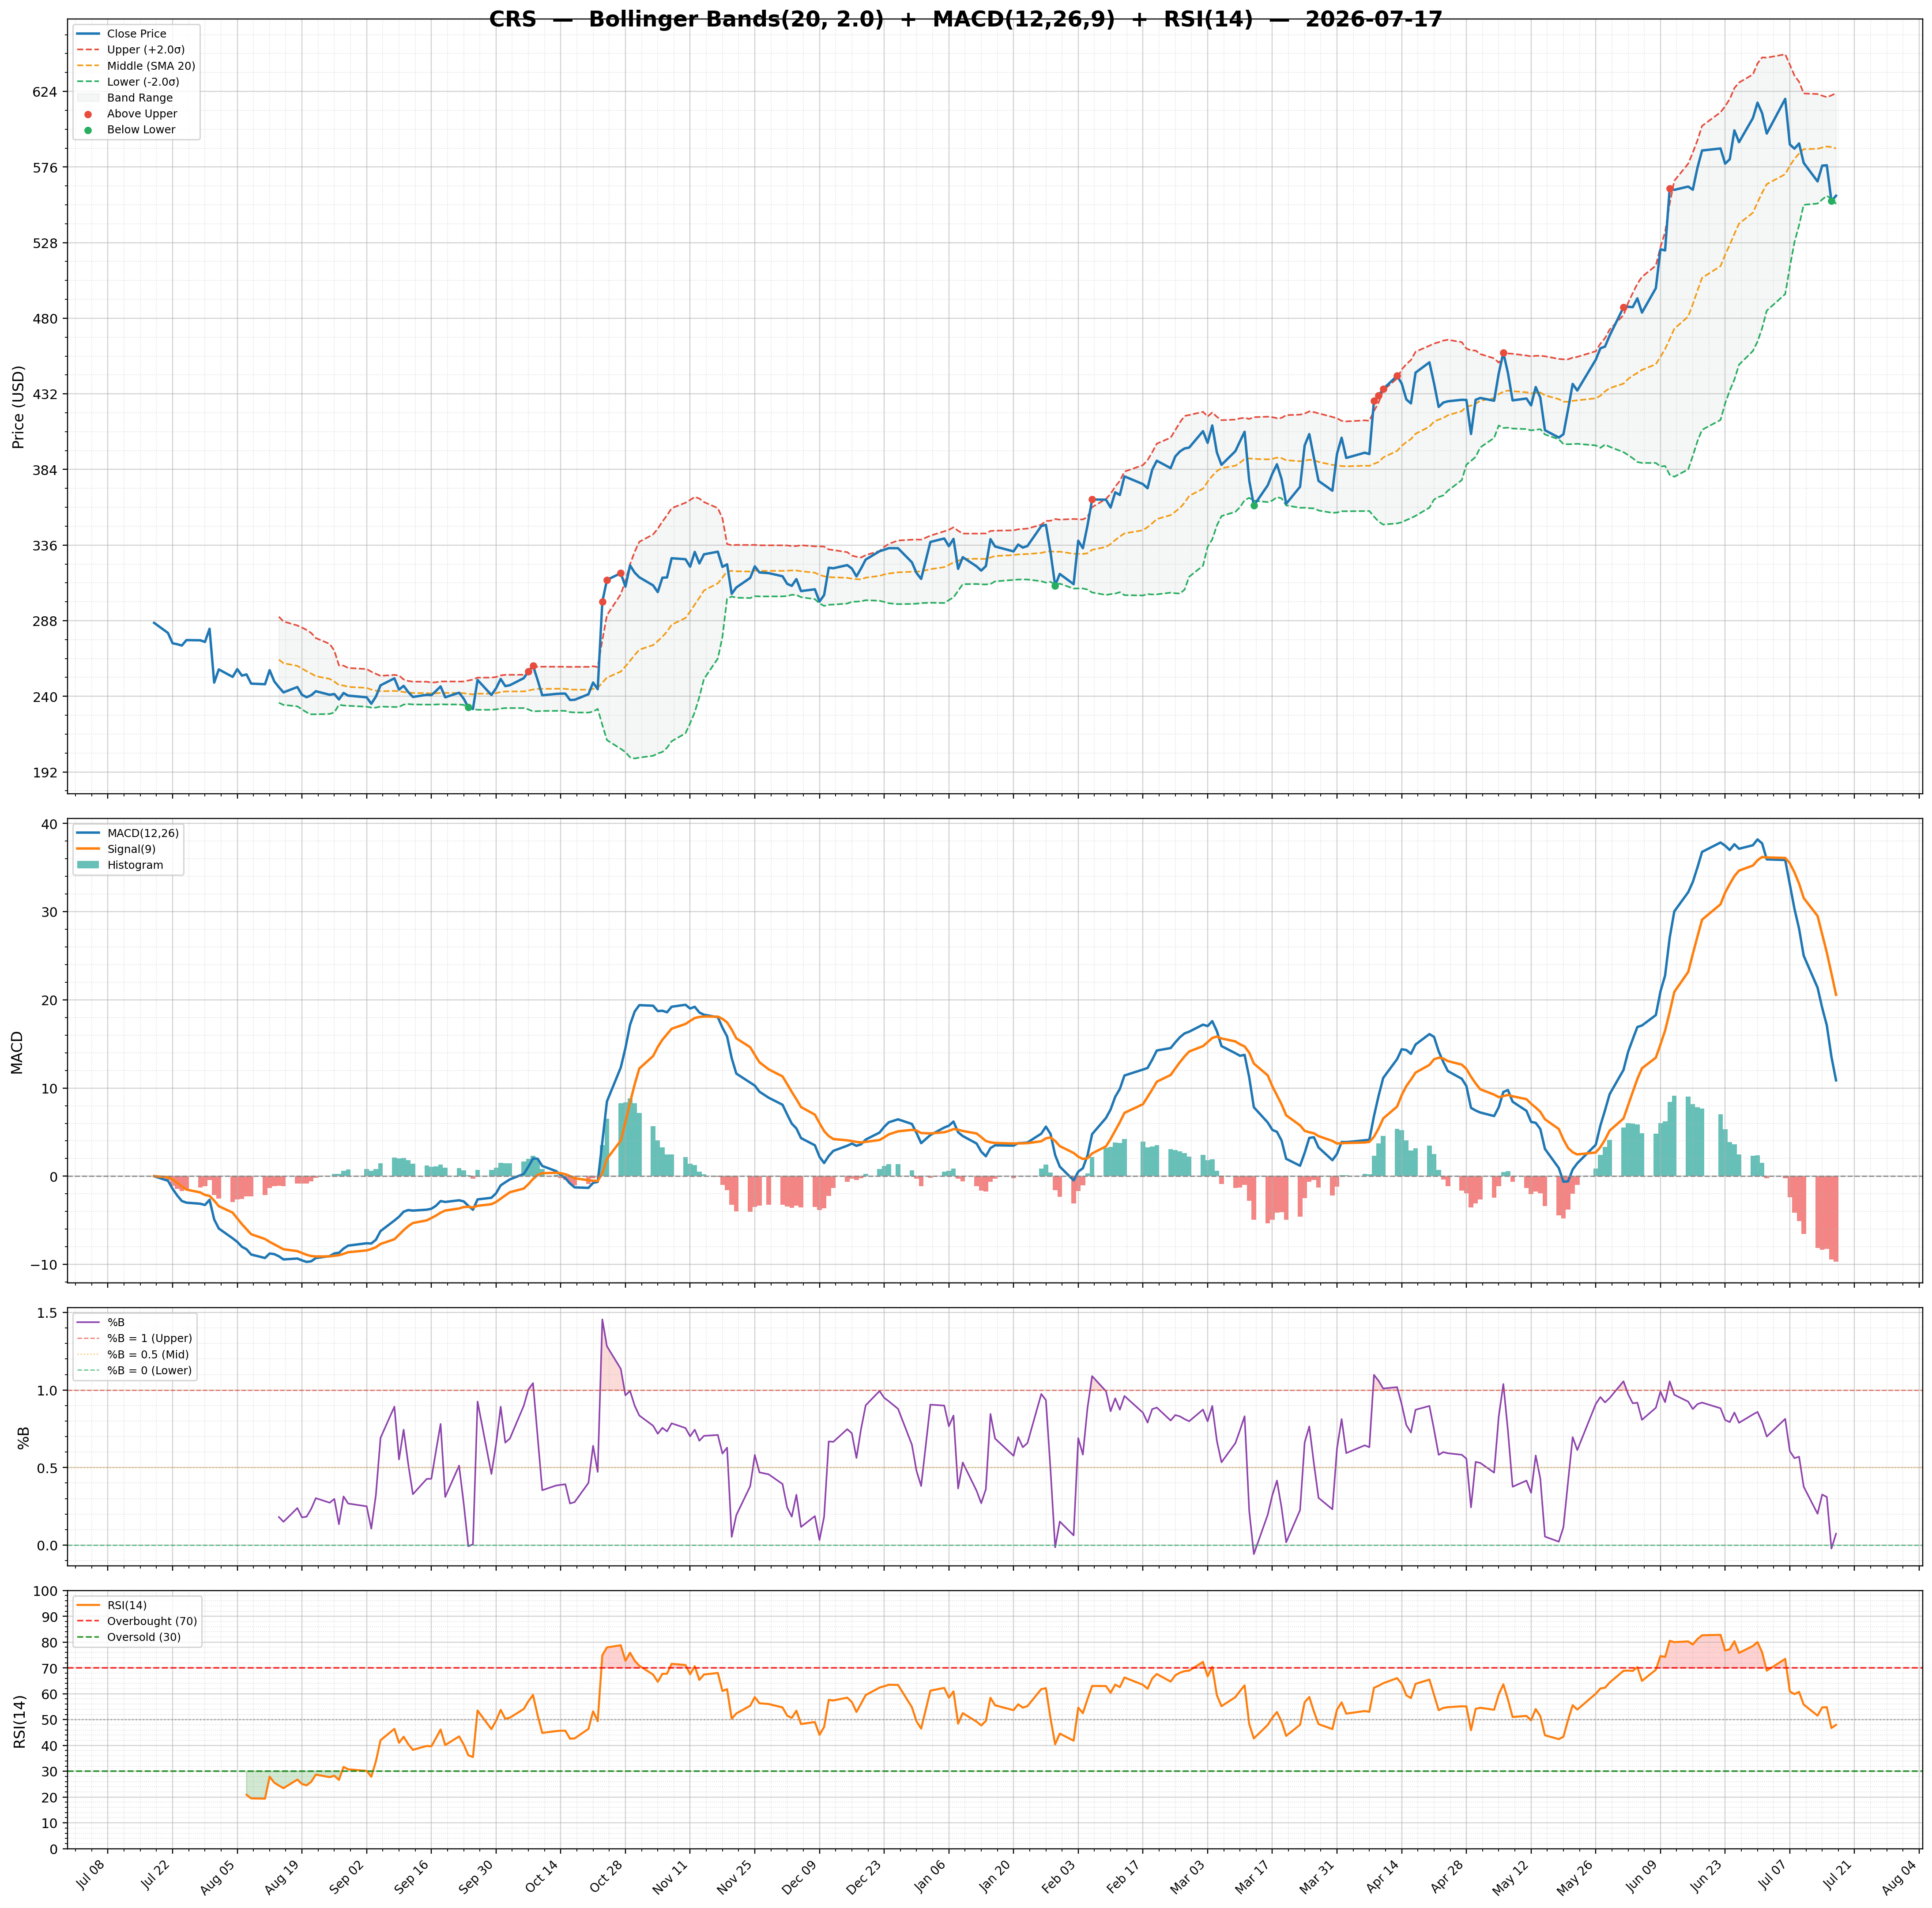
| 2026-07-17 | CRS | 557.77 | / | 84.13% | strong_buy | 678,355/872,918 | 11.96/0.07 | 47.96/-9.7100 | 0.73 | 10.87/20.58 | Chart 3M 🌐 |
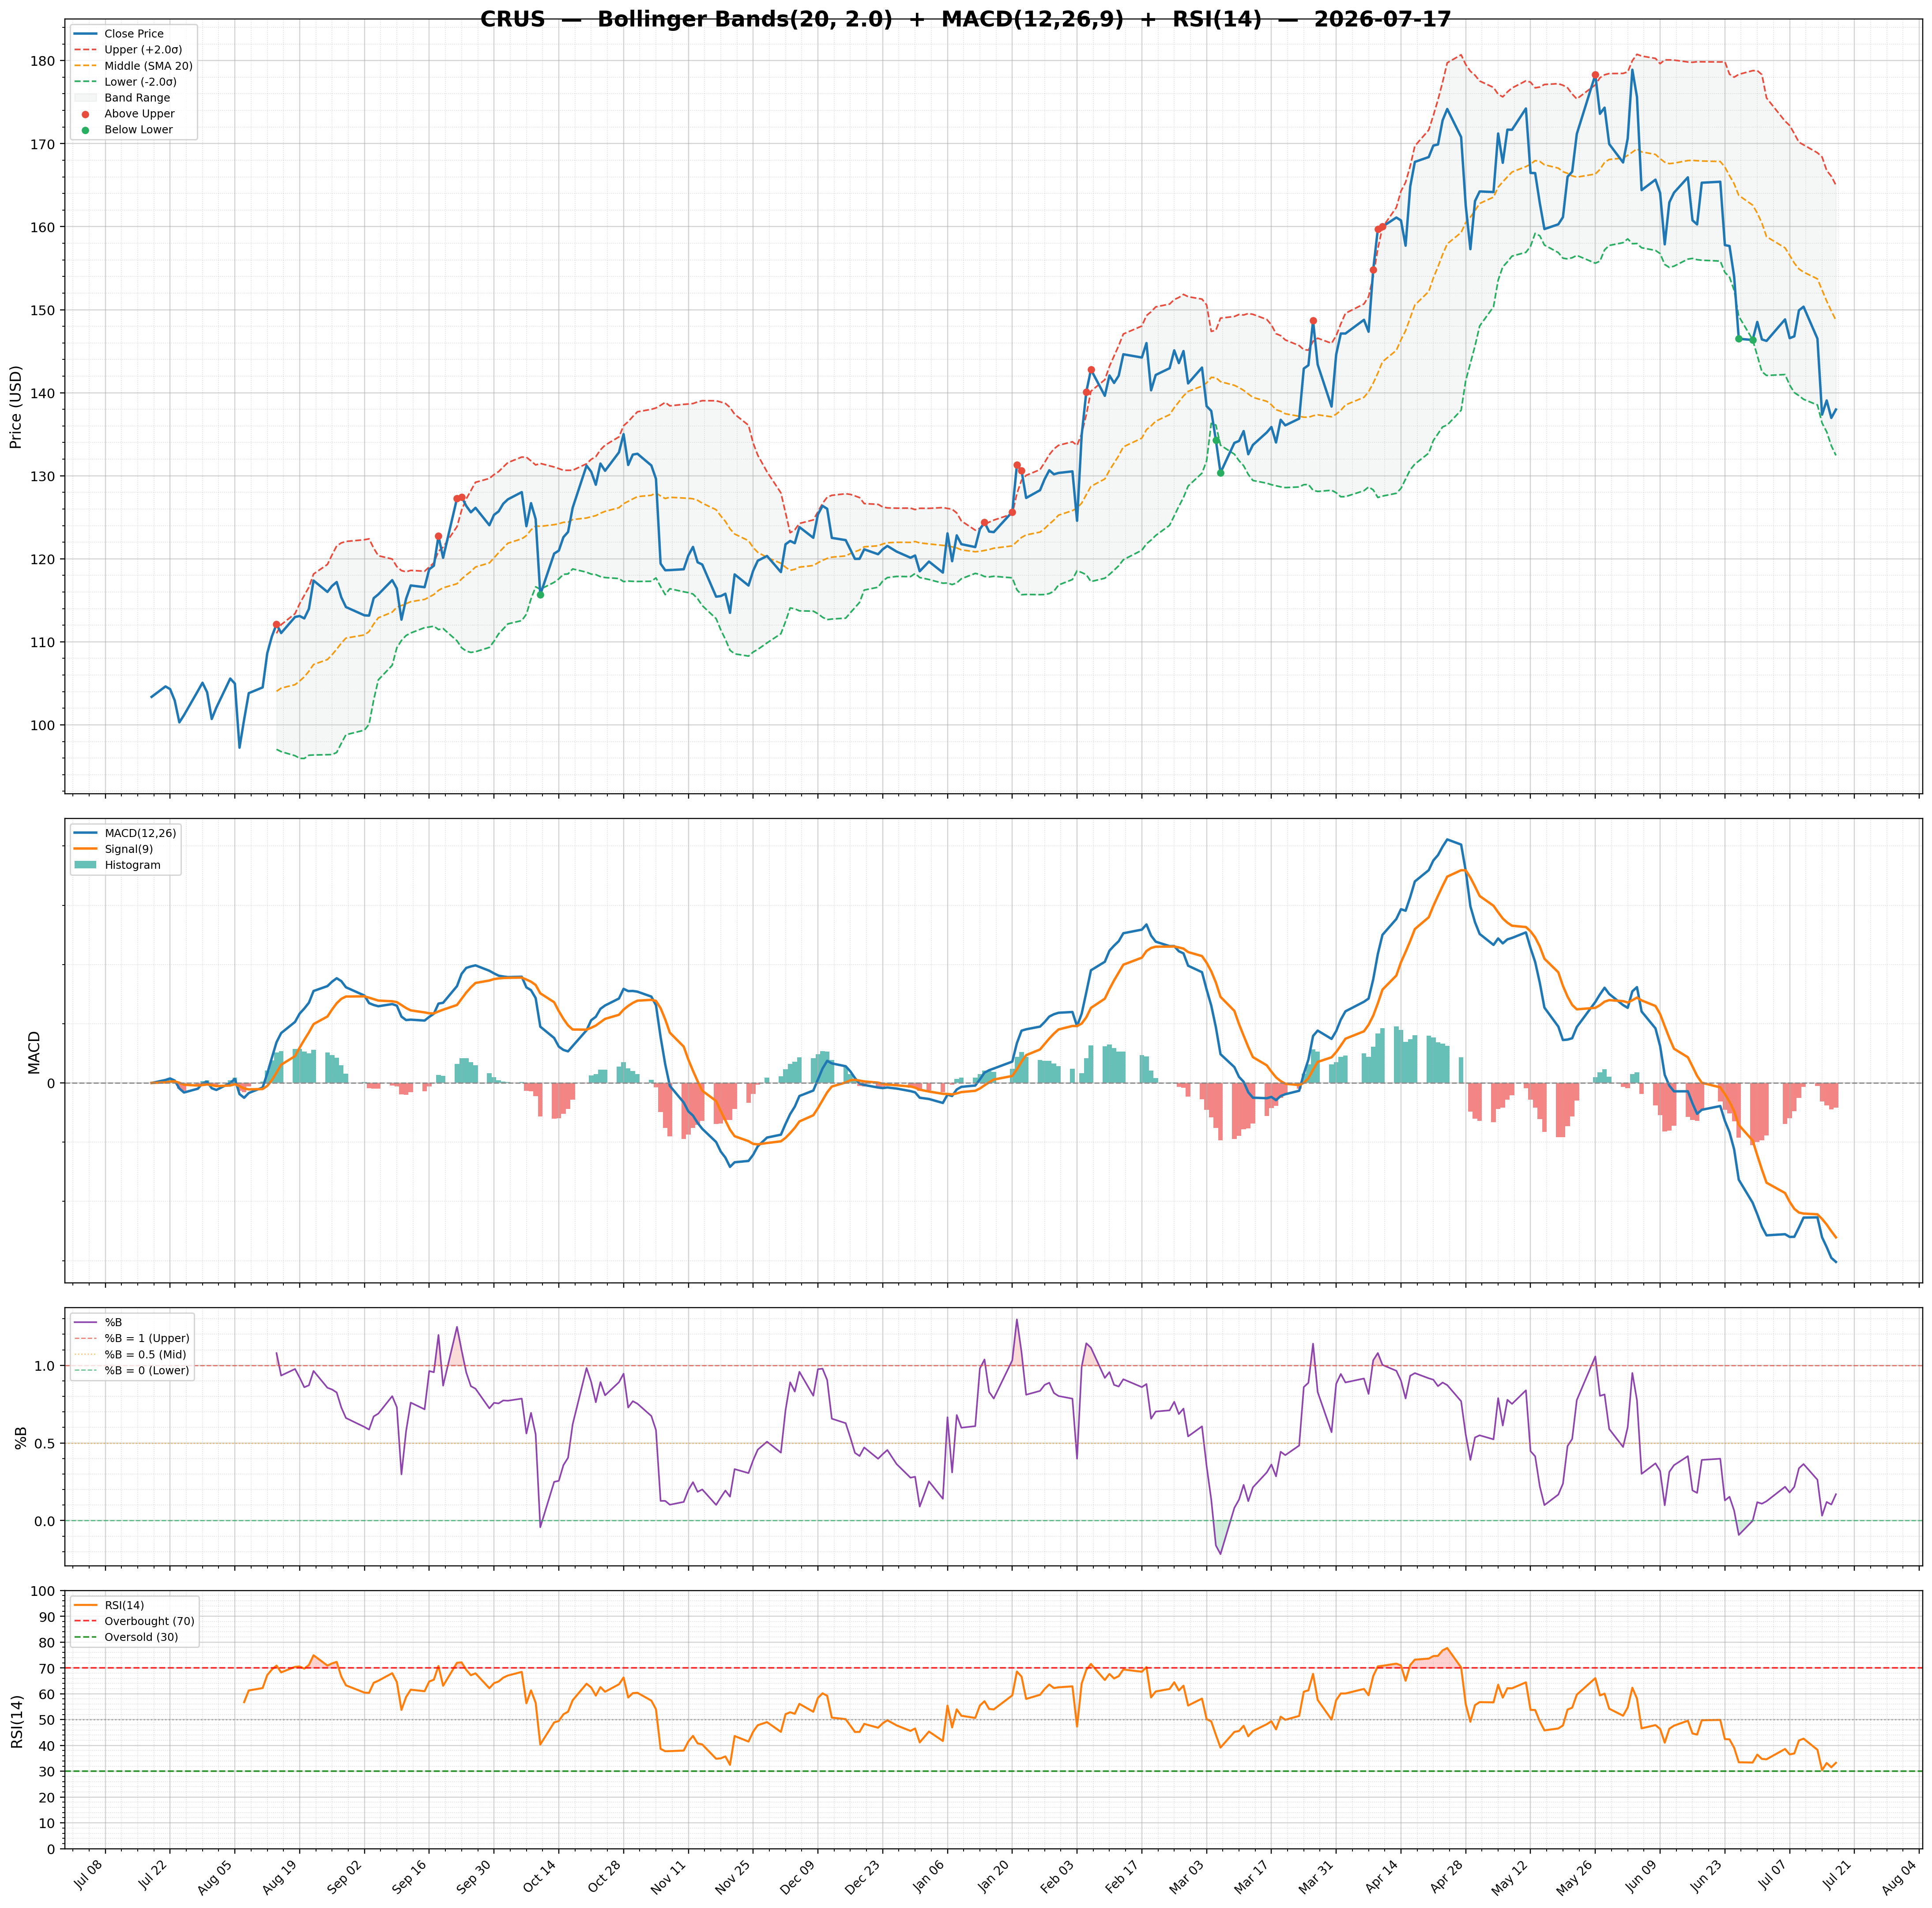
| 2026-07-17 | CRUS | 137.98 | / | 49.88% | buy | 688,243/662,838 | 21.88/0.17 | 33.26/-0.8300 | 0.05 | -6.04/-5.21 | Chart 3M 🌐 |
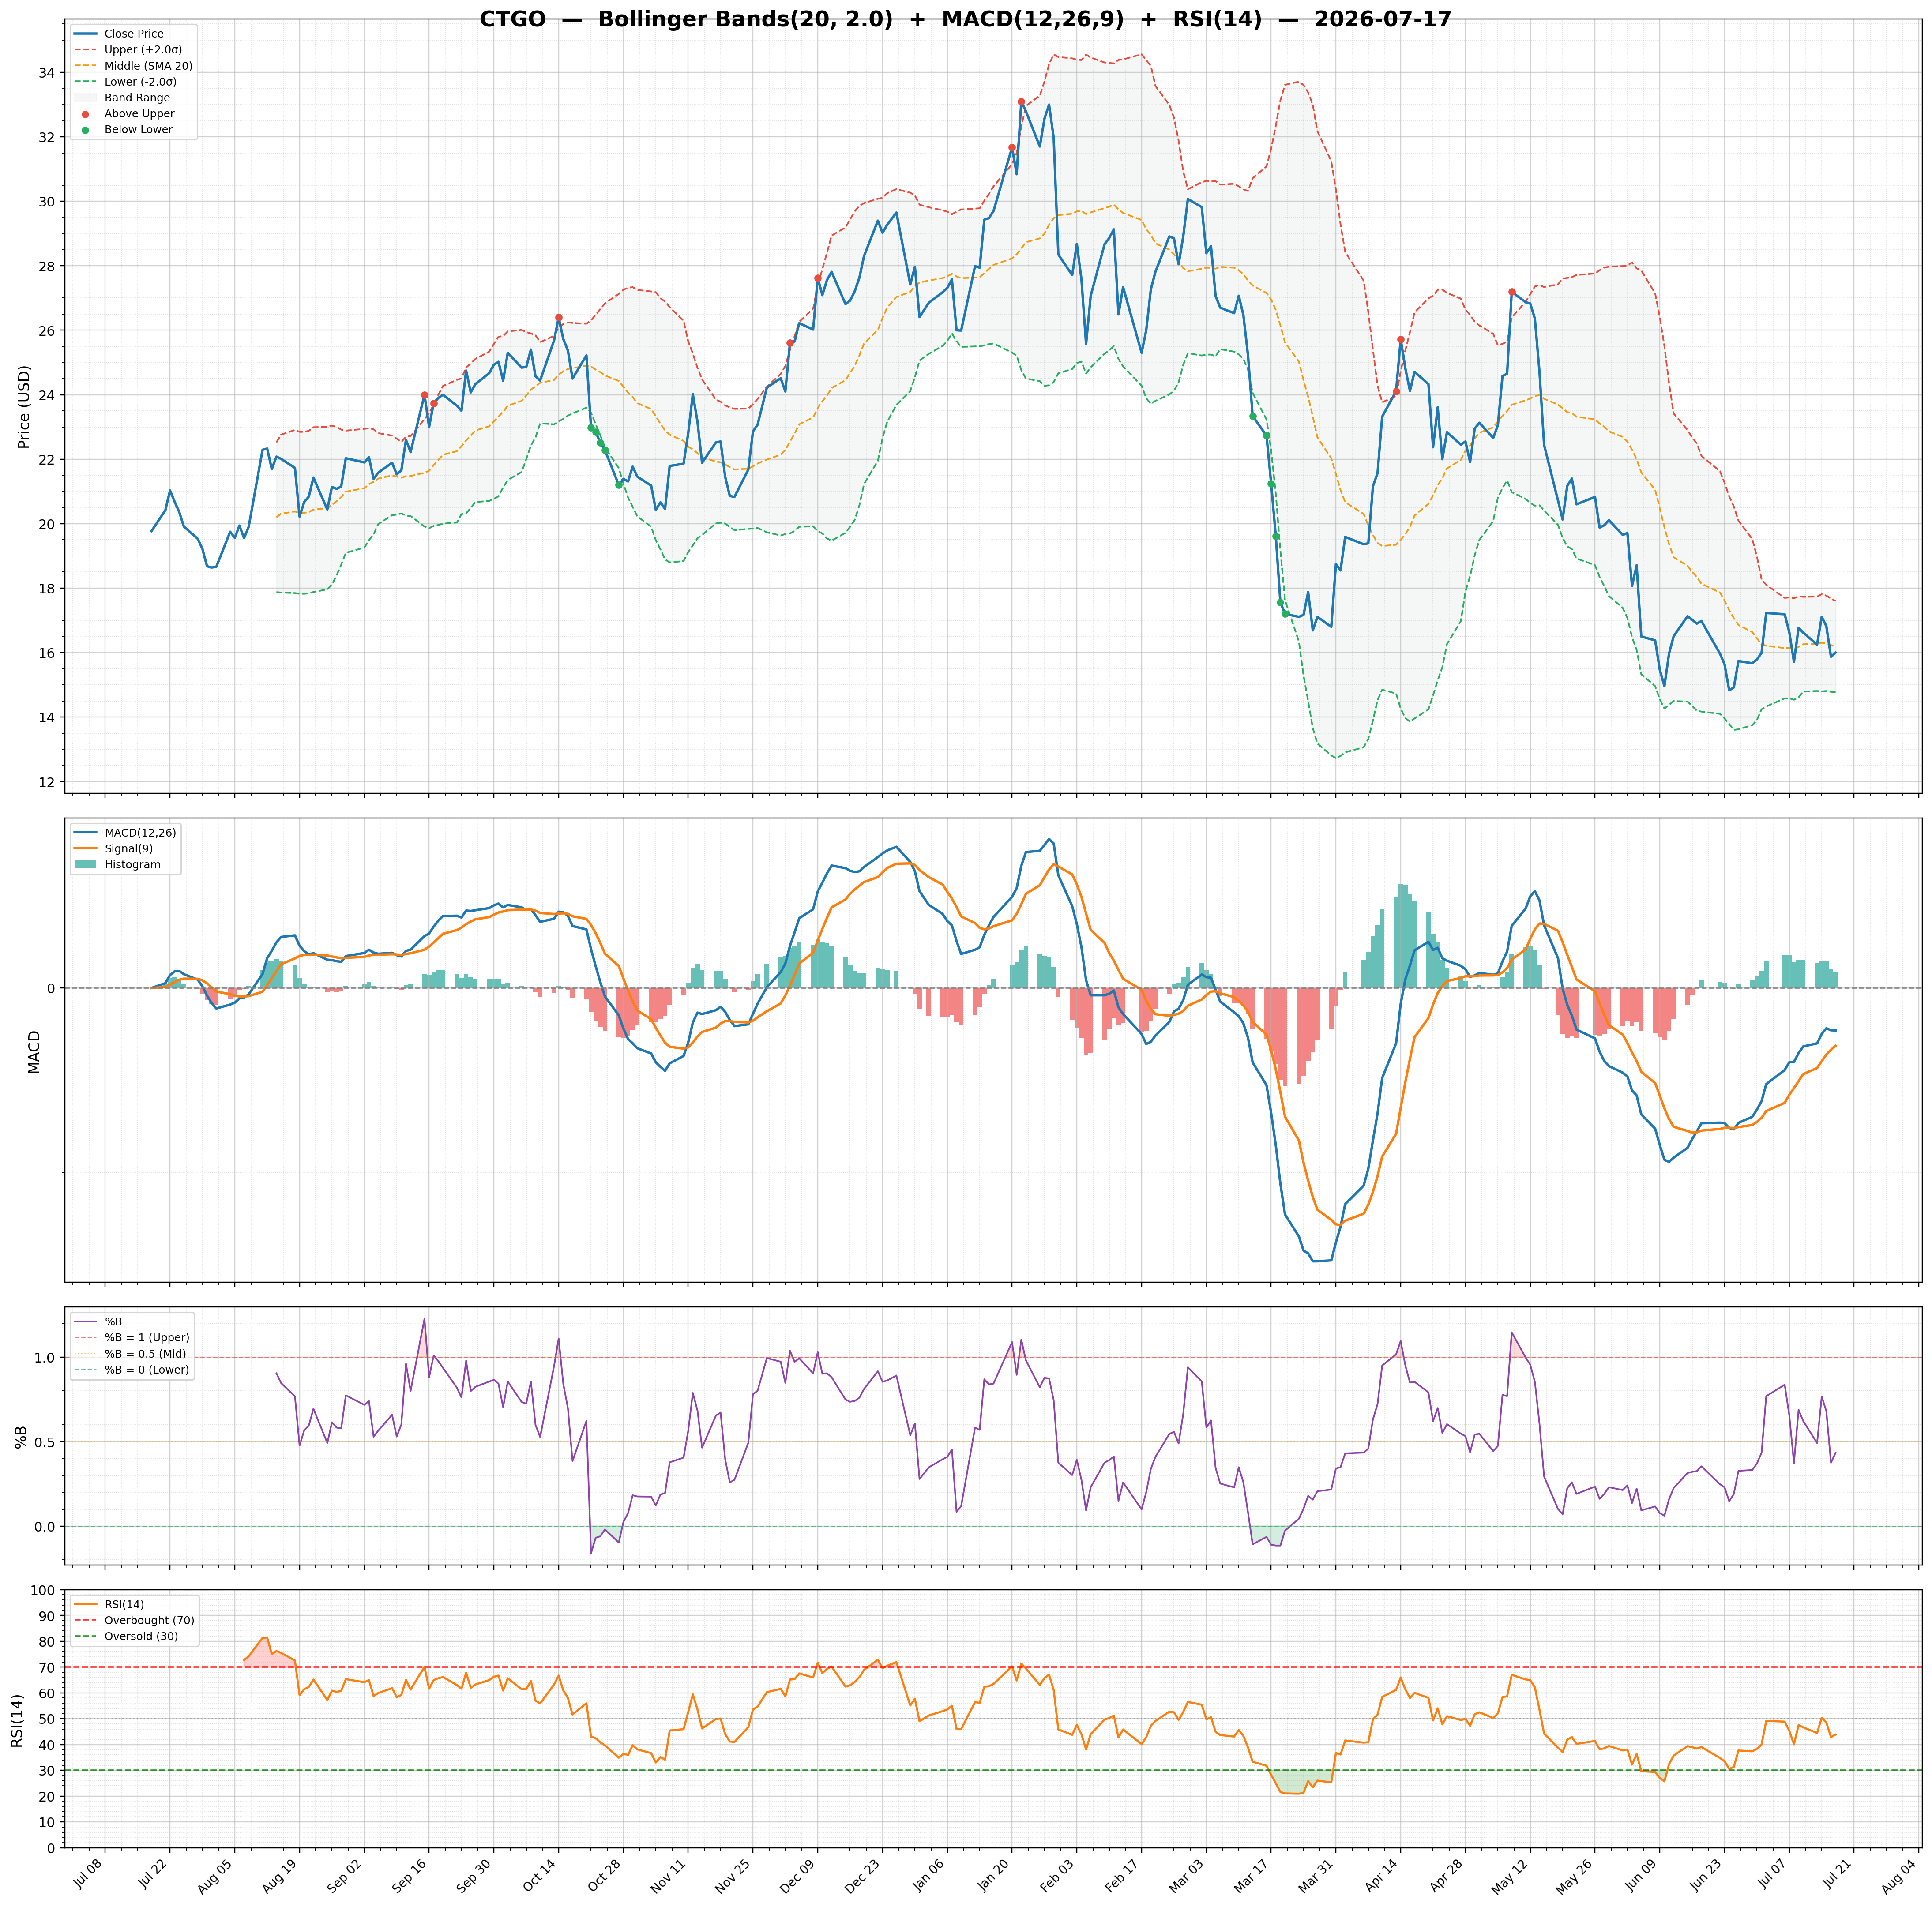
| 2026-07-17 | CTGO | 16.00 | / | 6.40% | strong_buy | 330,422/686,206 | 17.50/0.43 | 43.83/0.1700 | -0.35 | -0.46/-0.63 | Chart 3M 🌐 |
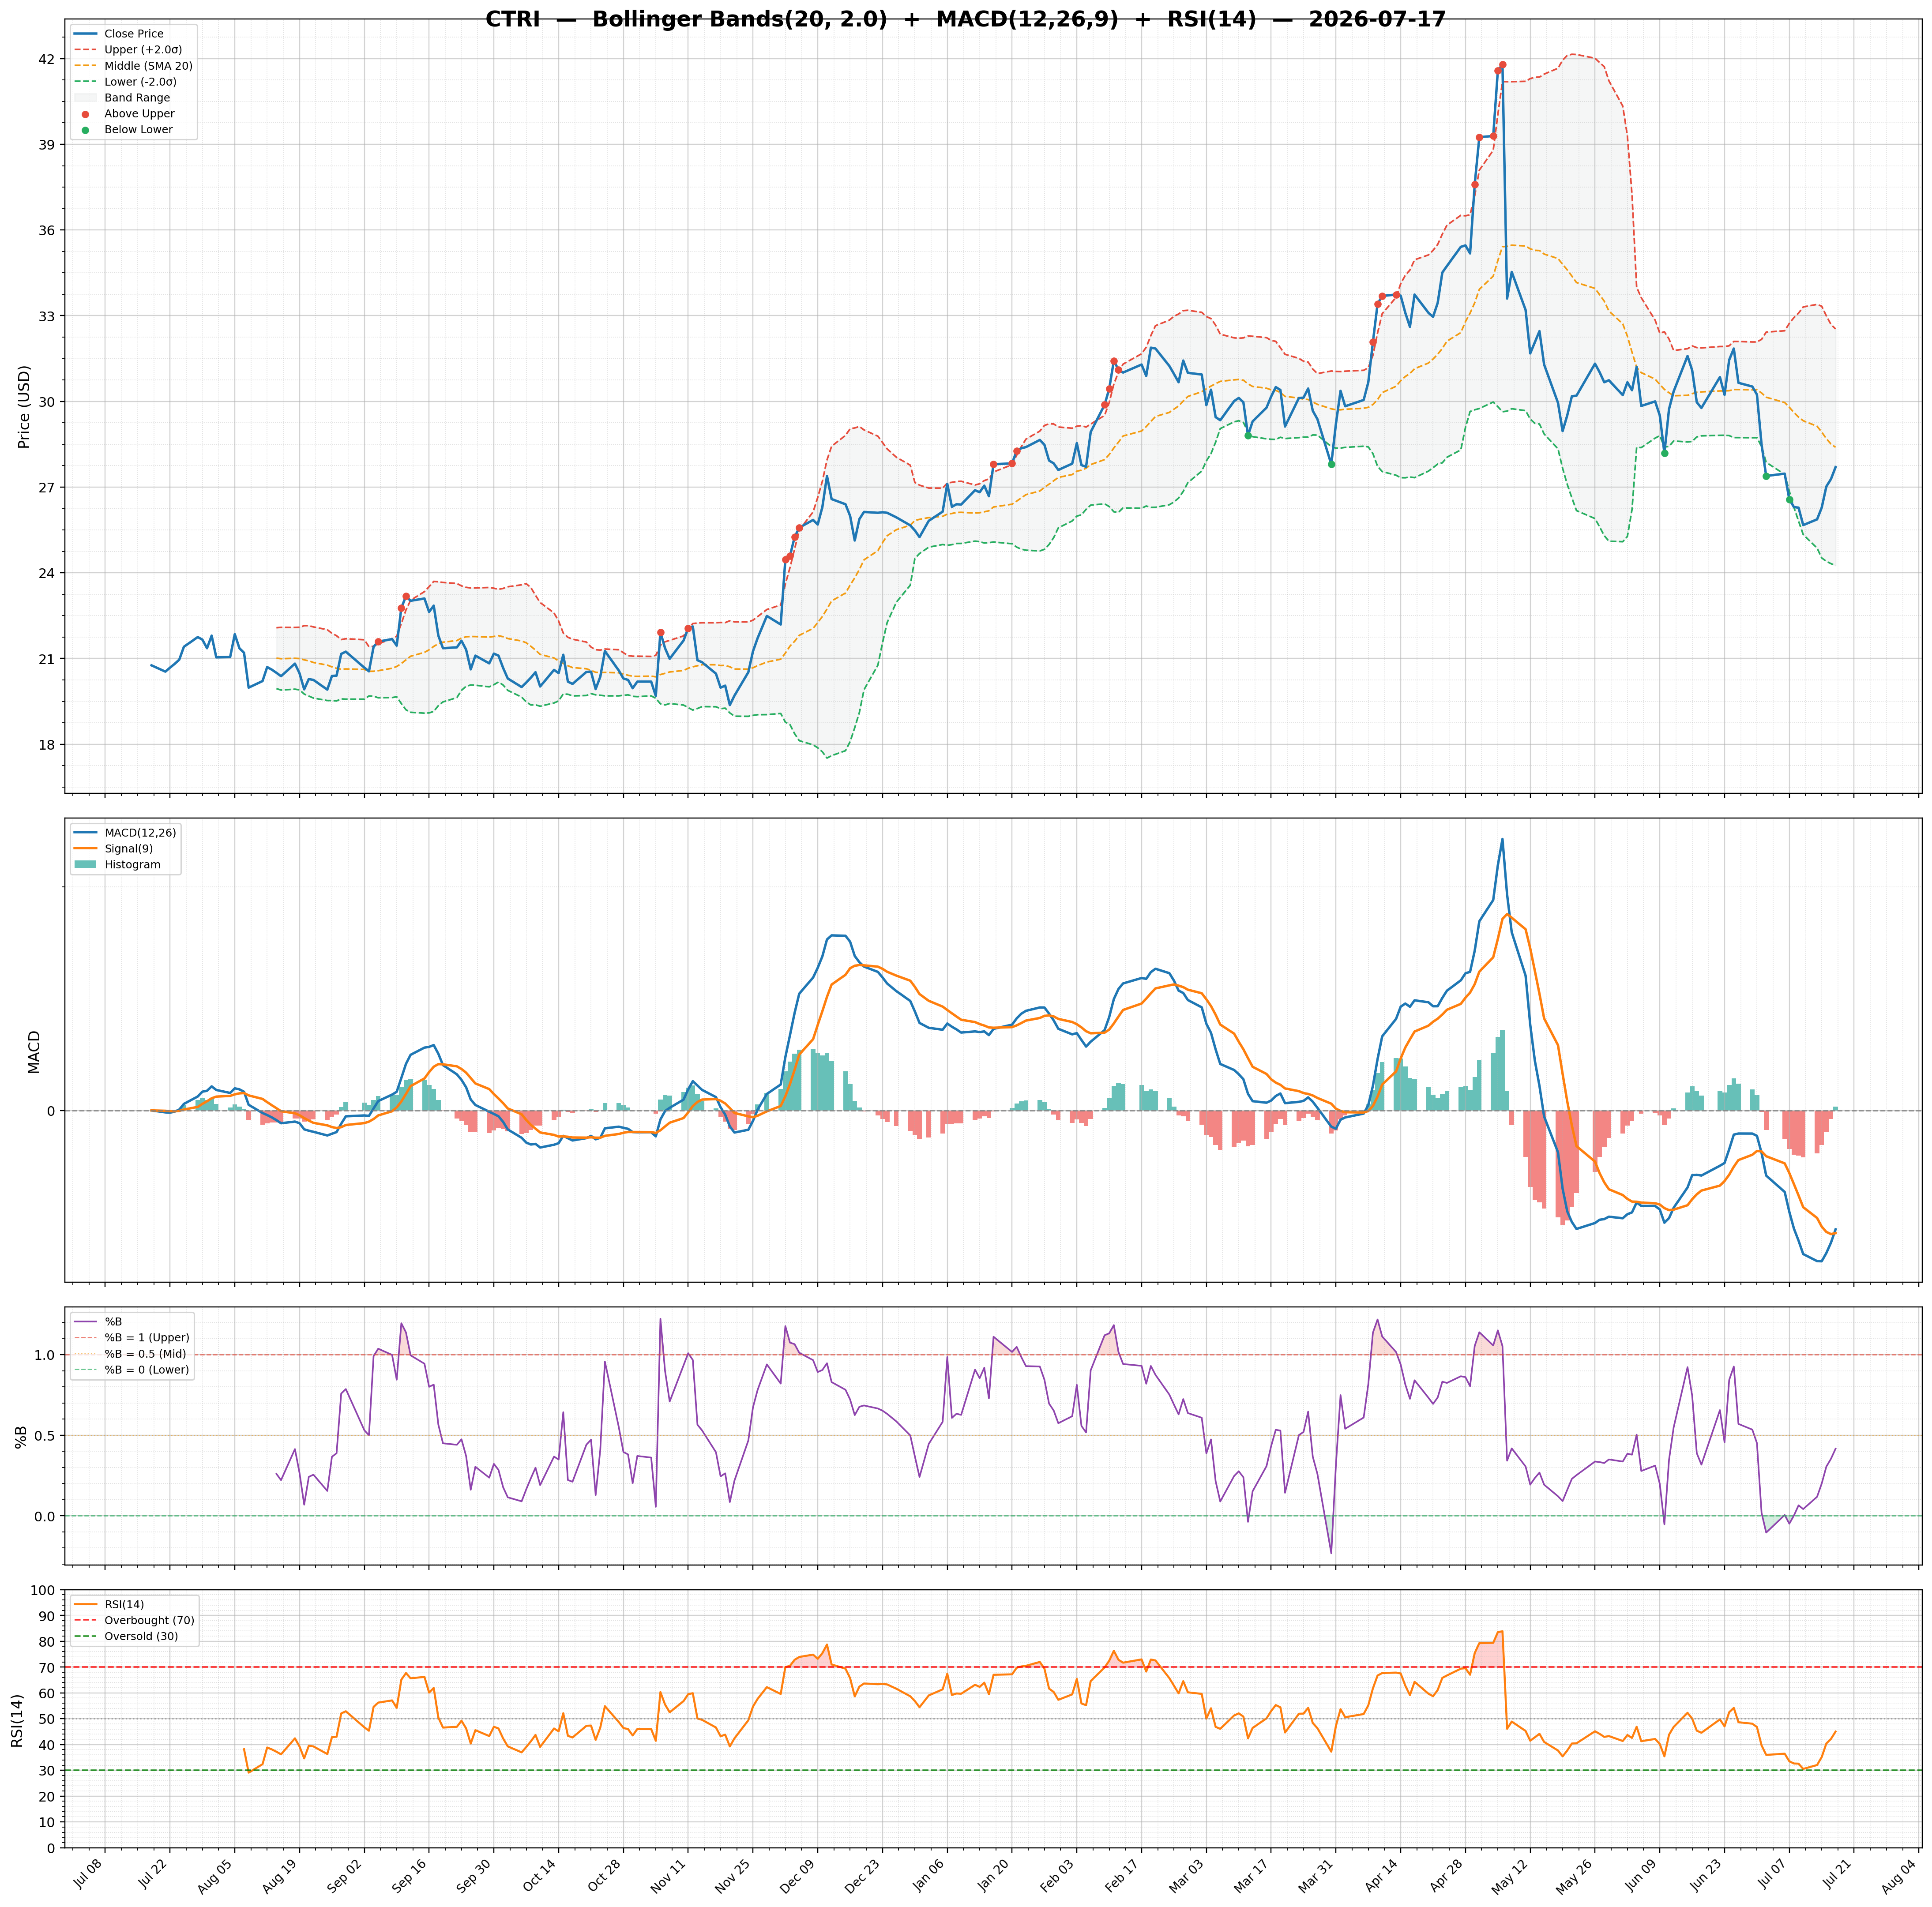
| 2026-07-17 | CTRI | 27.70 | / | 37.14% | buy | 1,456,941/1,699,057 | 29.18/0.42 | 45.01/0.0300 | 0.08 | -1.06/-1.10 | Chart 3M 🌐 |
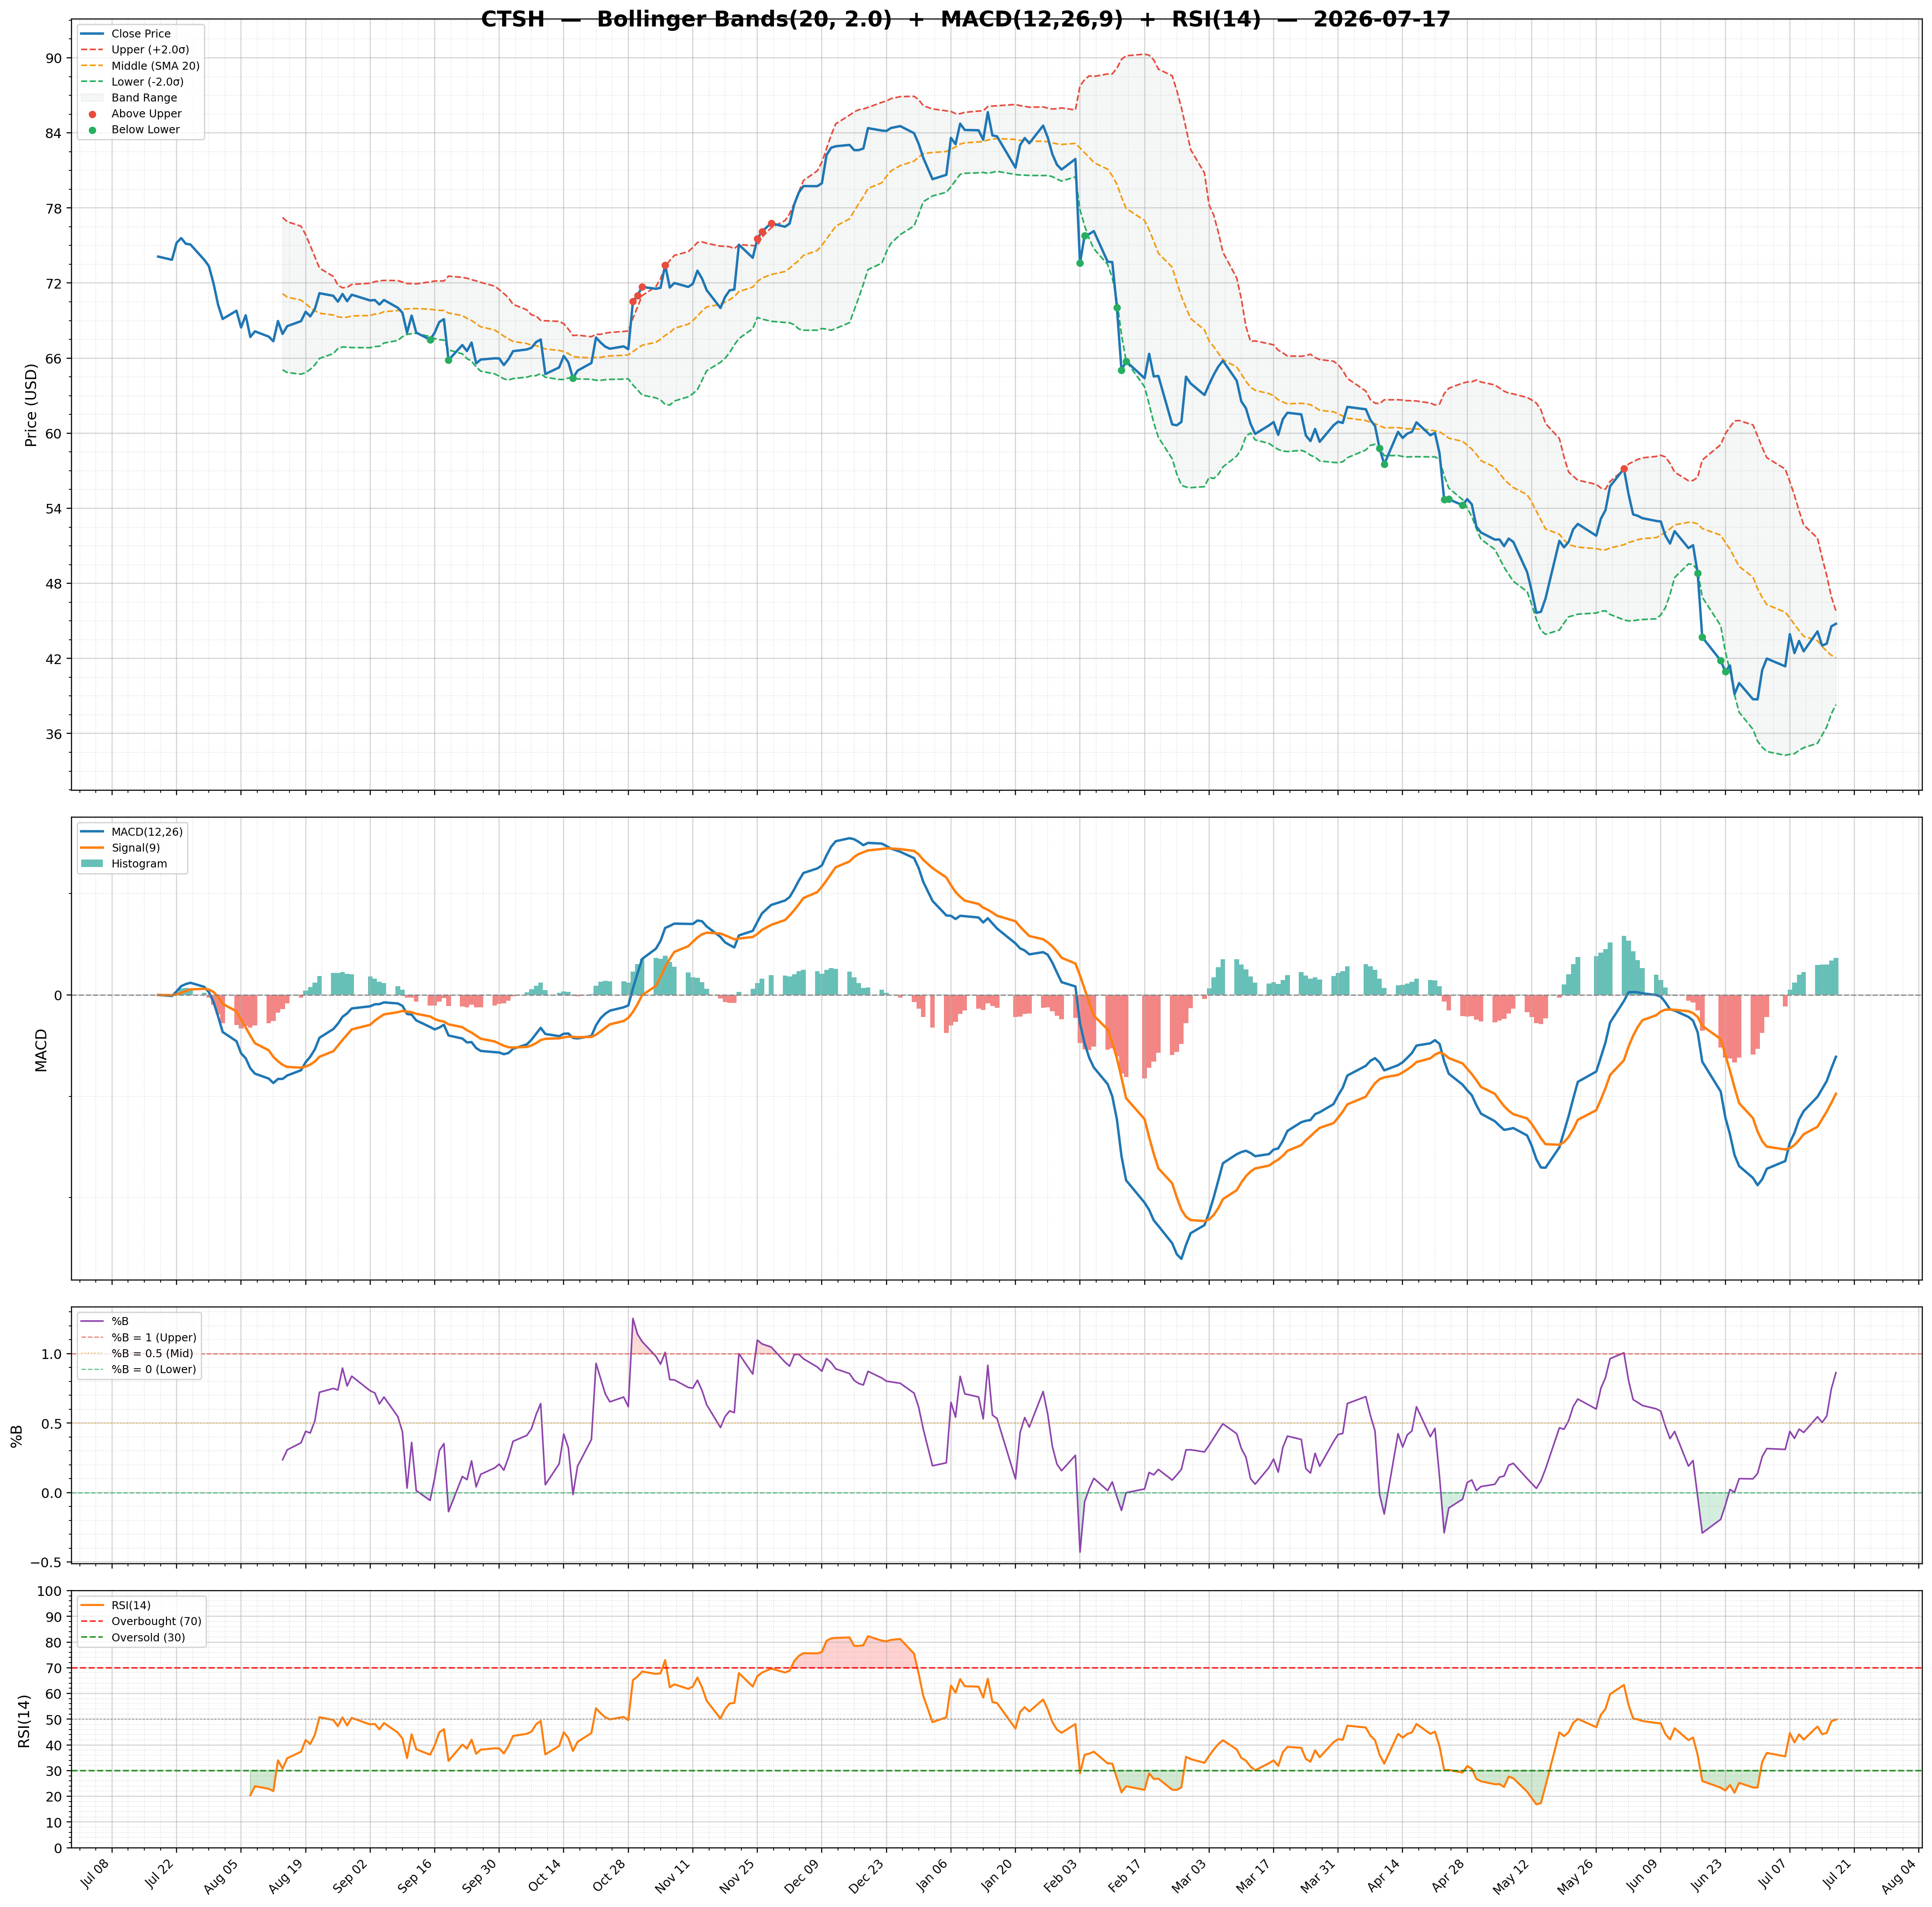
| 2026-07-17 | CTSH | 44.77 | / | 12.87% | buy | 9,368,851/14,612,498 | 17.79/0.86 | 49.85/0.7300 | -0.34 | -1.22/-1.95 | Chart 3M 🌐 |
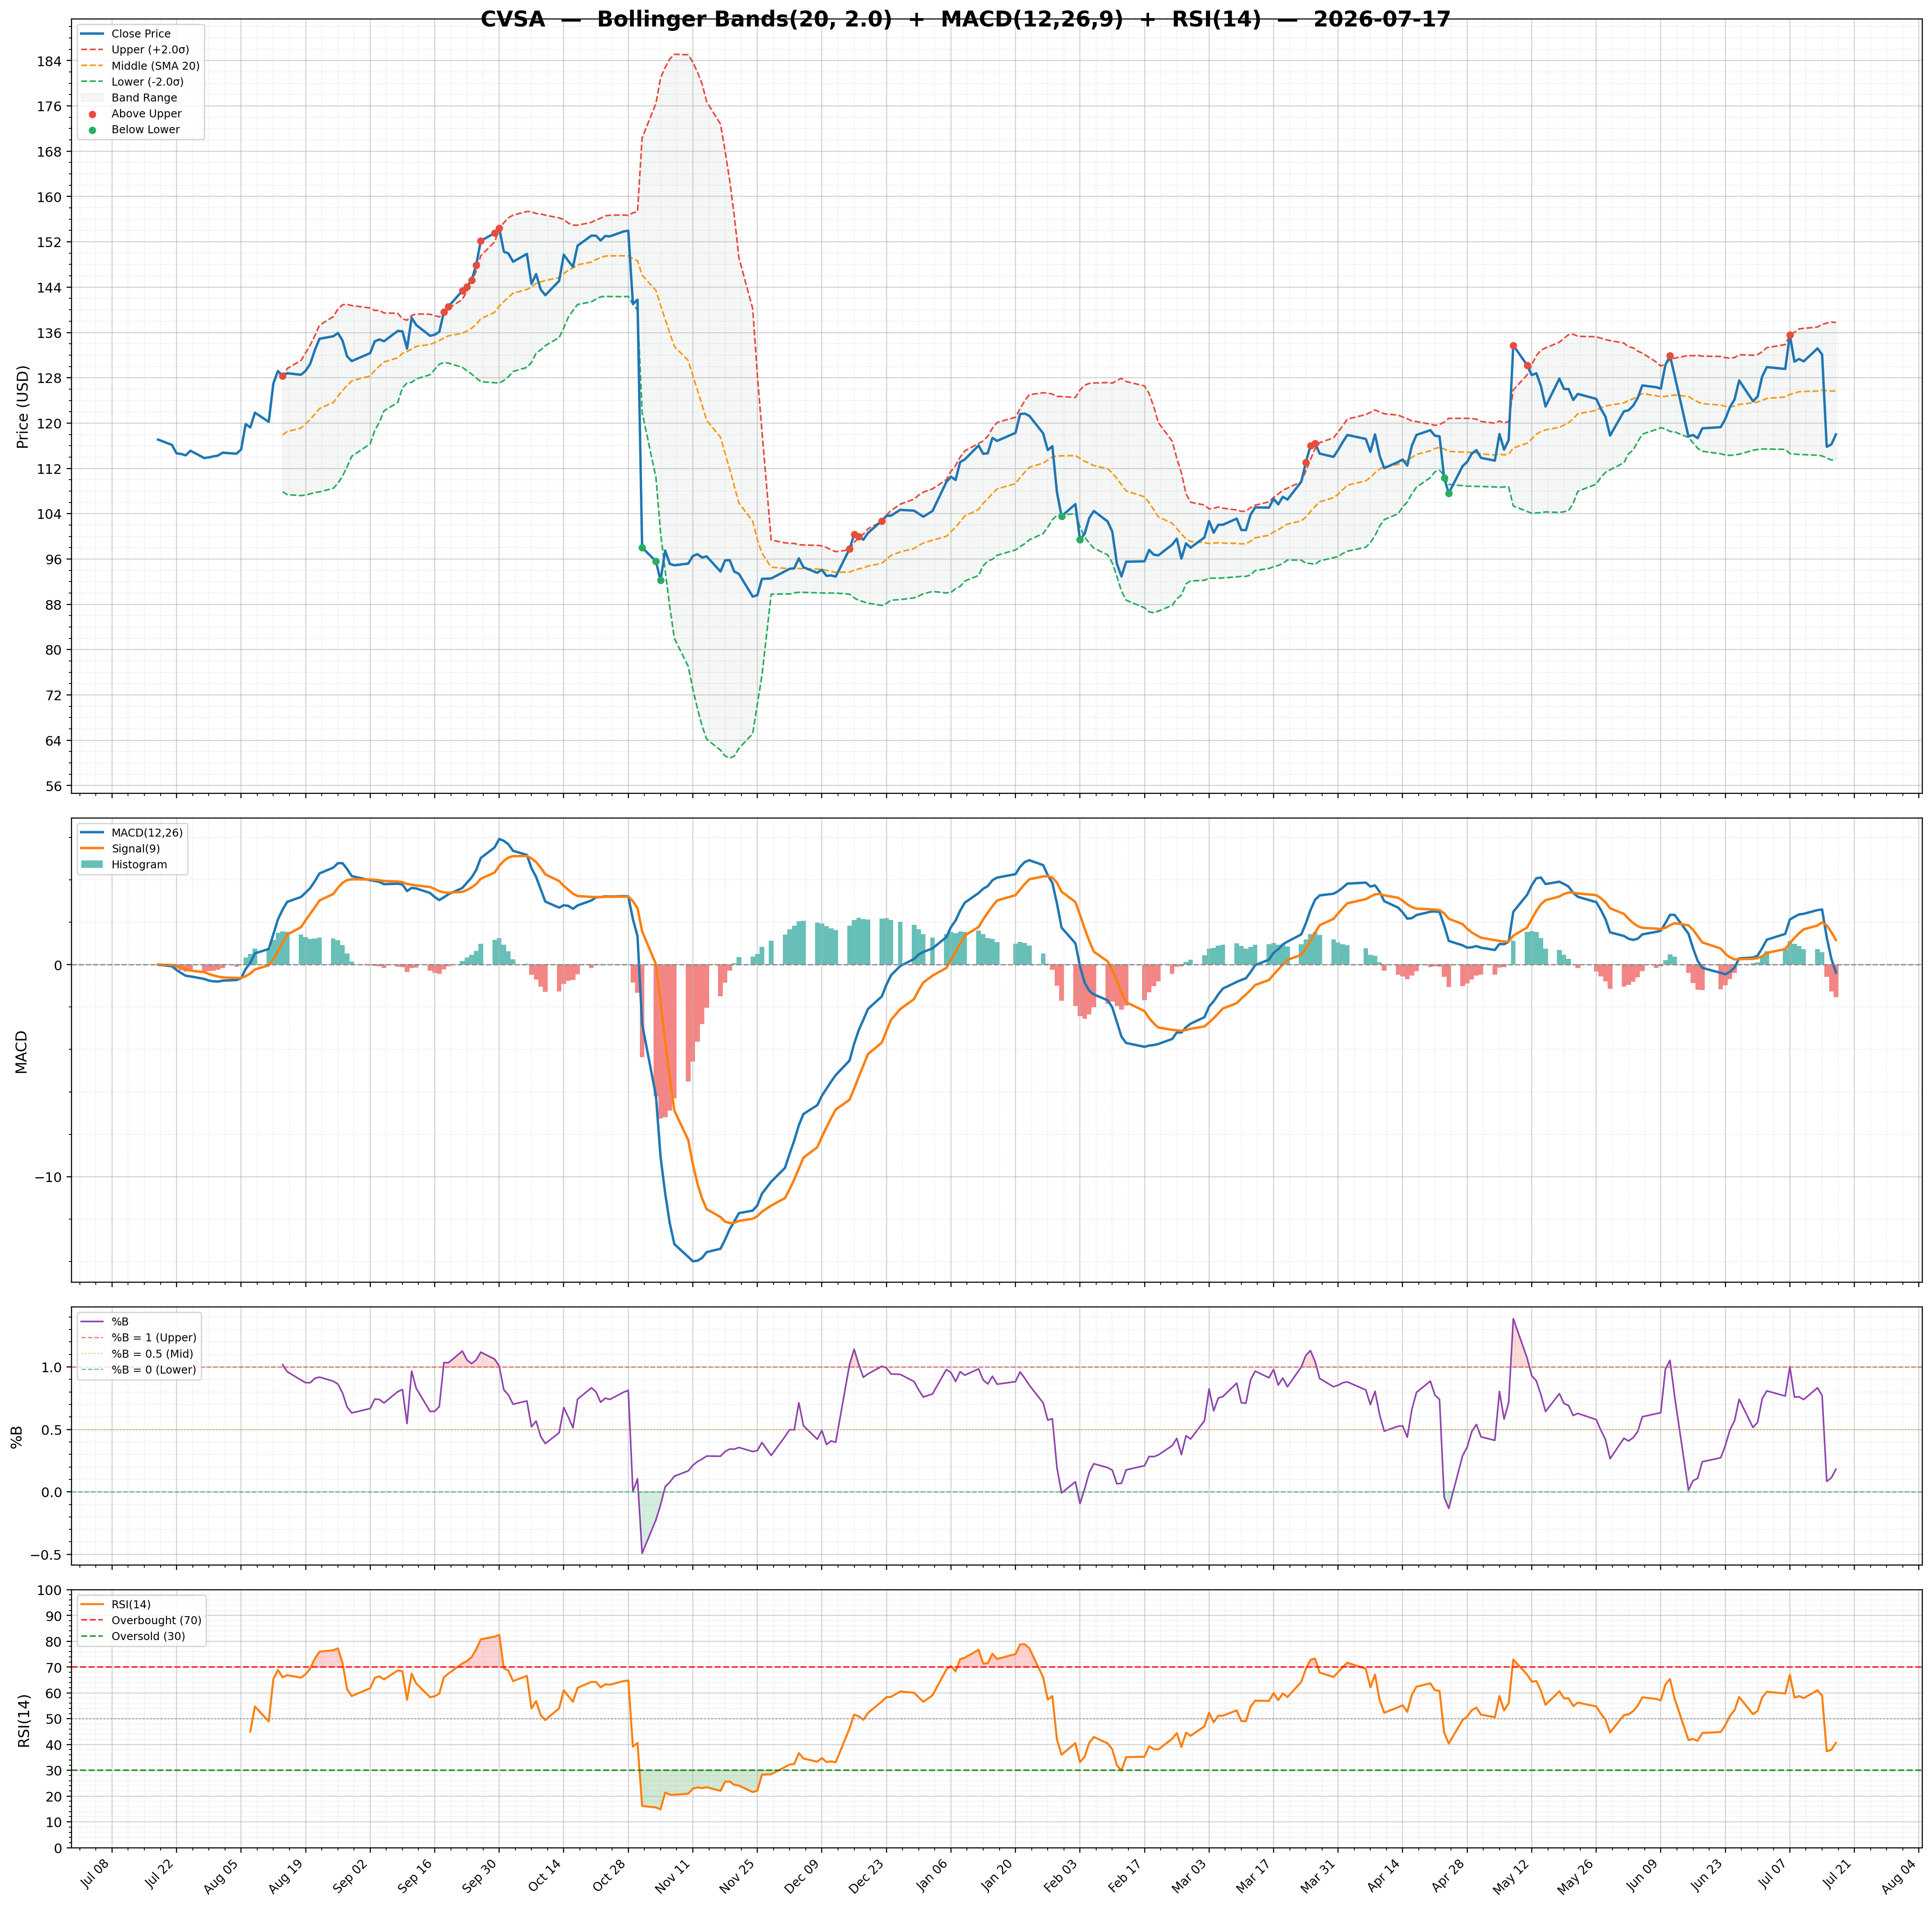
| 2026-07-17 | CVSA | 118.00 | / | 44.00% | none | 489,310/407,356 | 19.22/0.18 | 40.69/-1.5300 | -0.03 | -0.37/1.16 | Chart 3M 🌐 |
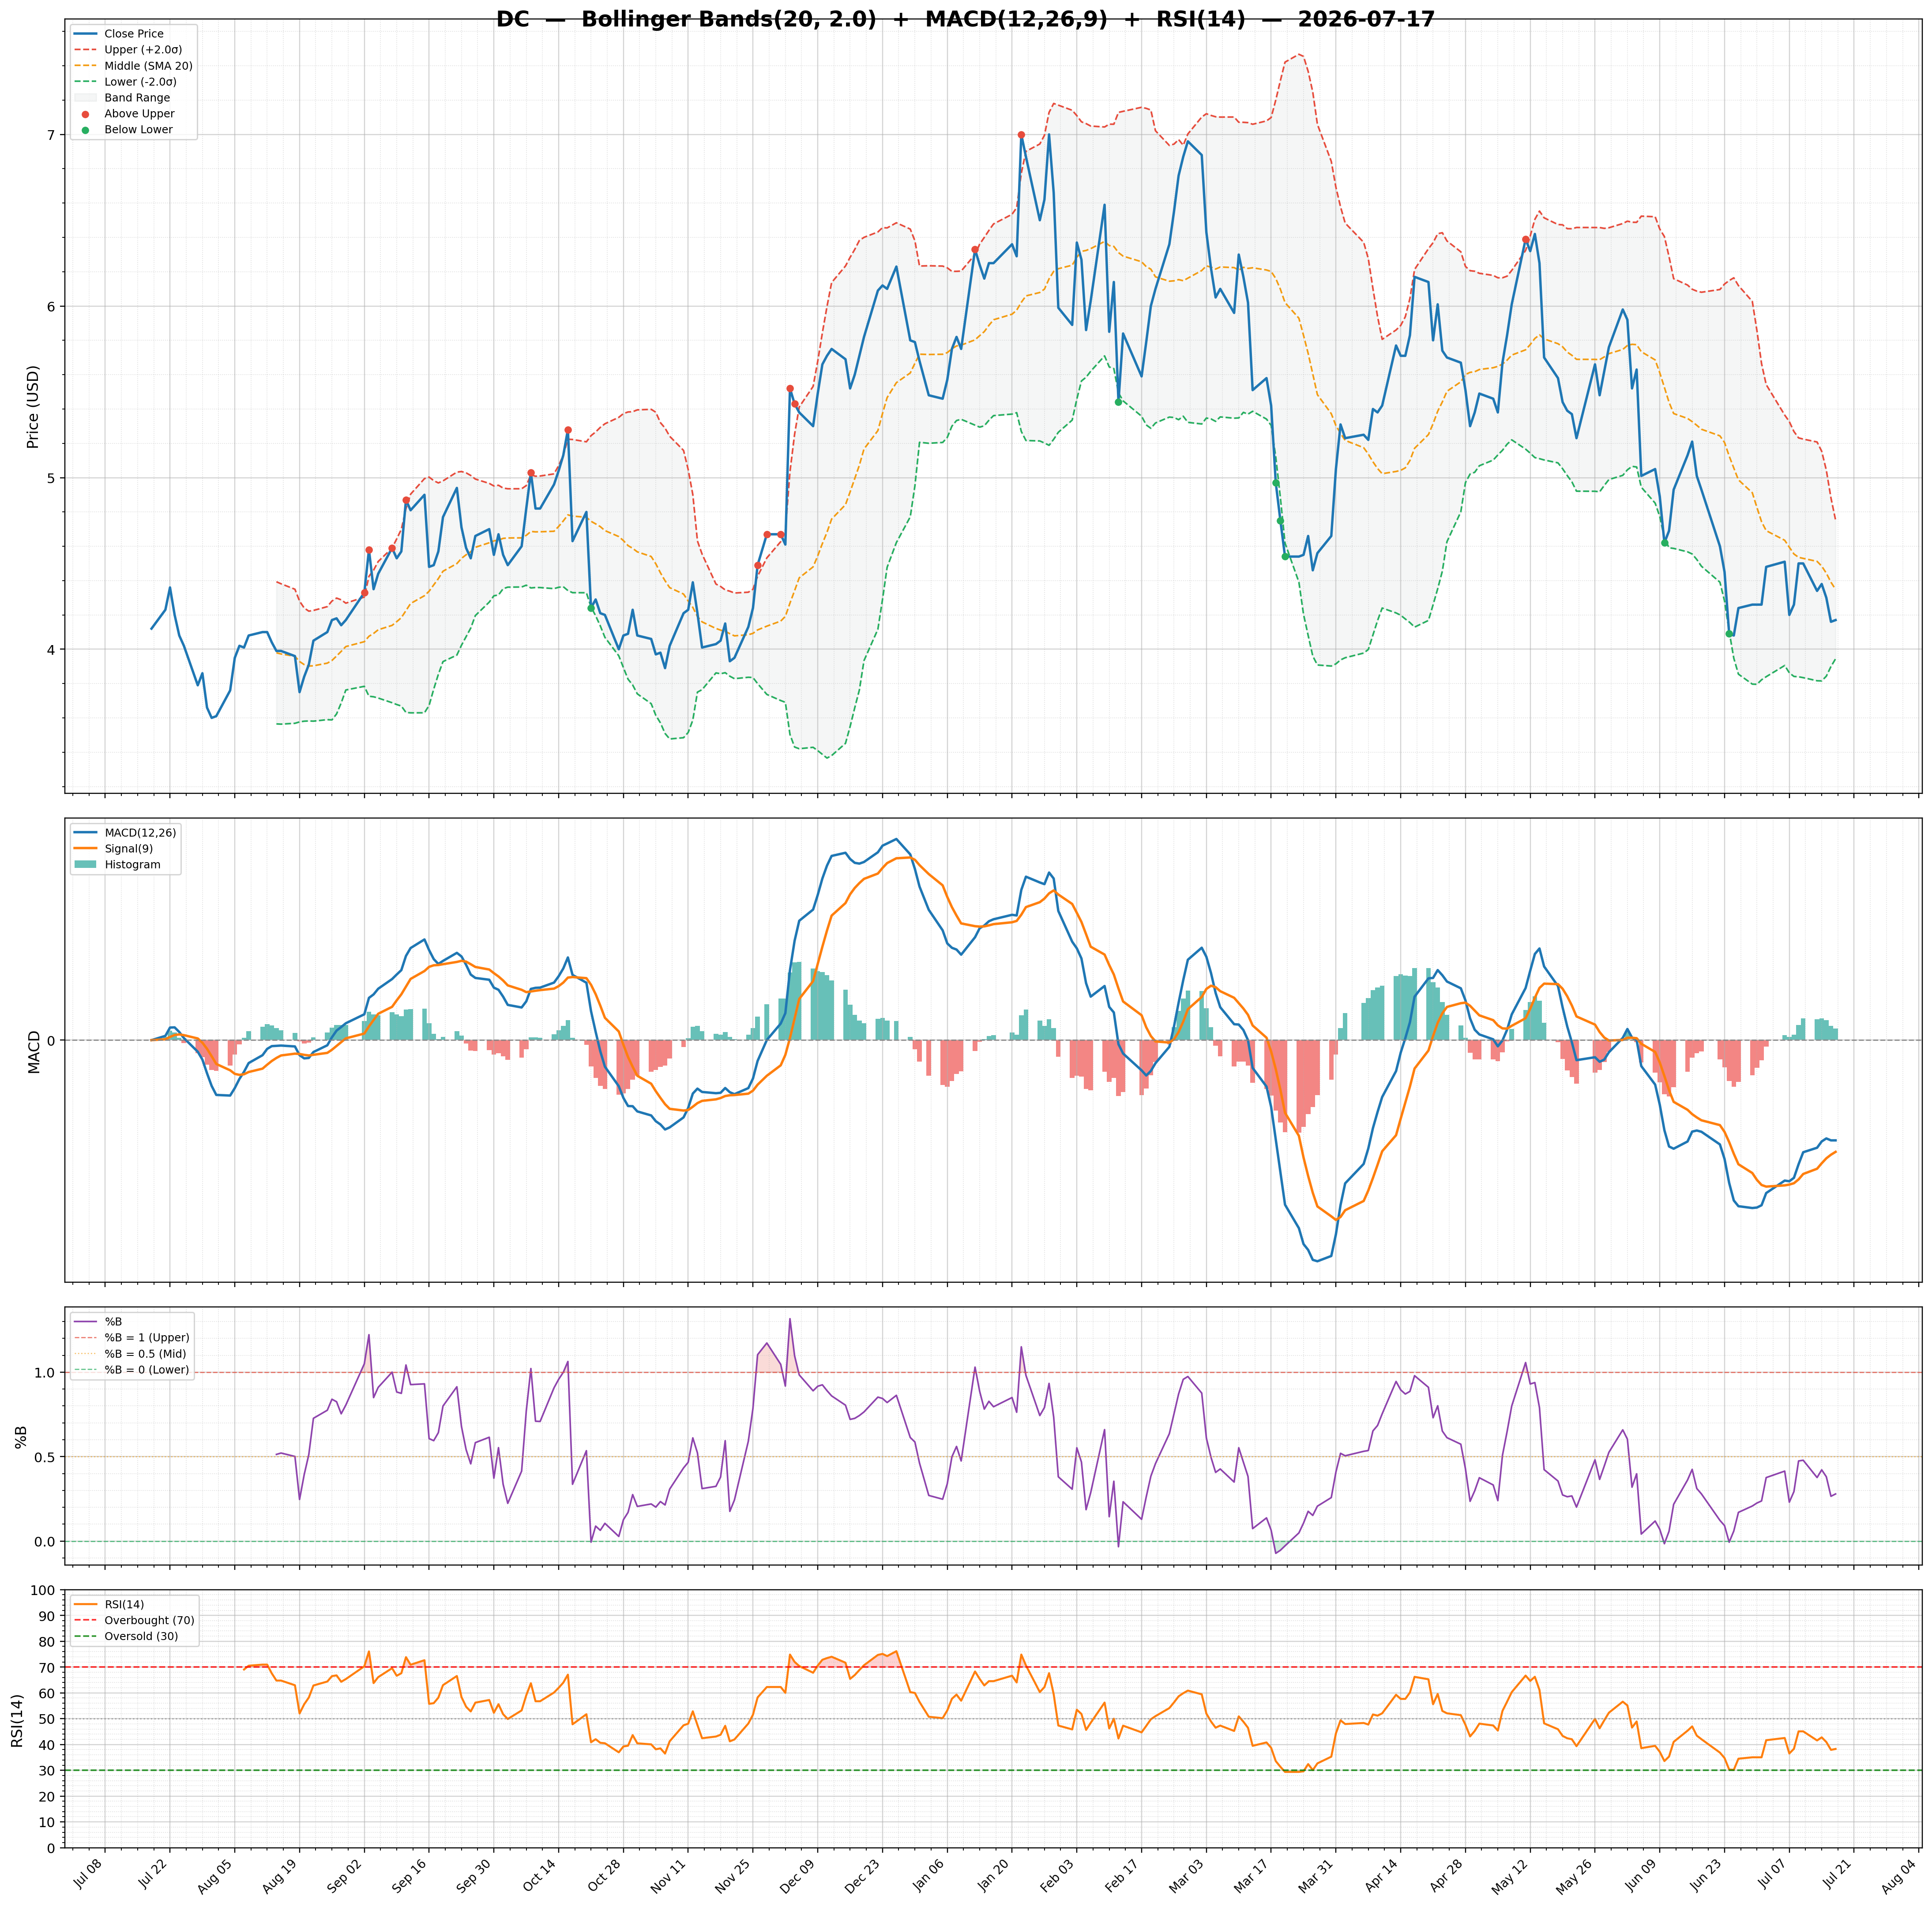
| 2026-07-17 | DC | 4.17 | / | 16.76% | strong_buy | 1,029,767/1,900,783 | 18.59/0.28 | 38.28/0.0200 | -0.22 | -0.21/-0.23 | Chart 3M 🌐 |
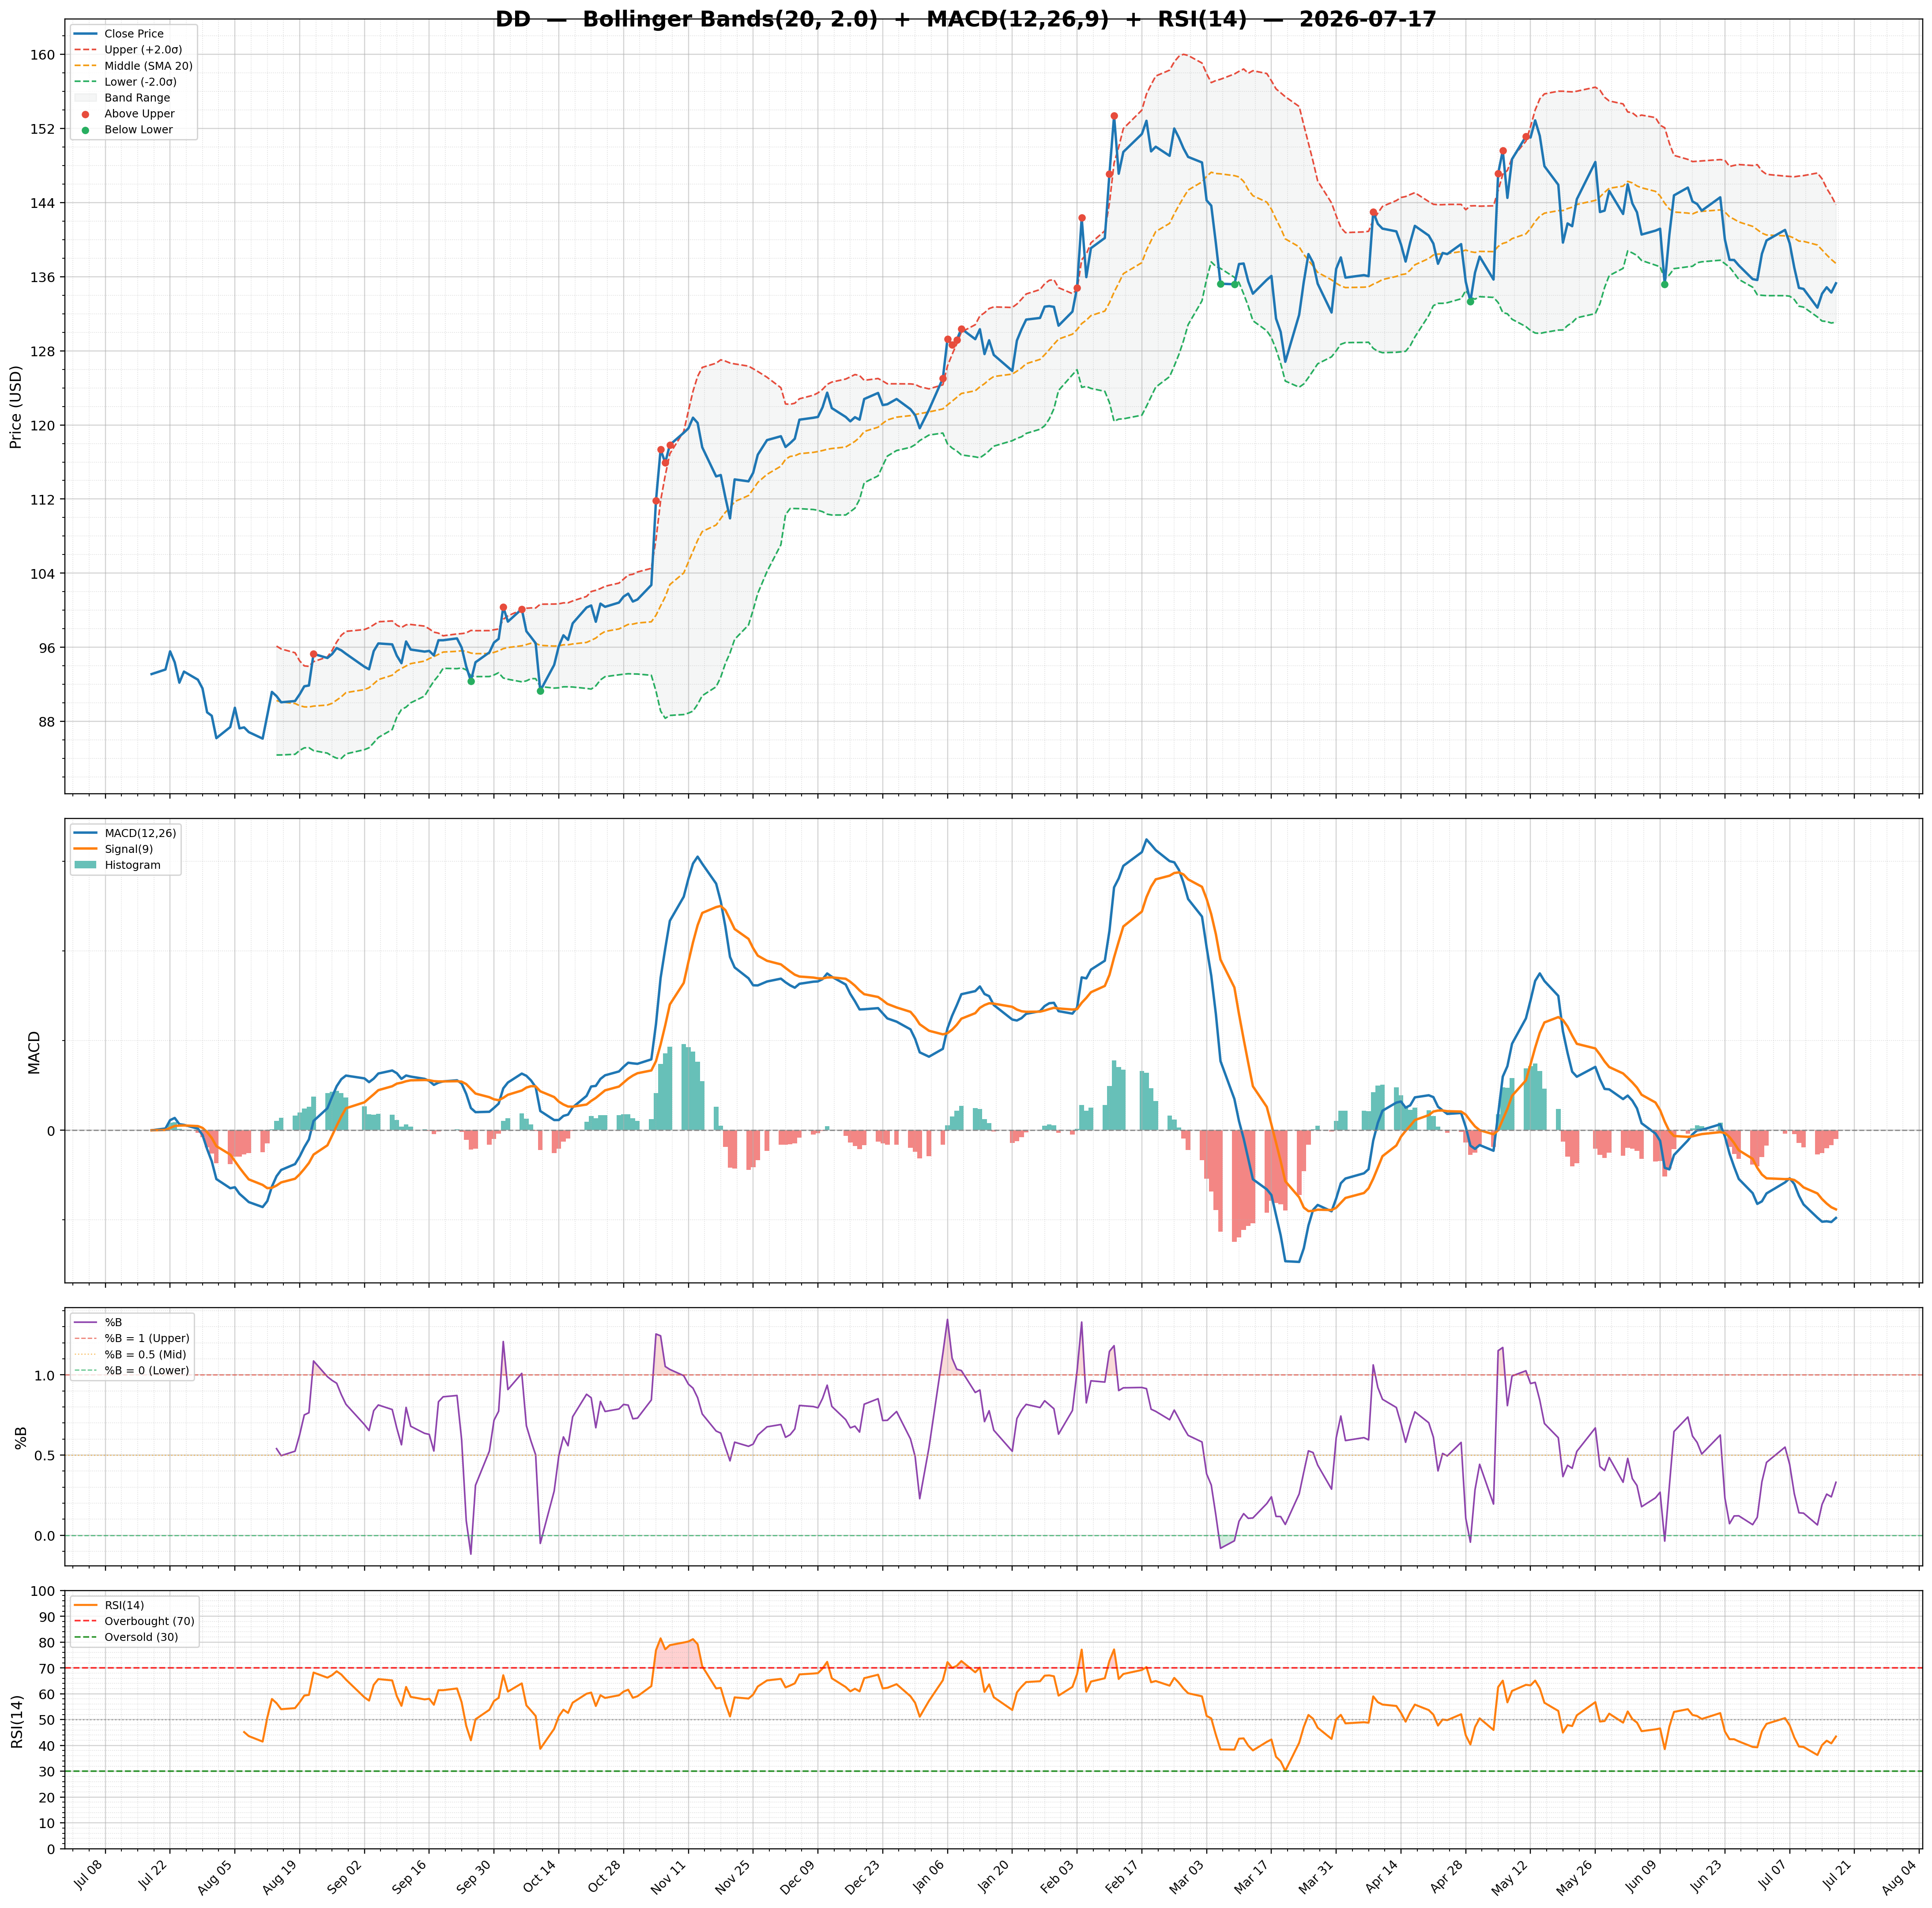
| 2026-07-17 | DD | 135.29 | / | 73.11% | buy | 941,492/1,490,893 | 9.22/0.33 | 43.46/-0.1900 | 0.17 | -1.96/-1.76 | Chart 3M 🌐 |
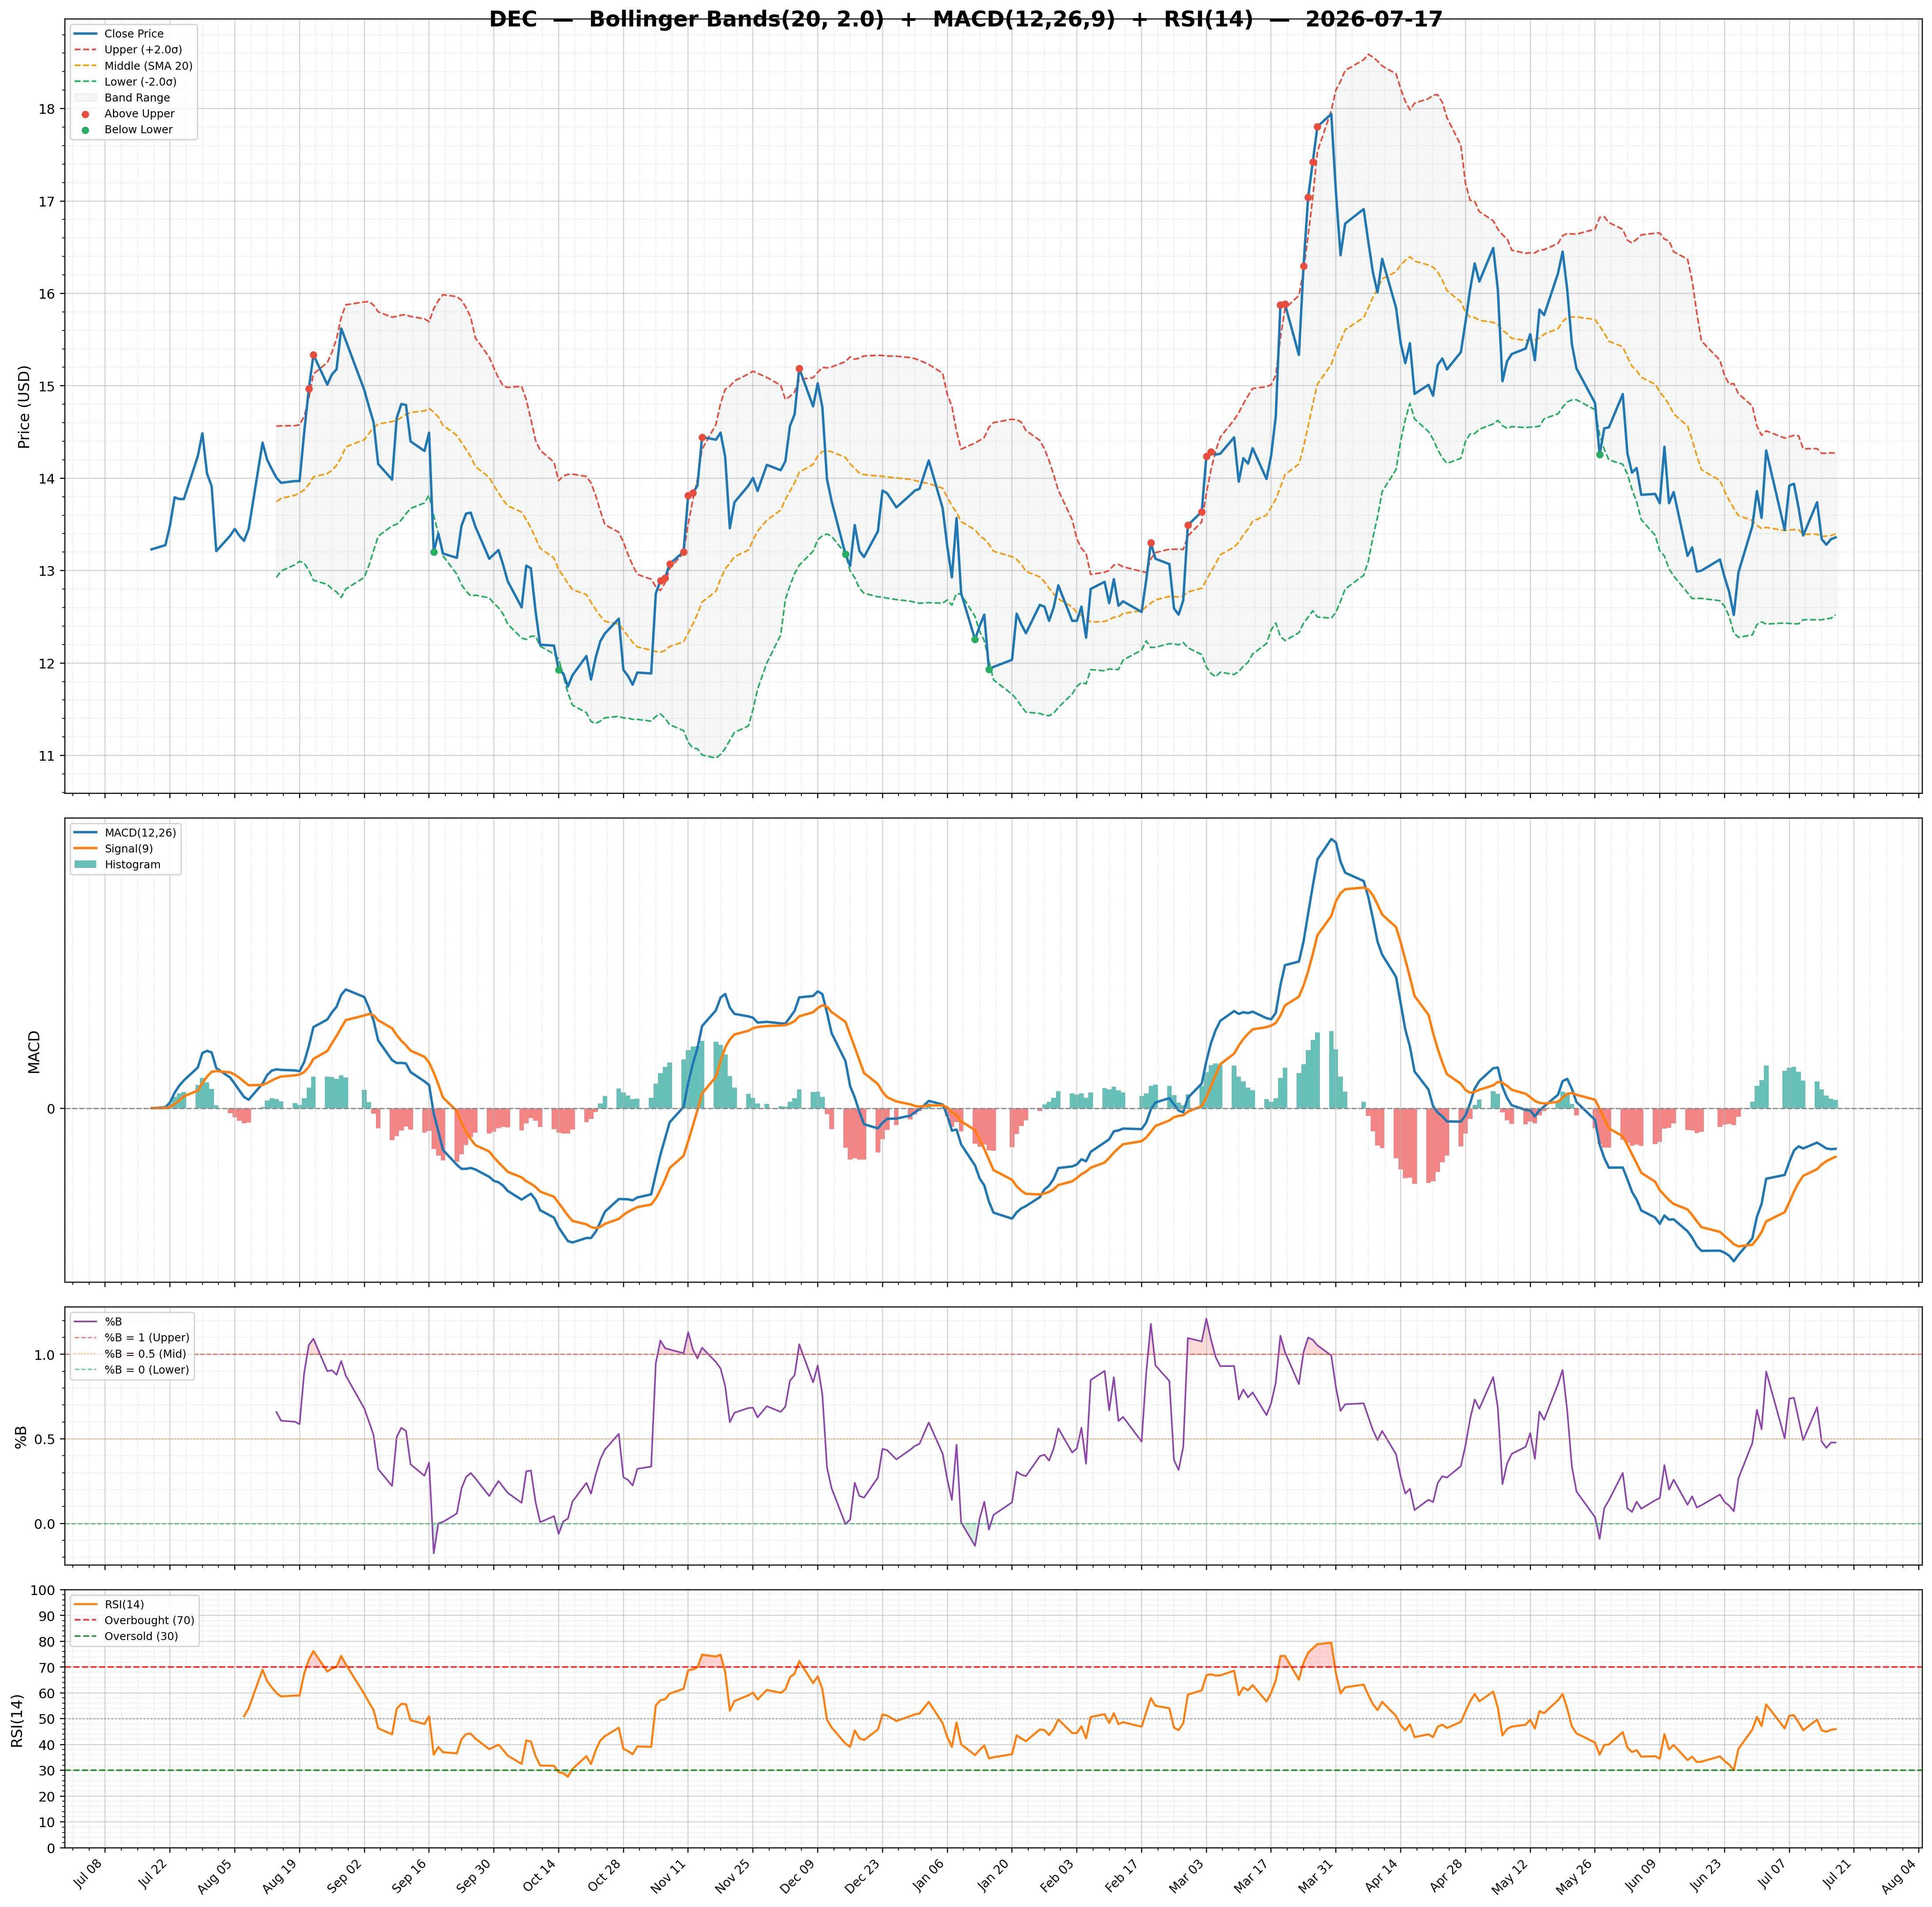
| 2026-07-17 | DEC | 13.36 | / | 26.01% | strong_buy | 498,658/1,352,178 | 13.08/0.48 | 45.97/0.0300 | -0.02 | -0.17/-0.20 | Chart 3M 🌐 |
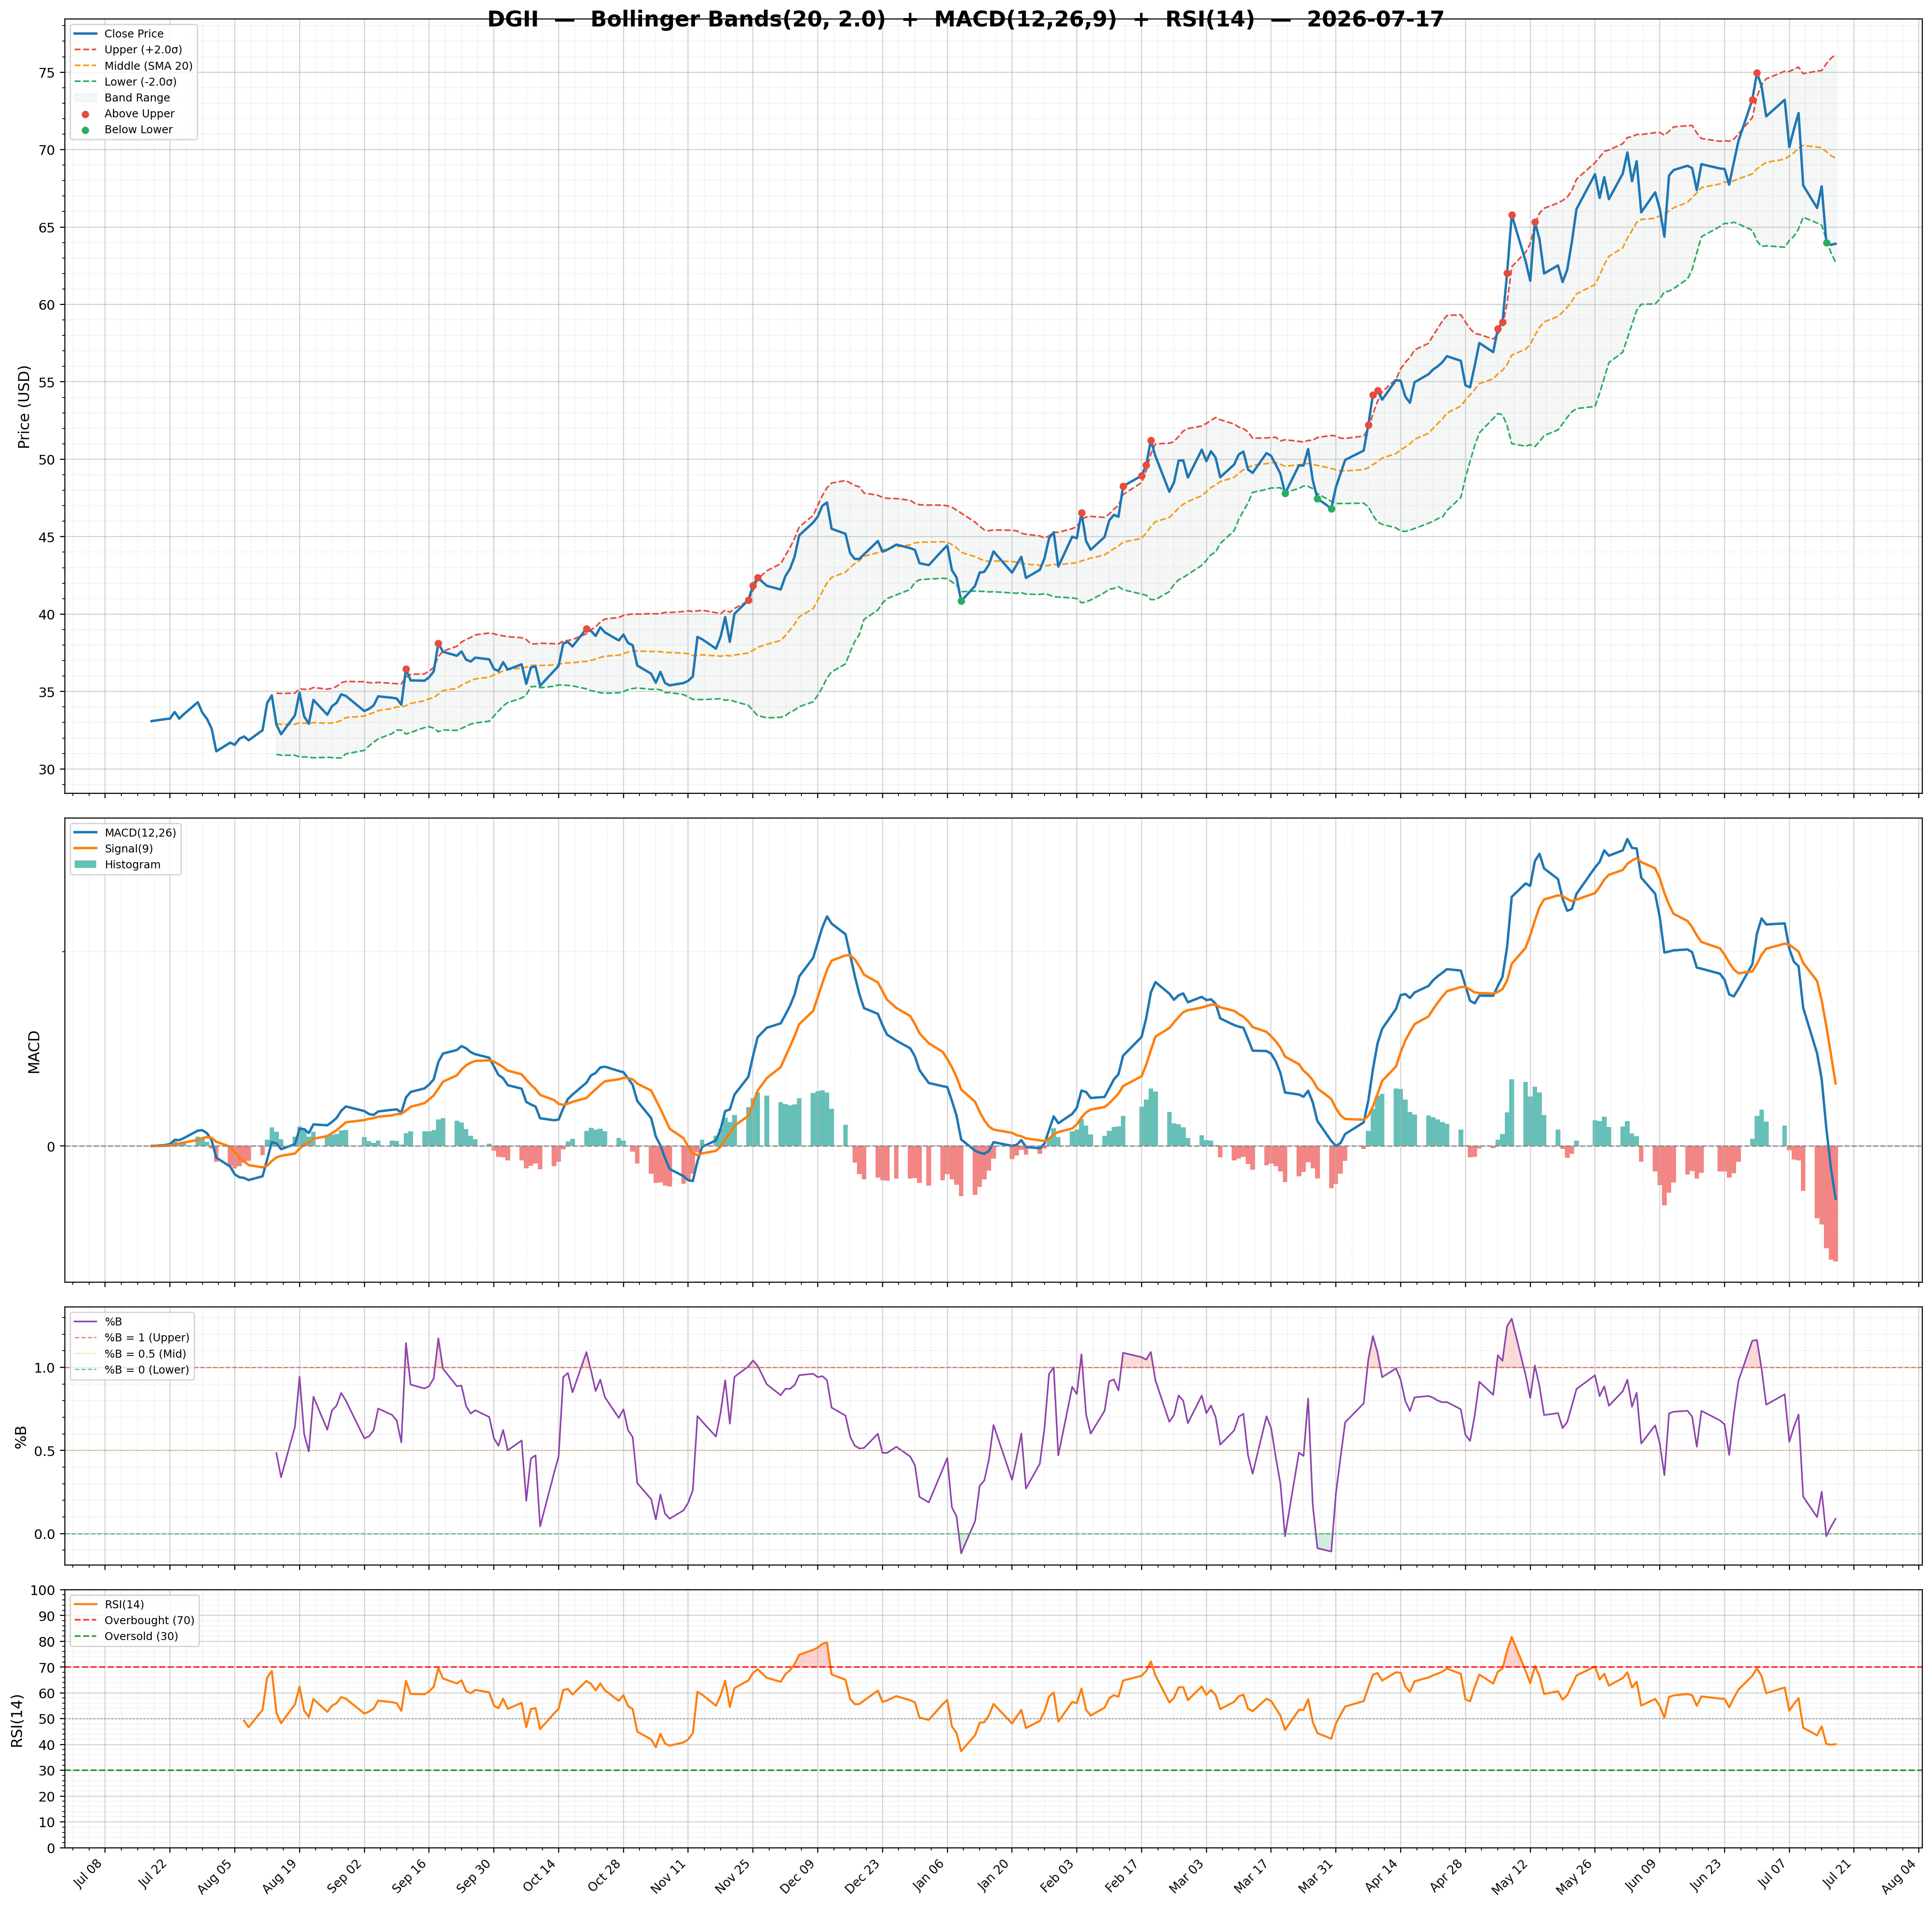
| 2026-07-17 | DGII | 63.92 | / | 74.82% | none | 308,416/504,941 | 19.34/0.09 | 40.11/-1.1900 | 0.51 | -0.54/0.64 | Chart 3M 🌐 |
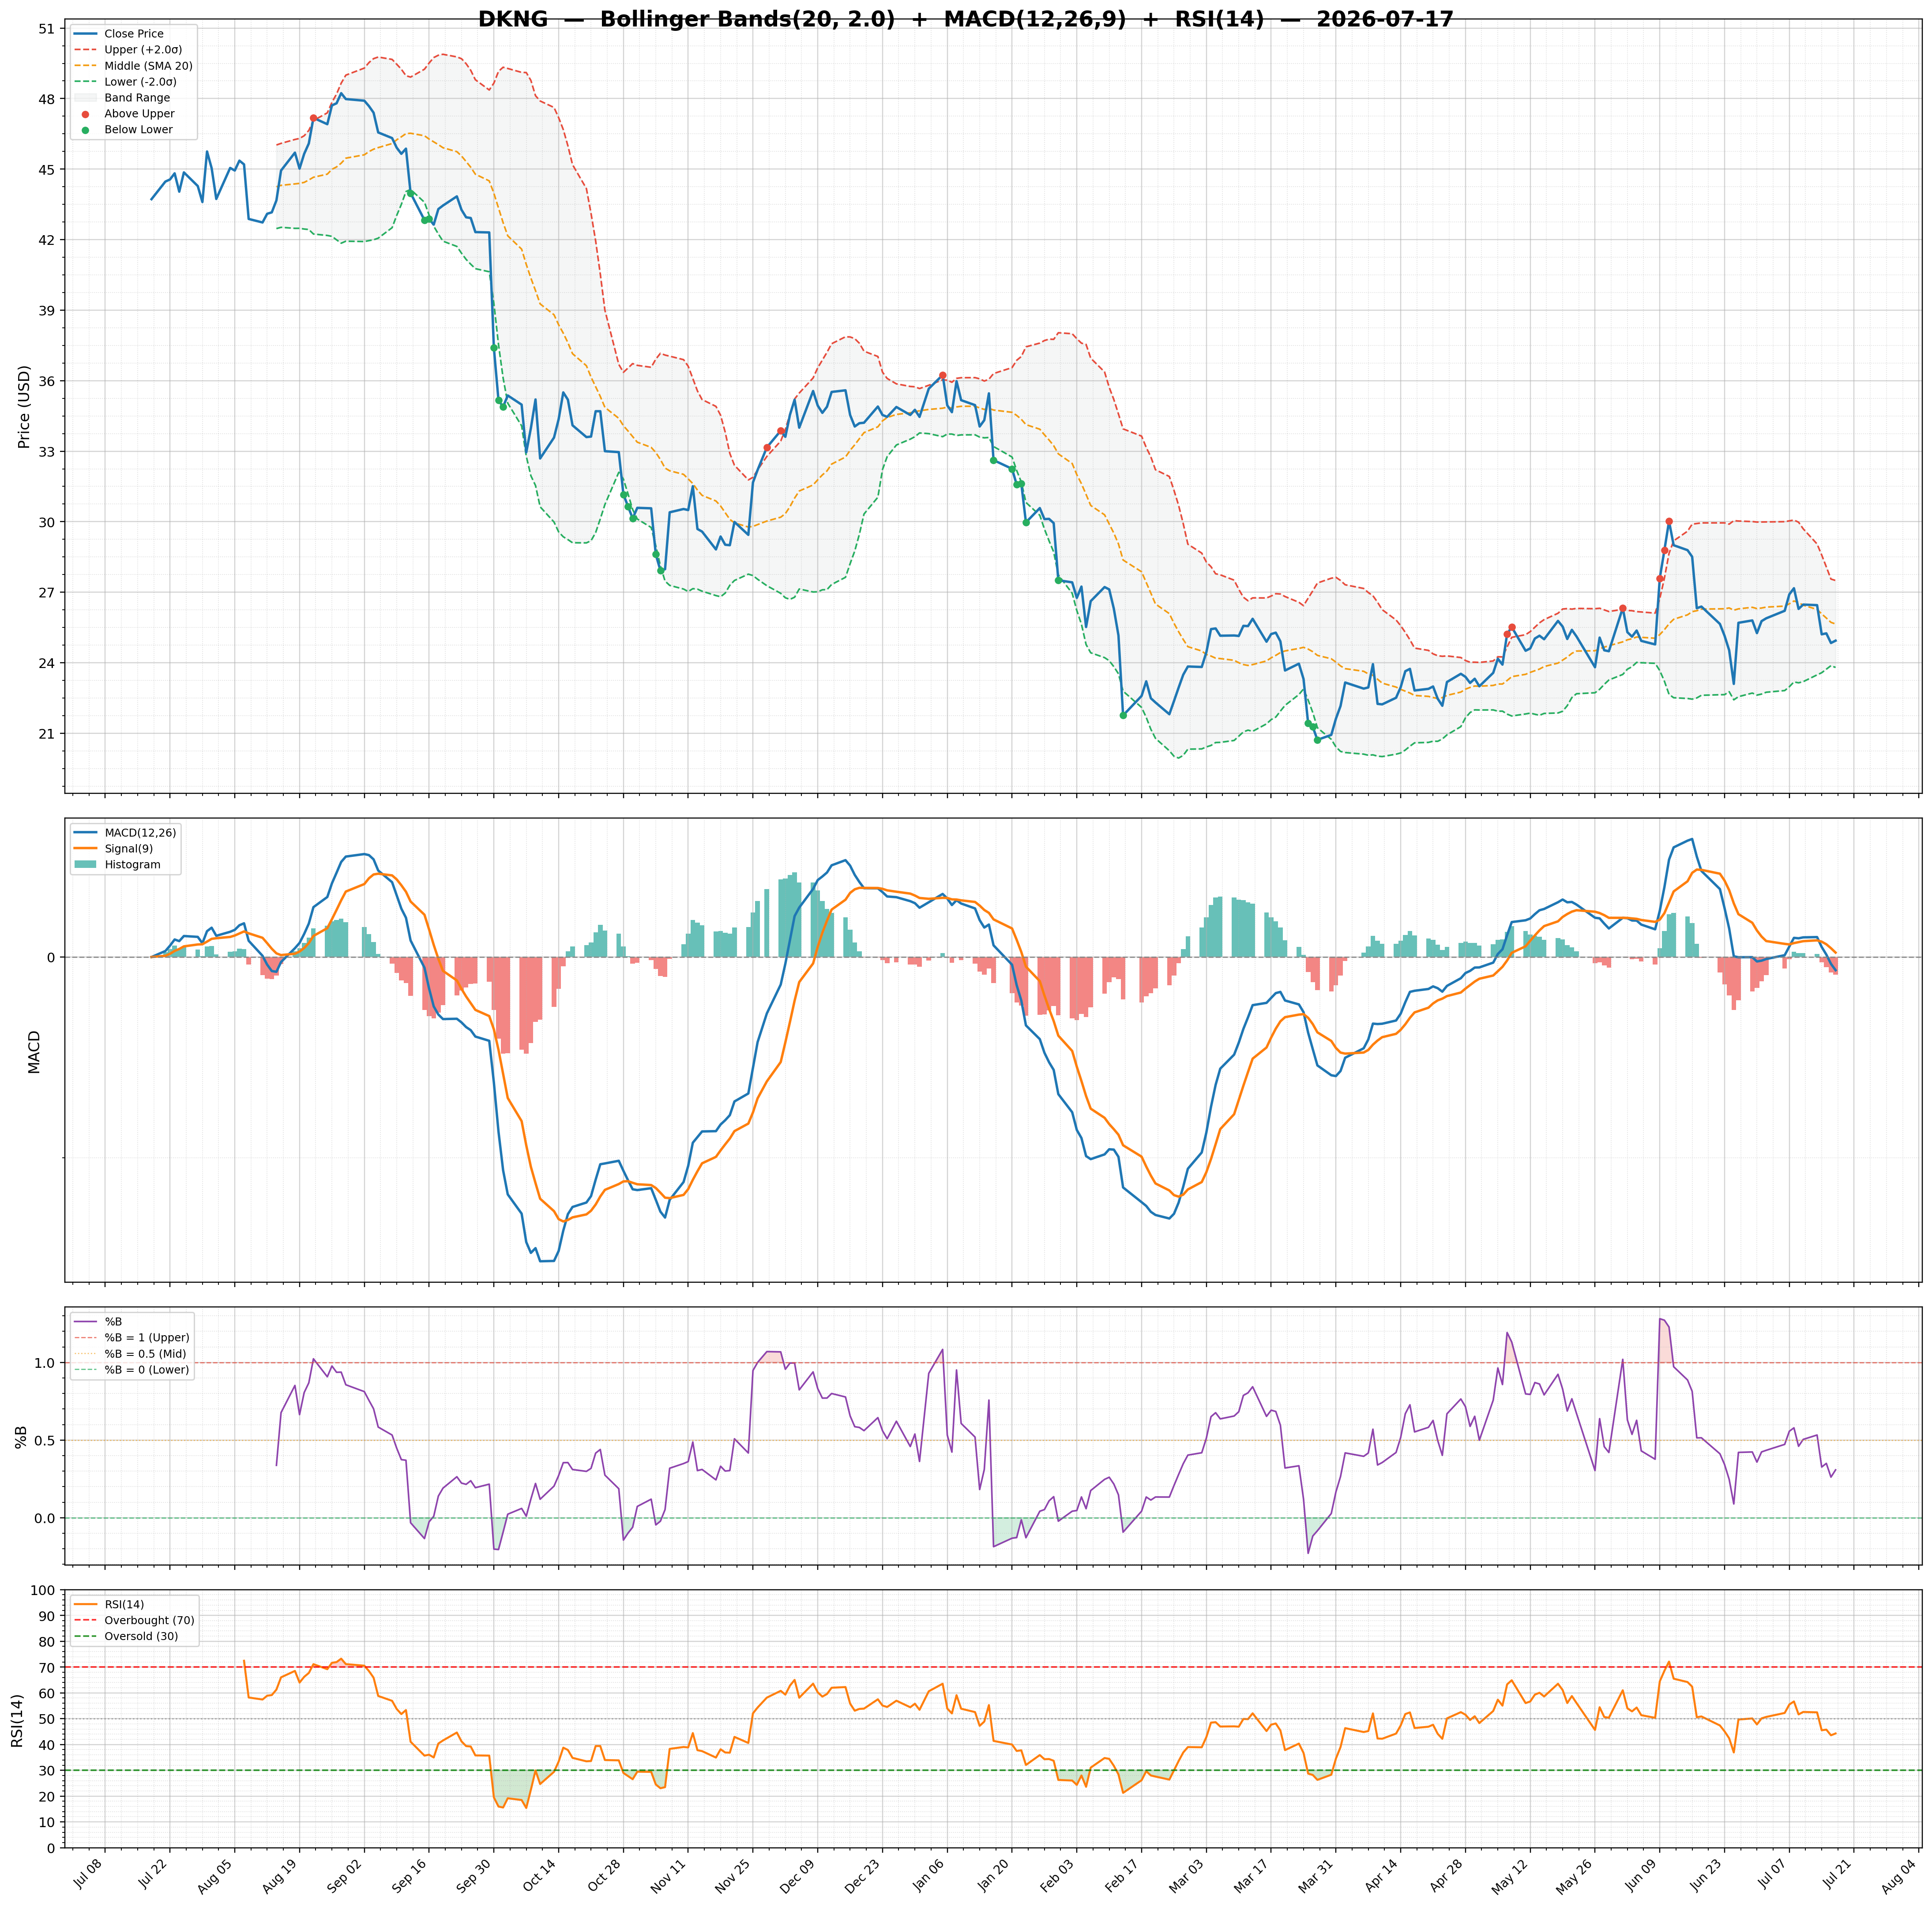
| 2026-07-17 | DKNG | 24.94 | / | 15.34% | buy | 12,667,702/11,276,385 | 14.43/0.31 | 44.28/-0.1800 | -0.18 | -0.13/0.04 | Chart 3M 🌐 |
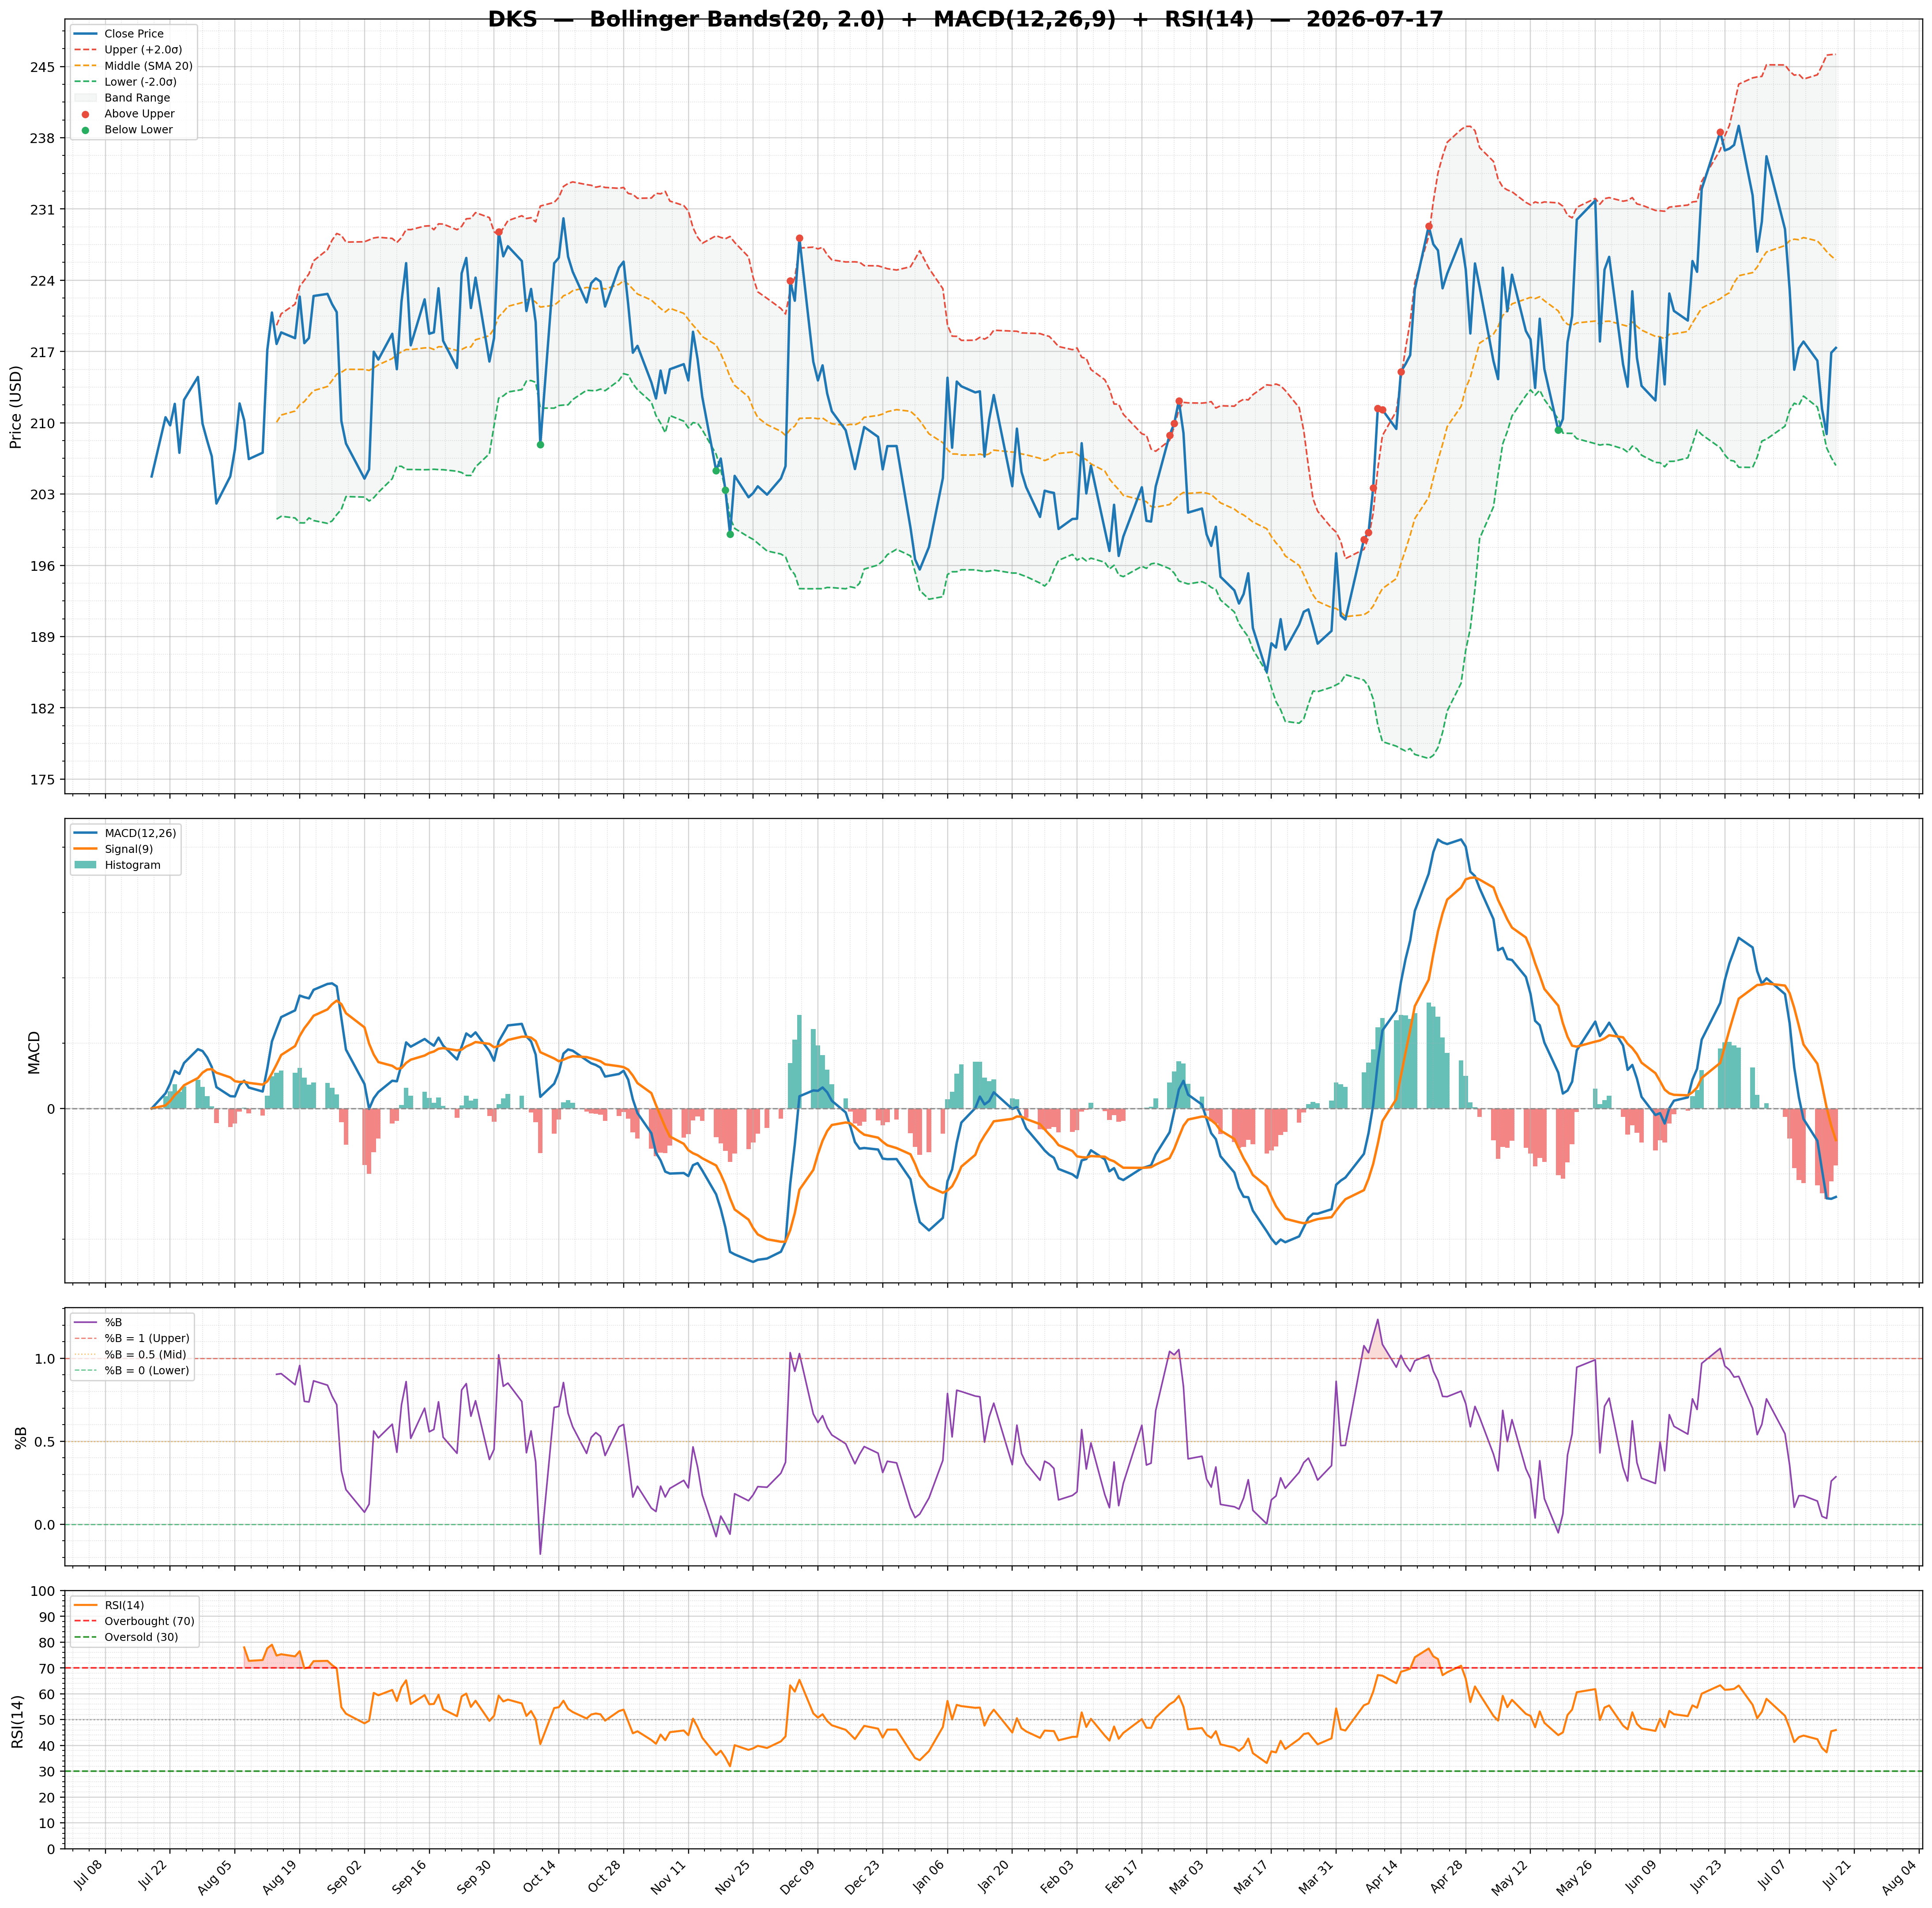
| 2026-07-17 | DKS | 217.36 | / | 59.35% | buy | 757,779/1,195,144 | 17.87/0.29 | 45.96/-1.7400 | 0.01 | -2.71/-0.97 | Chart 3M 🌐 |
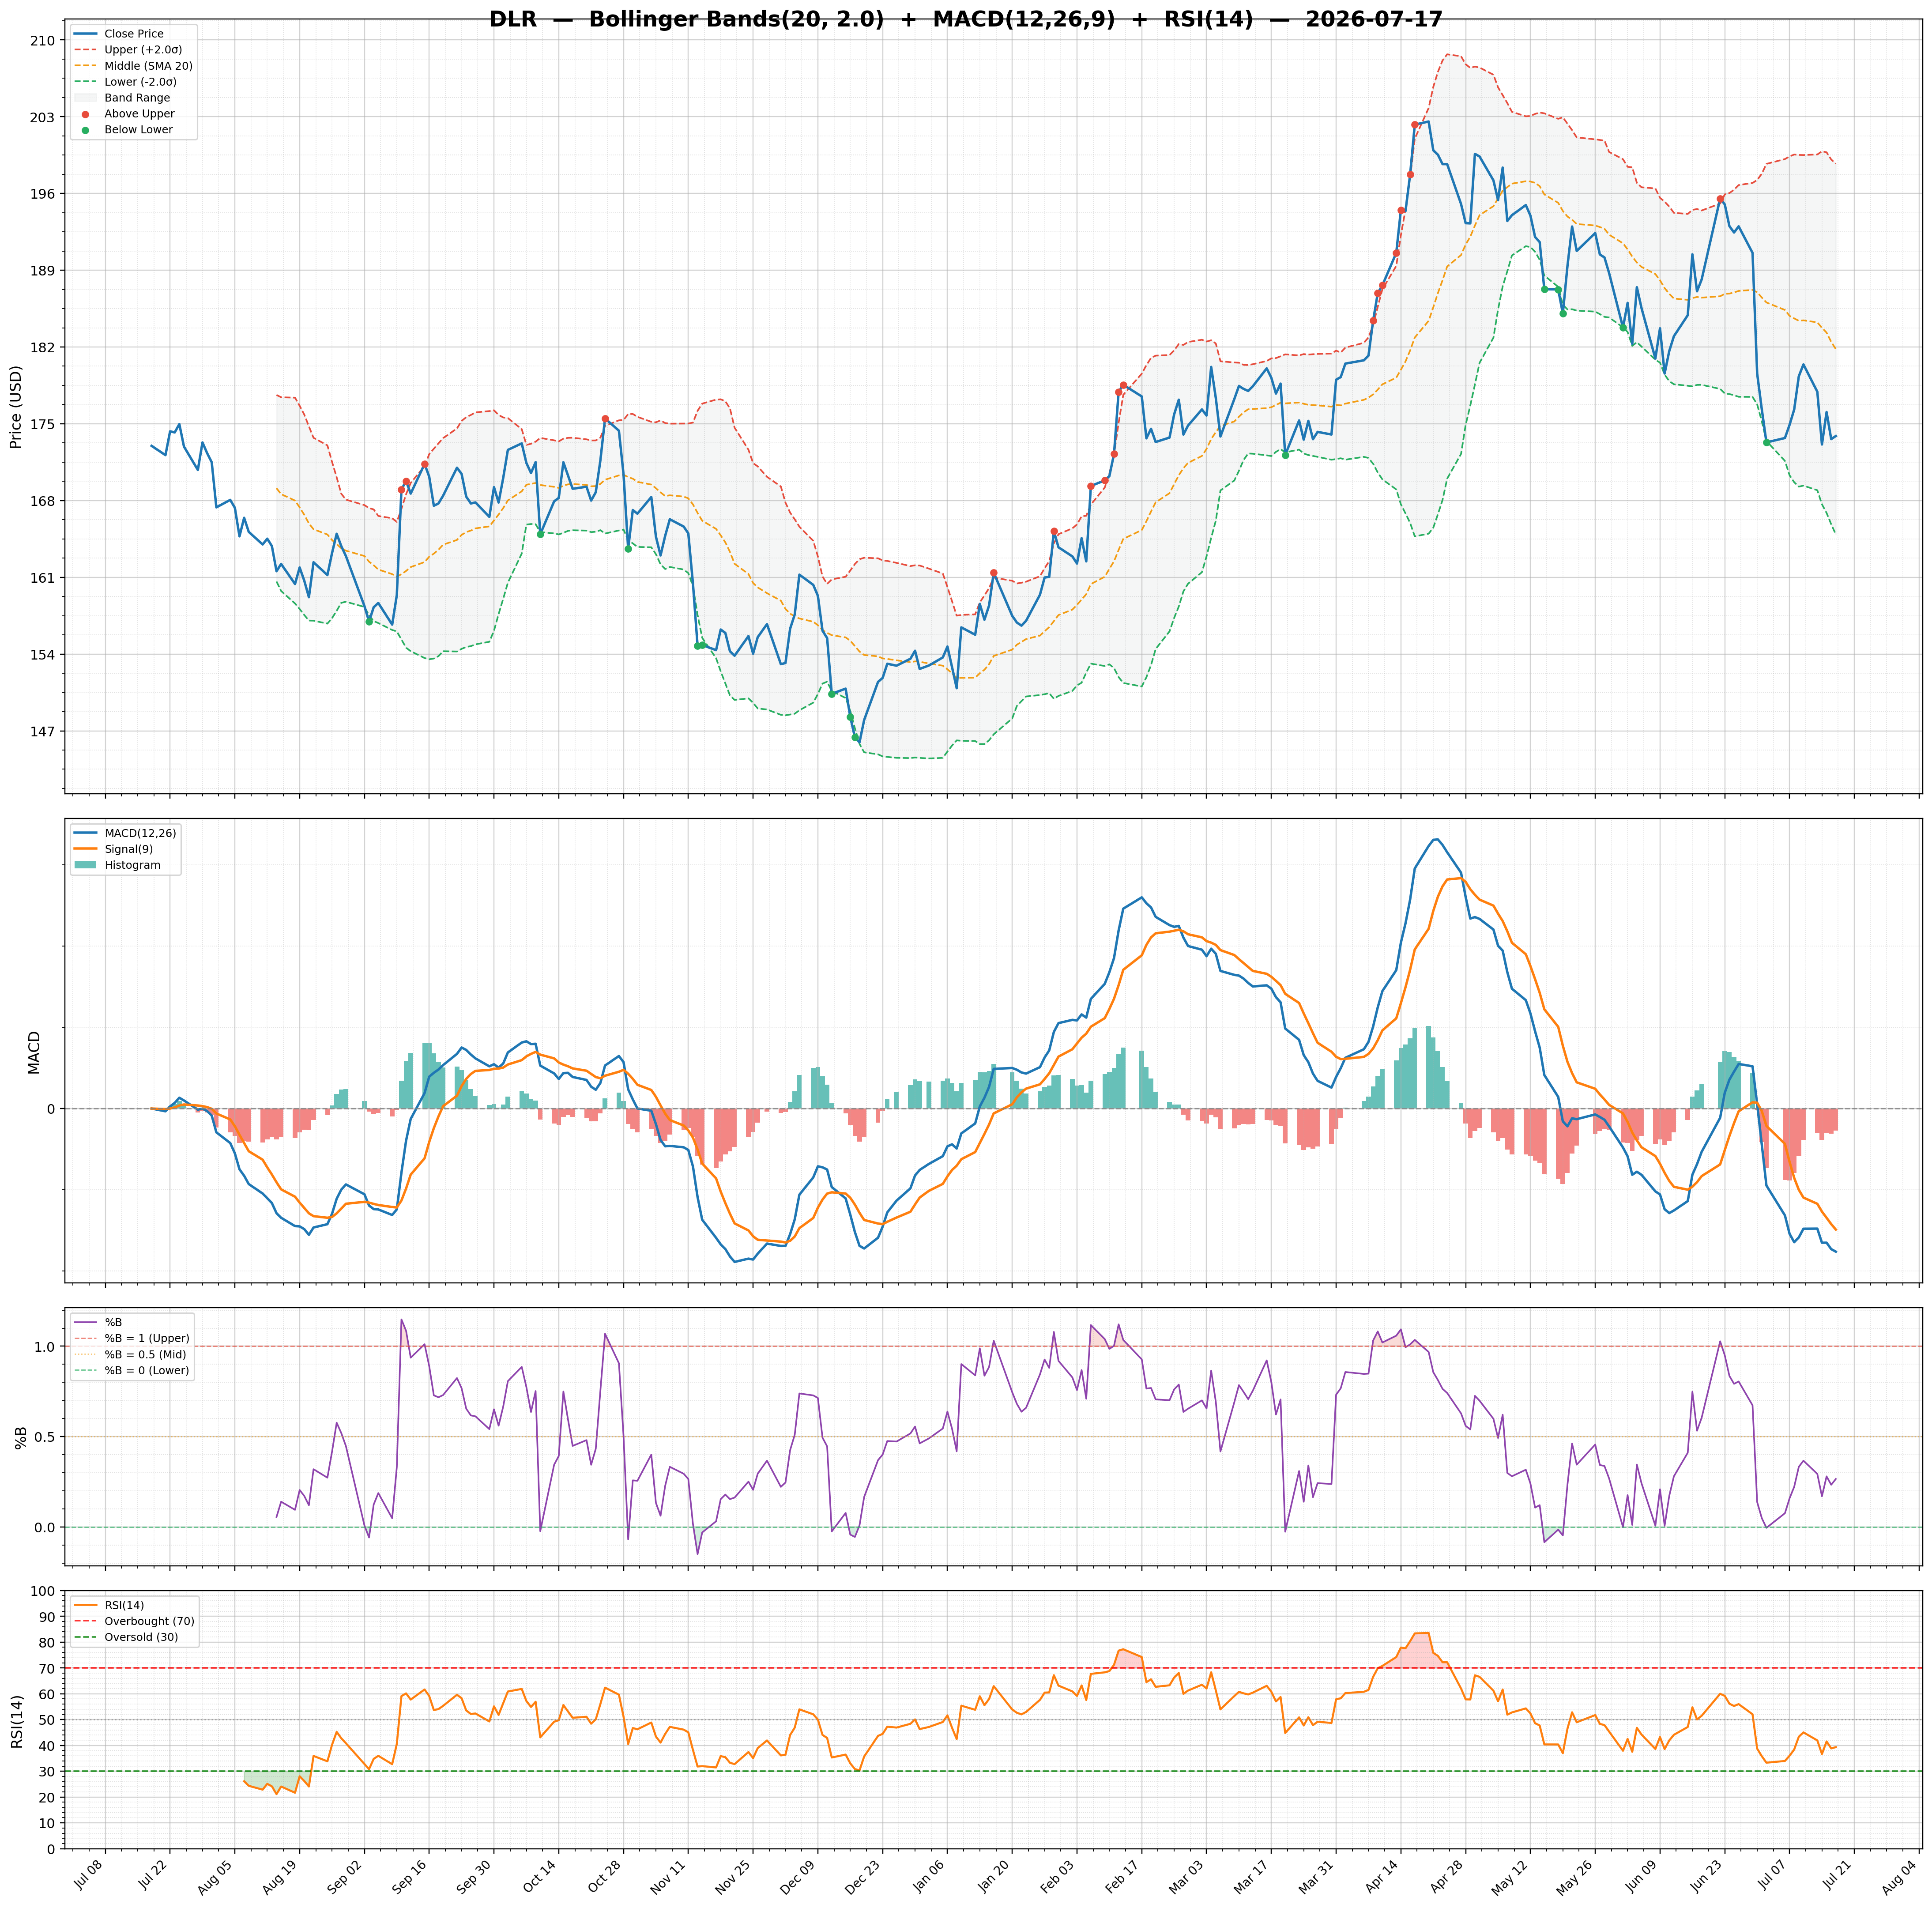
| 2026-07-17 | DLR | 173.88 | / | 49.33% | buy | 2,153,418/3,963,951 | 18.59/0.26 | 39.33/-0.5400 | -0.02 | -3.52/-2.98 | Chart 3M 🌐 |
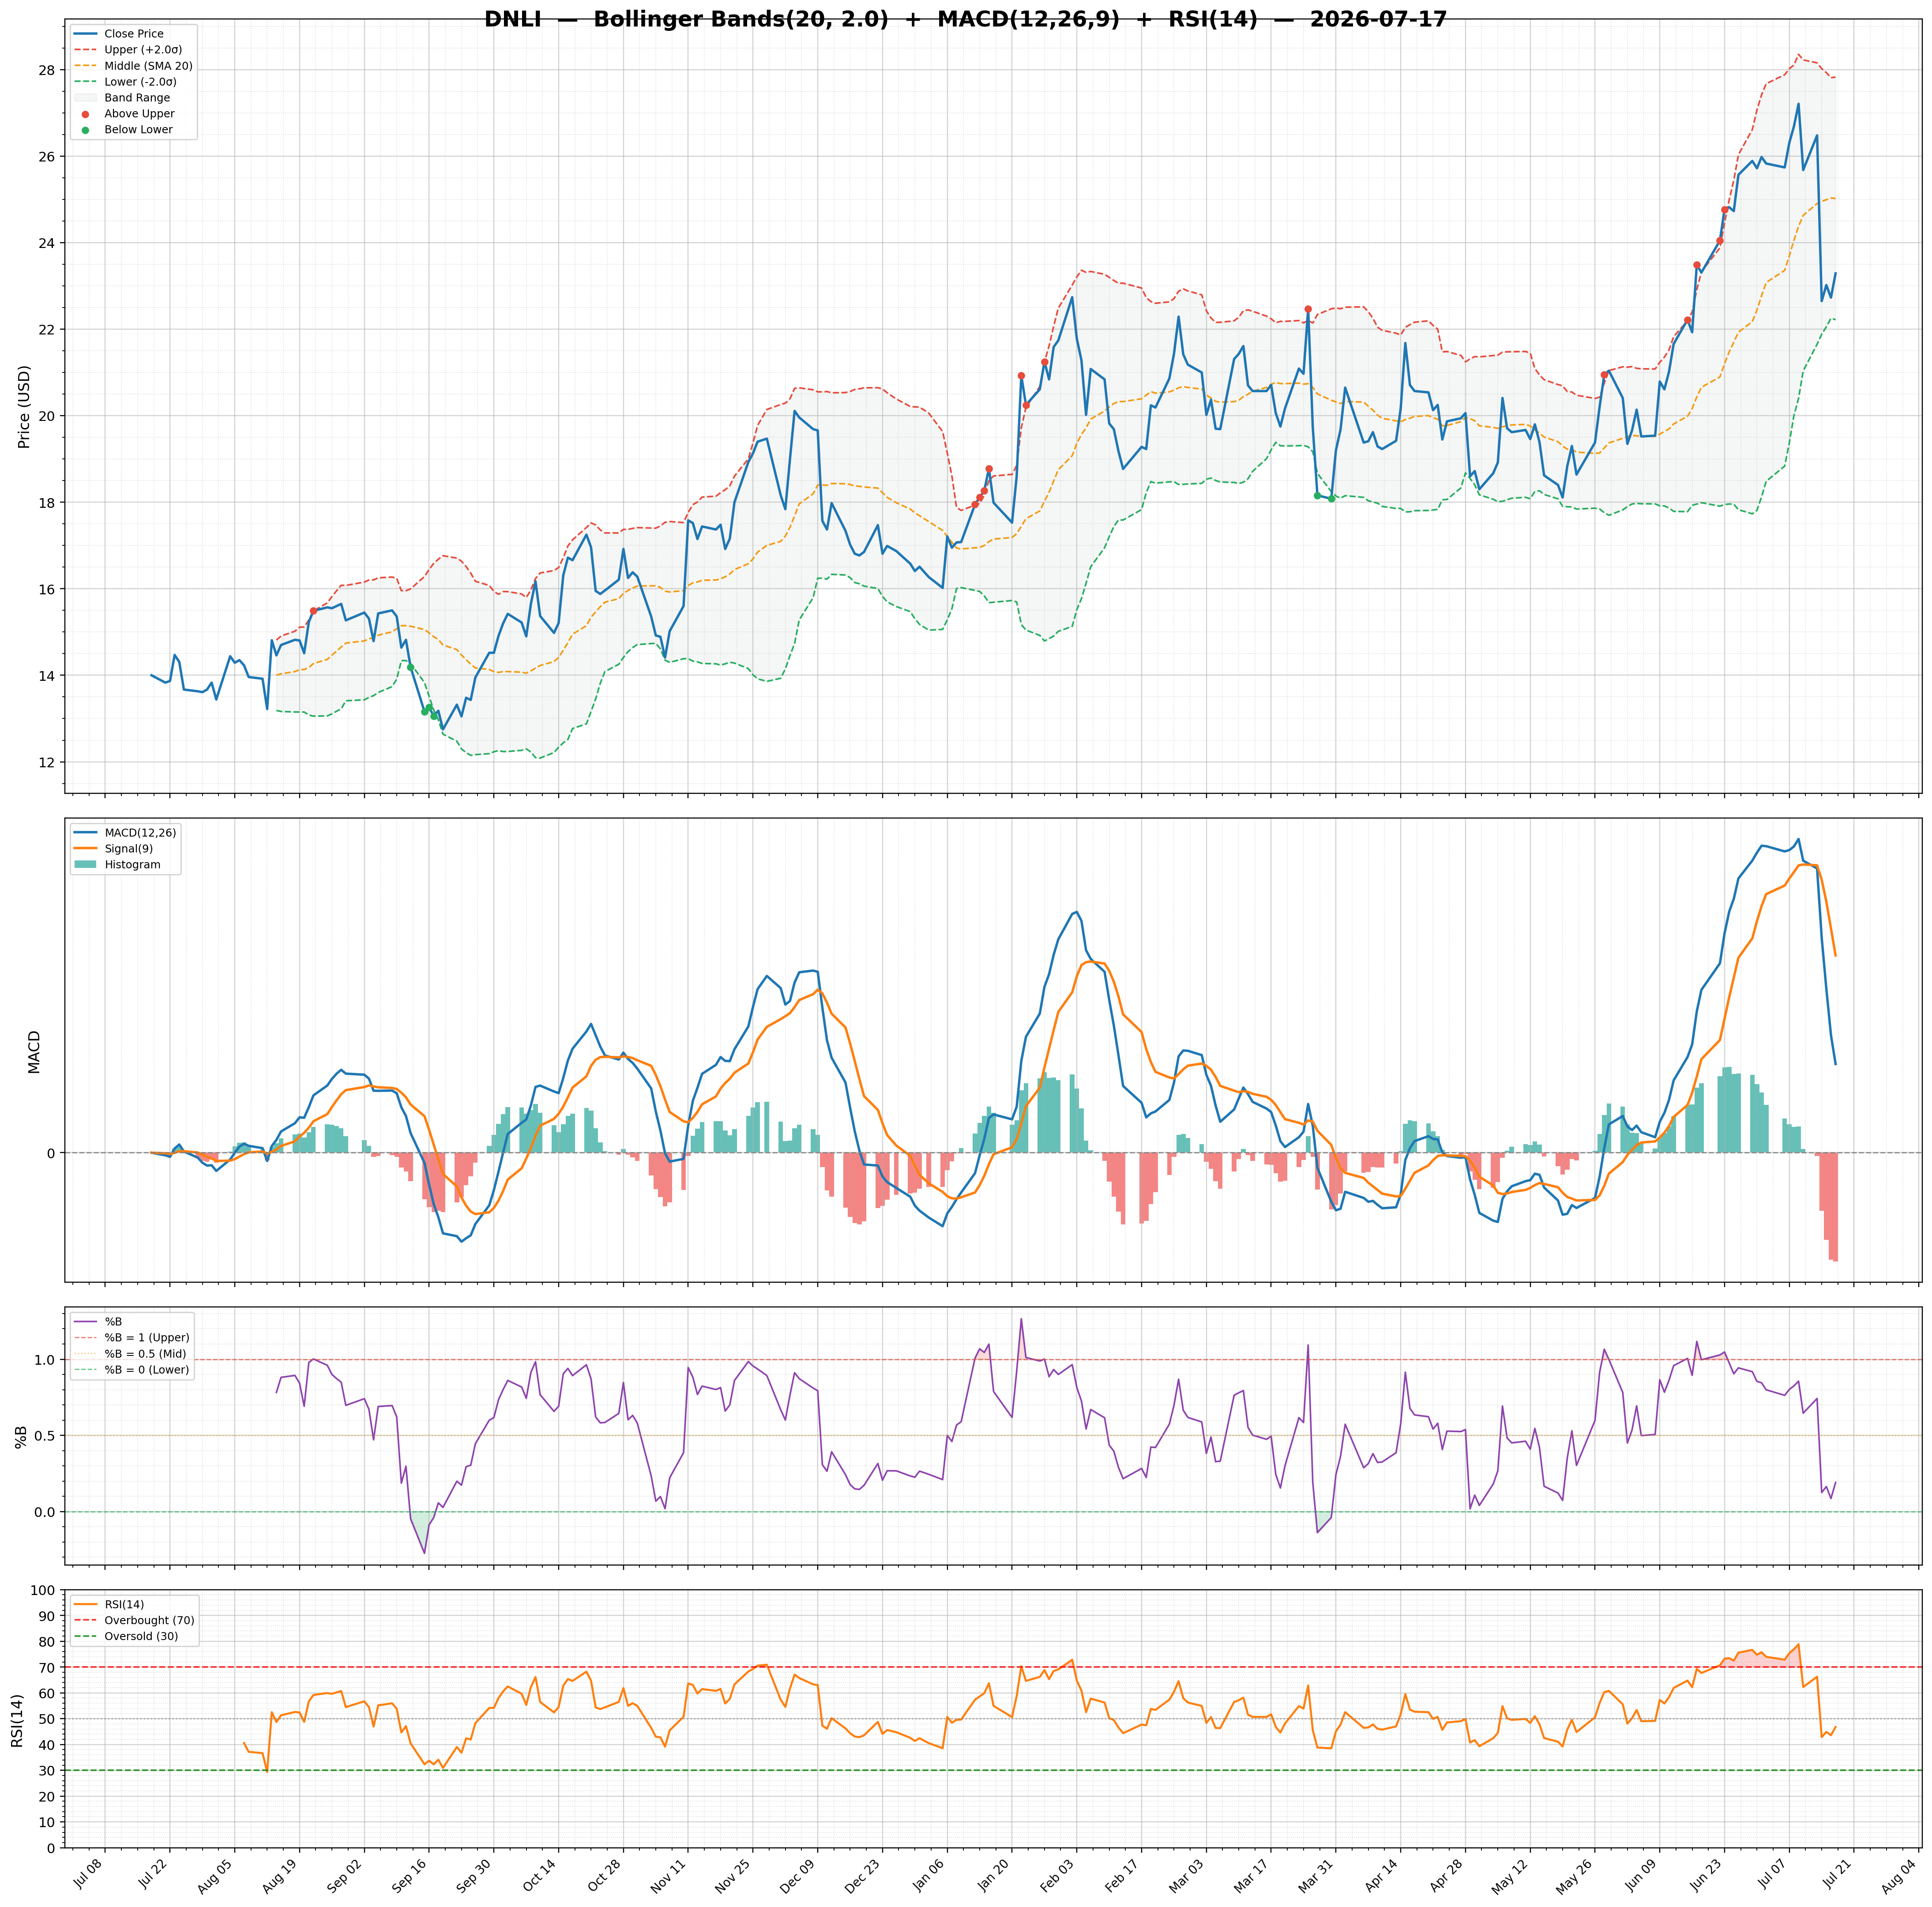
| 2026-07-17 | DNLI | 23.29 | / | 72.89% | strong_buy | 1,611,399/2,129,145 | 22.42/0.19 | 46.80/-0.5500 | 0.35 | 0.45/1.00 | Chart 3M 🌐 |
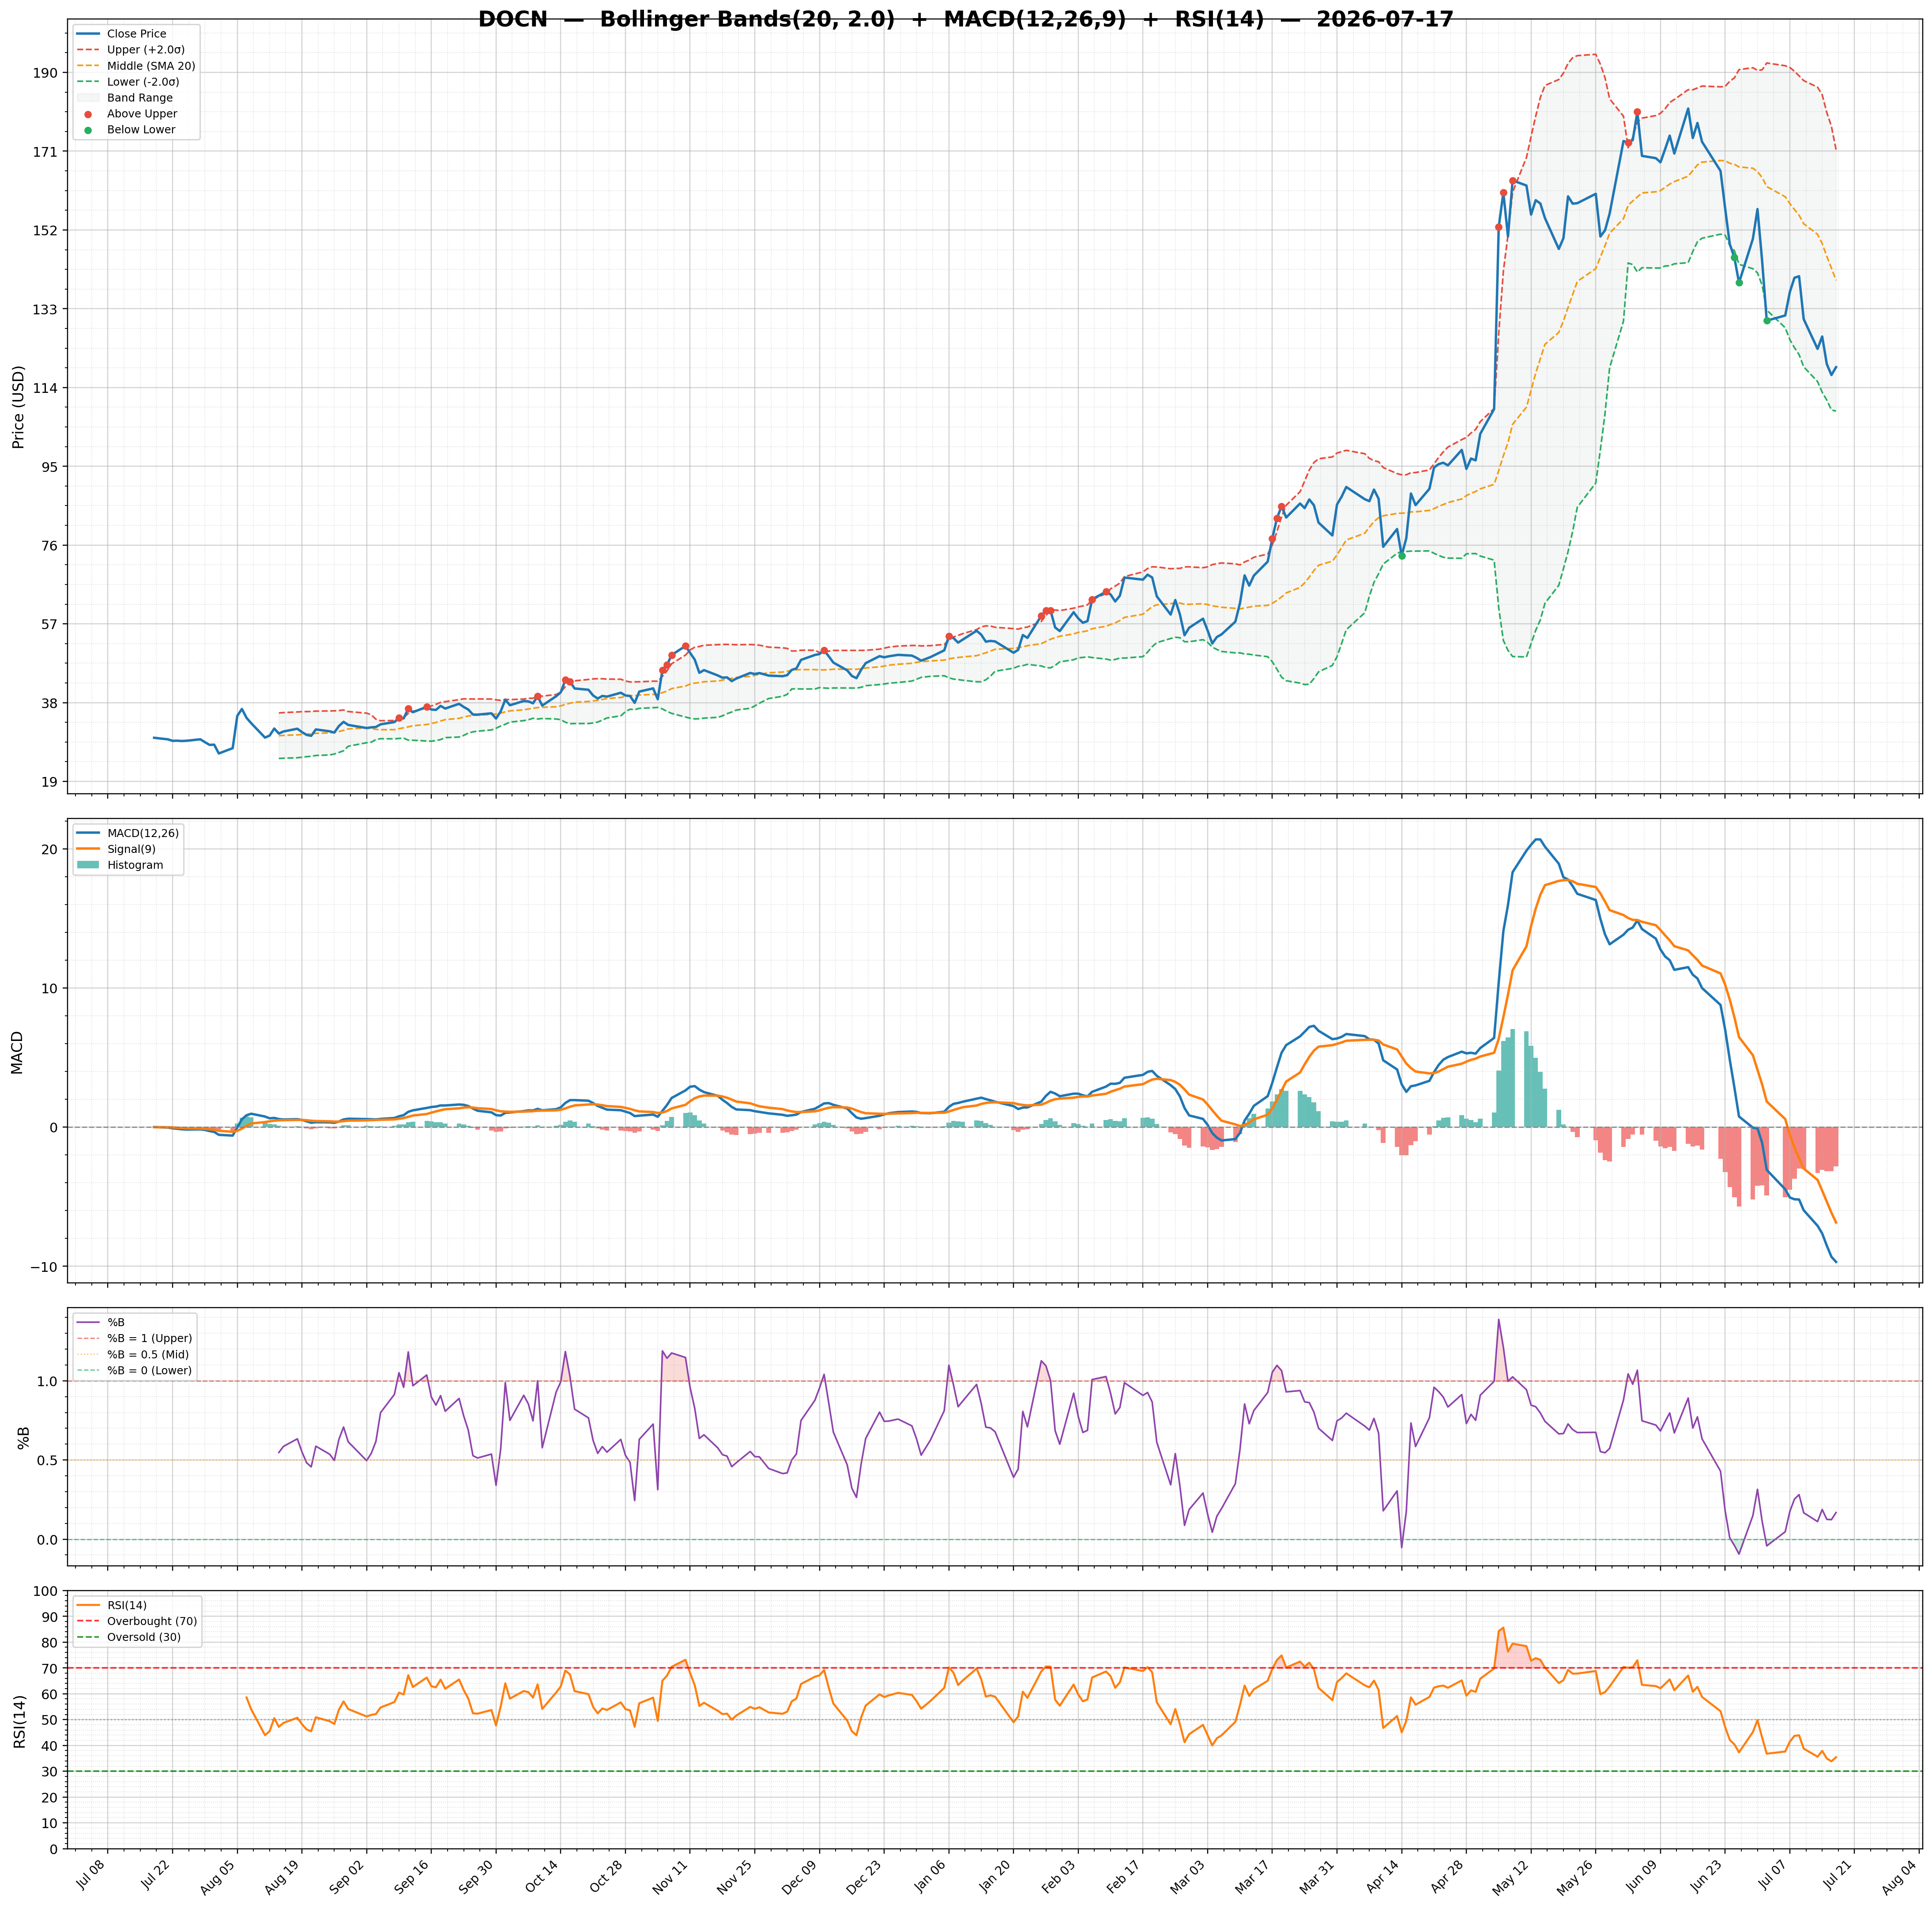
| 2026-07-17 | DOCN | 118.91 | / | 59.90% | buy | 2,035,561/3,940,533 | 45.11/0.17 | 35.43/-2.8300 | 1.39 | -9.69/-6.86 | Chart 3M 🌐 |
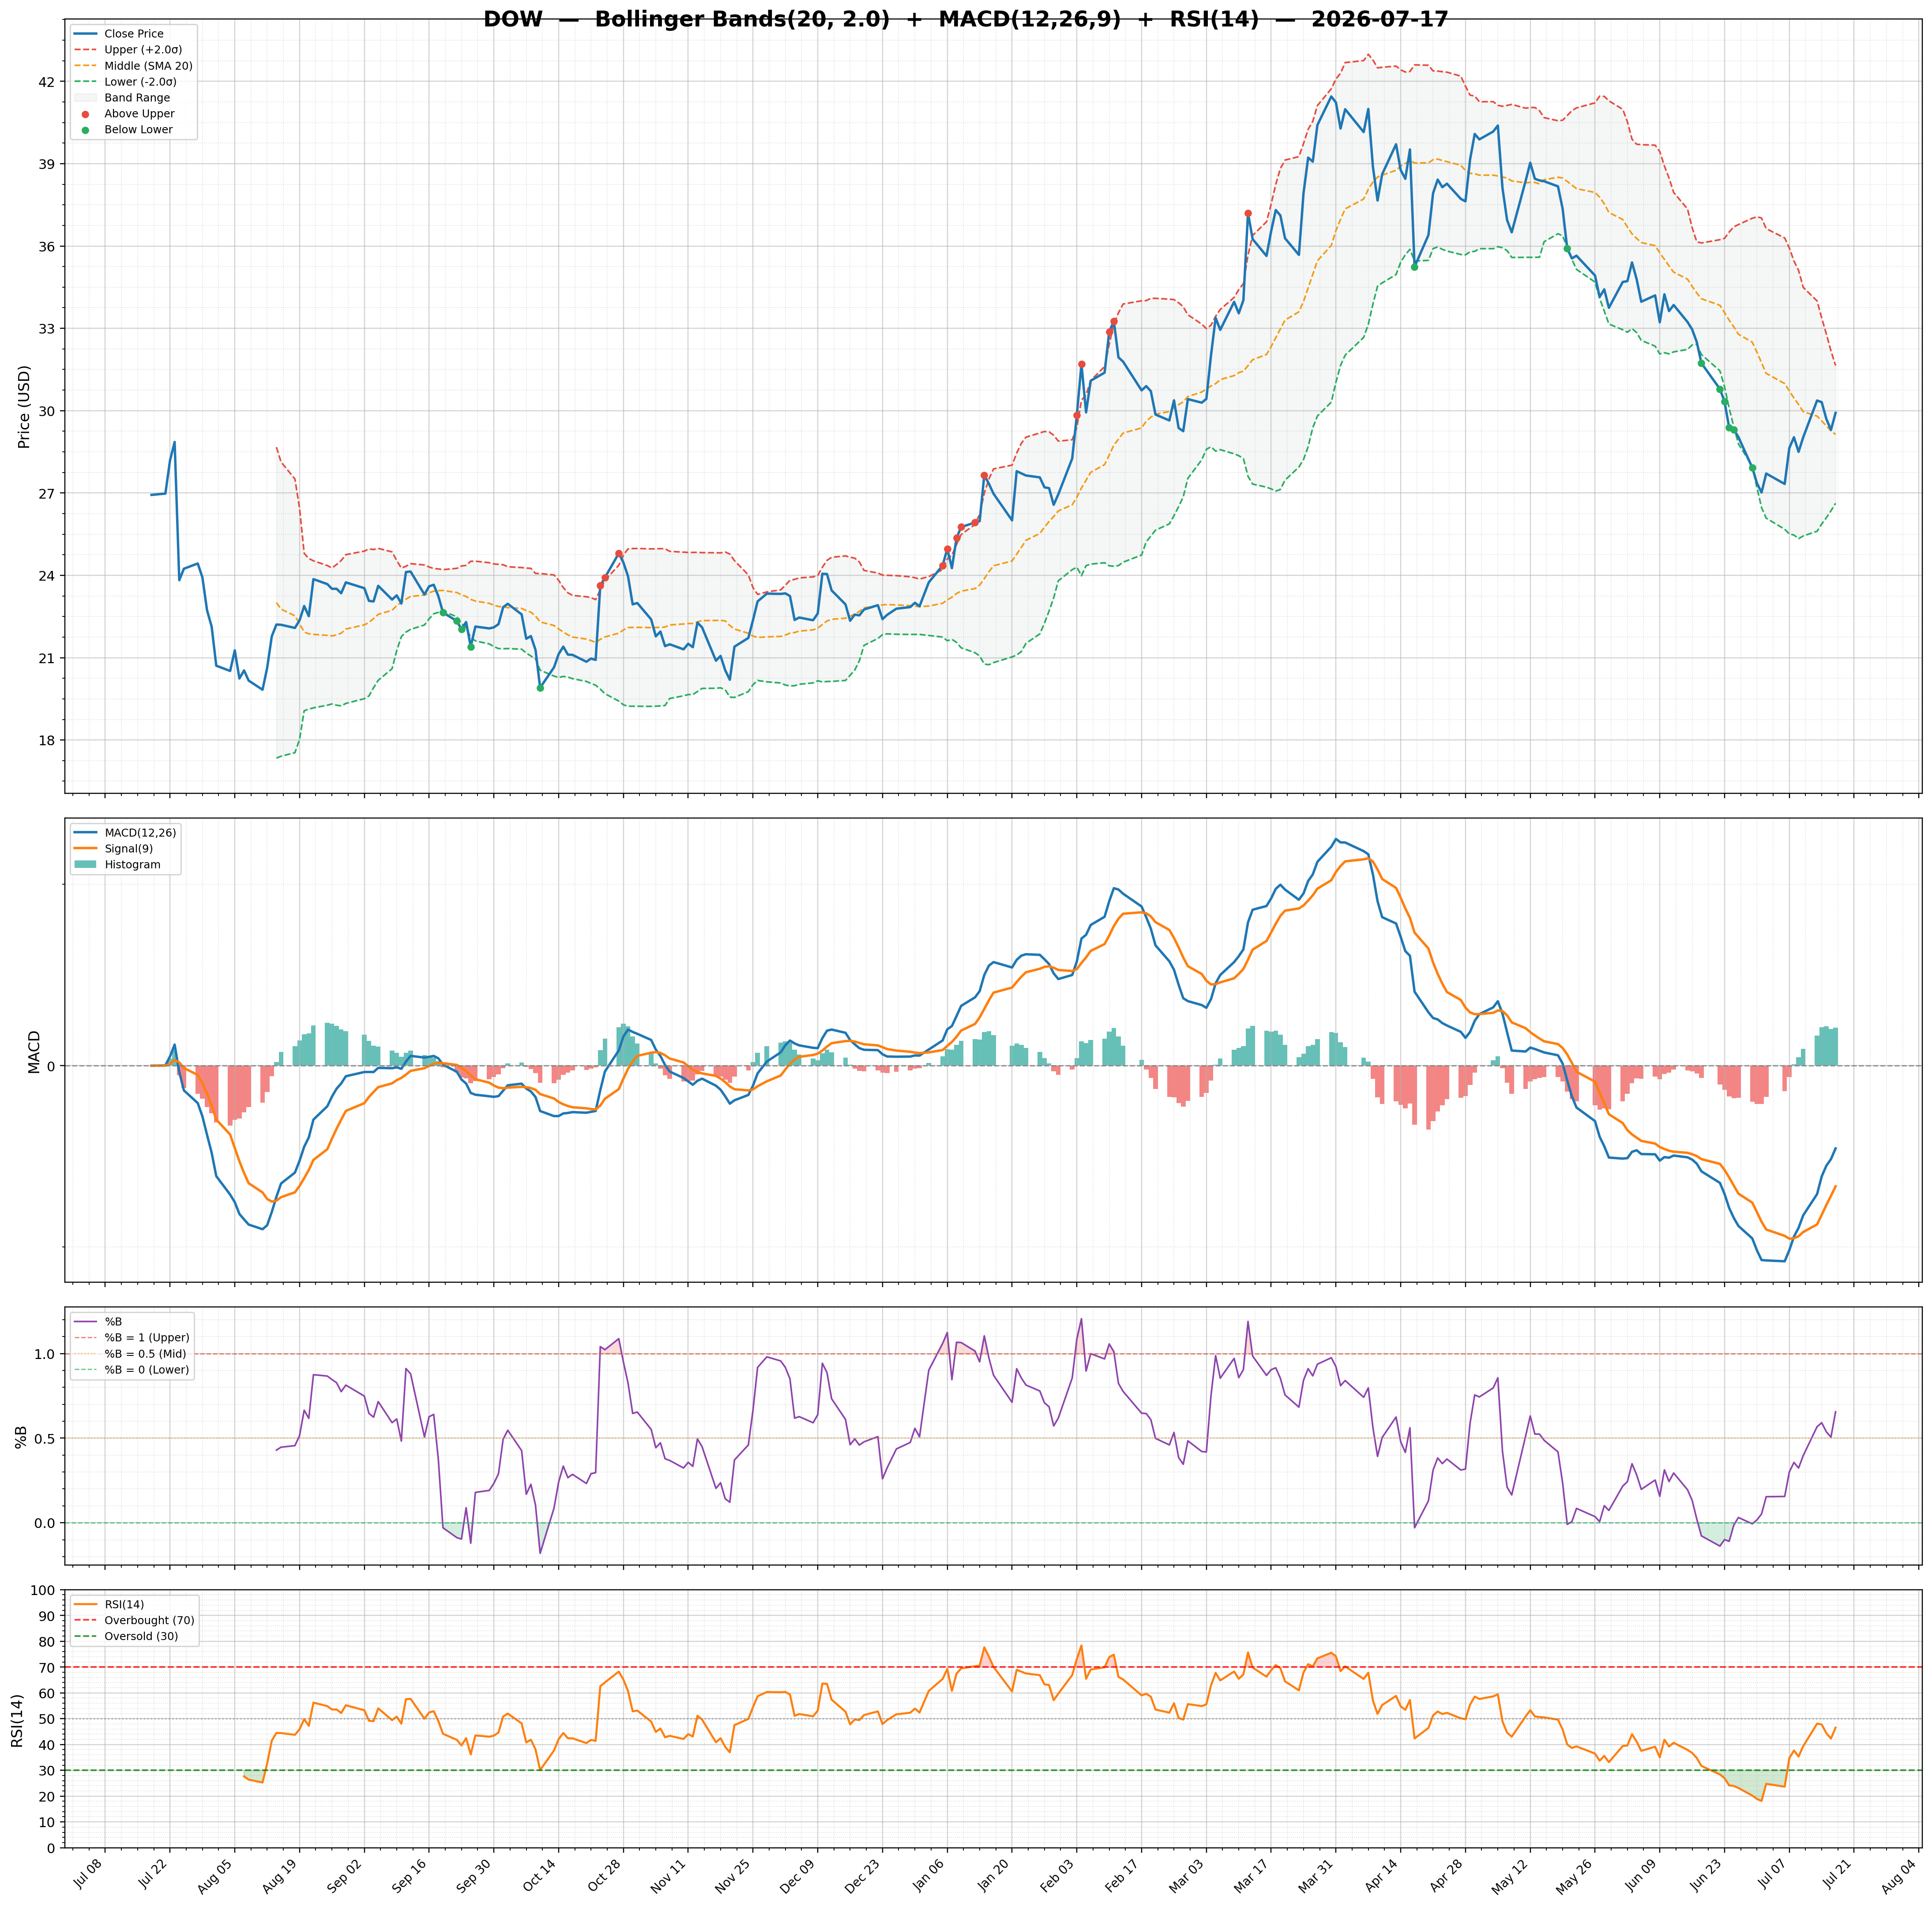
| 2026-07-17 | DOW | 29.92 | / | 46.67% | buy | 6,071,636/12,070,552 | 17.23/0.66 | 46.52/0.4200 | 0.02 | -0.91/-1.33 | Chart 3M 🌐 |
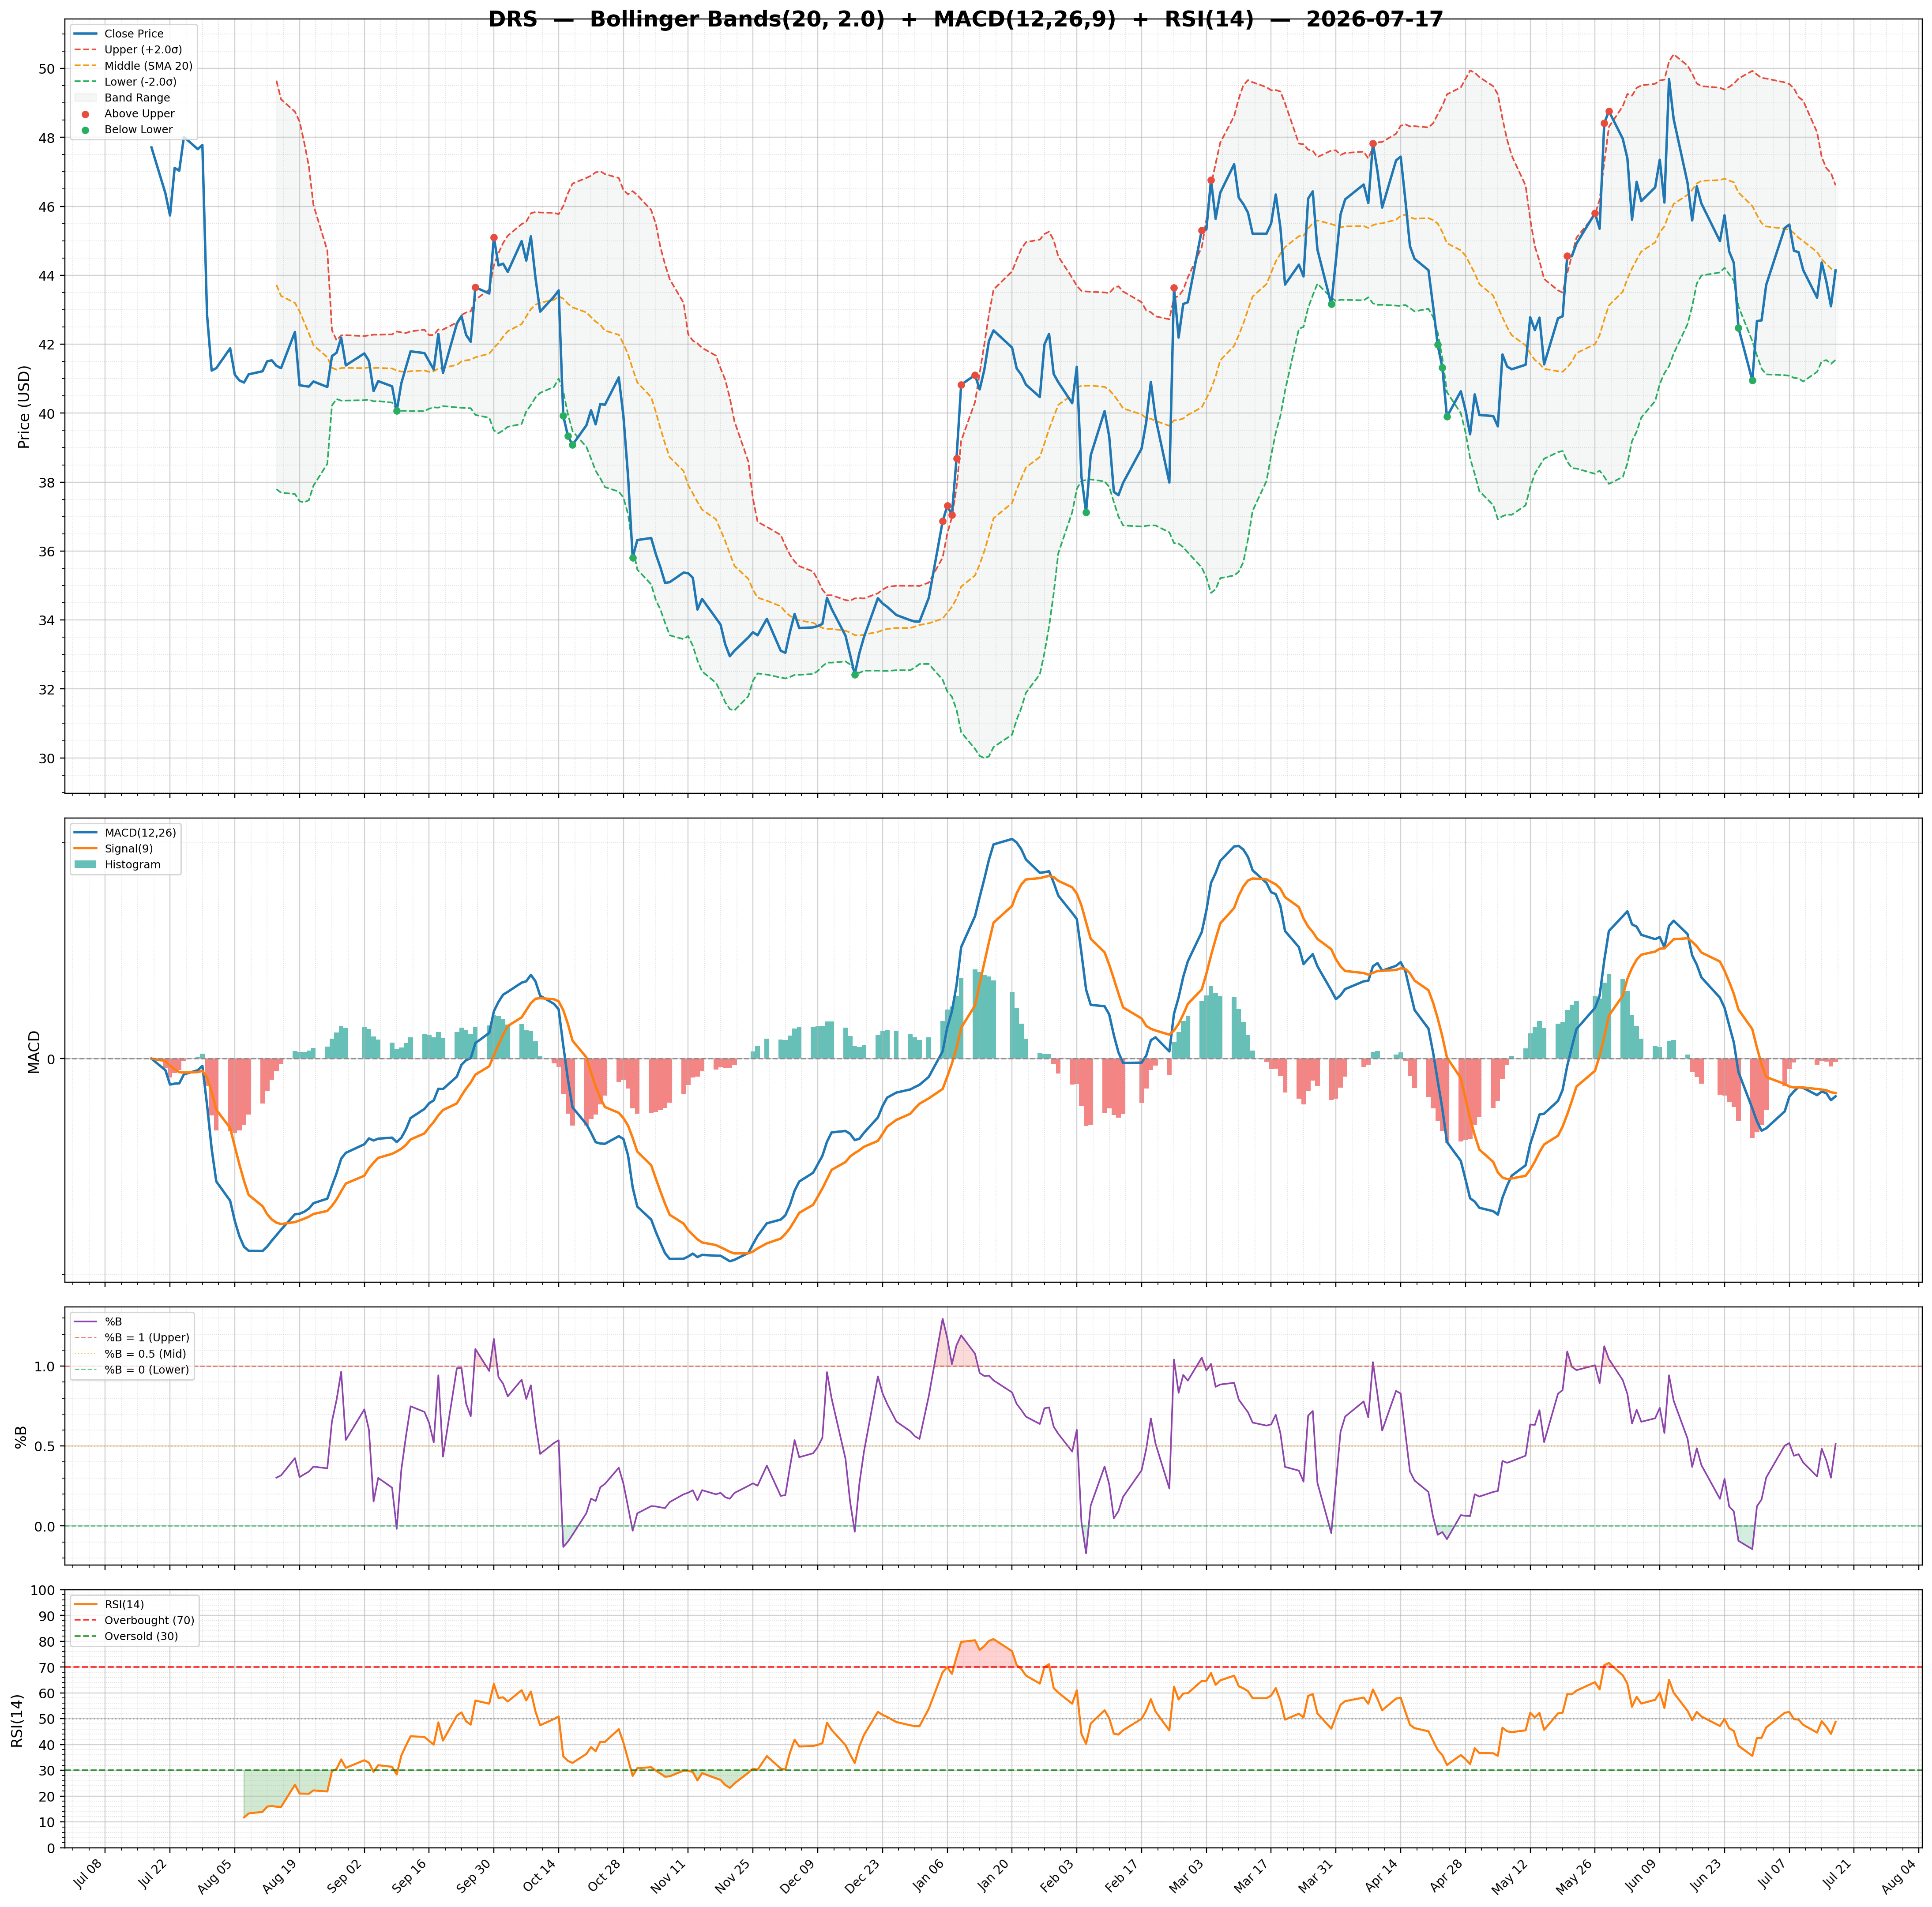
| 2026-07-17 | DRS | 44.14 | / | 67.86% | strong_buy | 1,688,804/1,234,513 | 11.49/0.51 | 48.79/-0.0300 | 0.00 | -0.35/-0.32 | Chart 3M 🌐 |
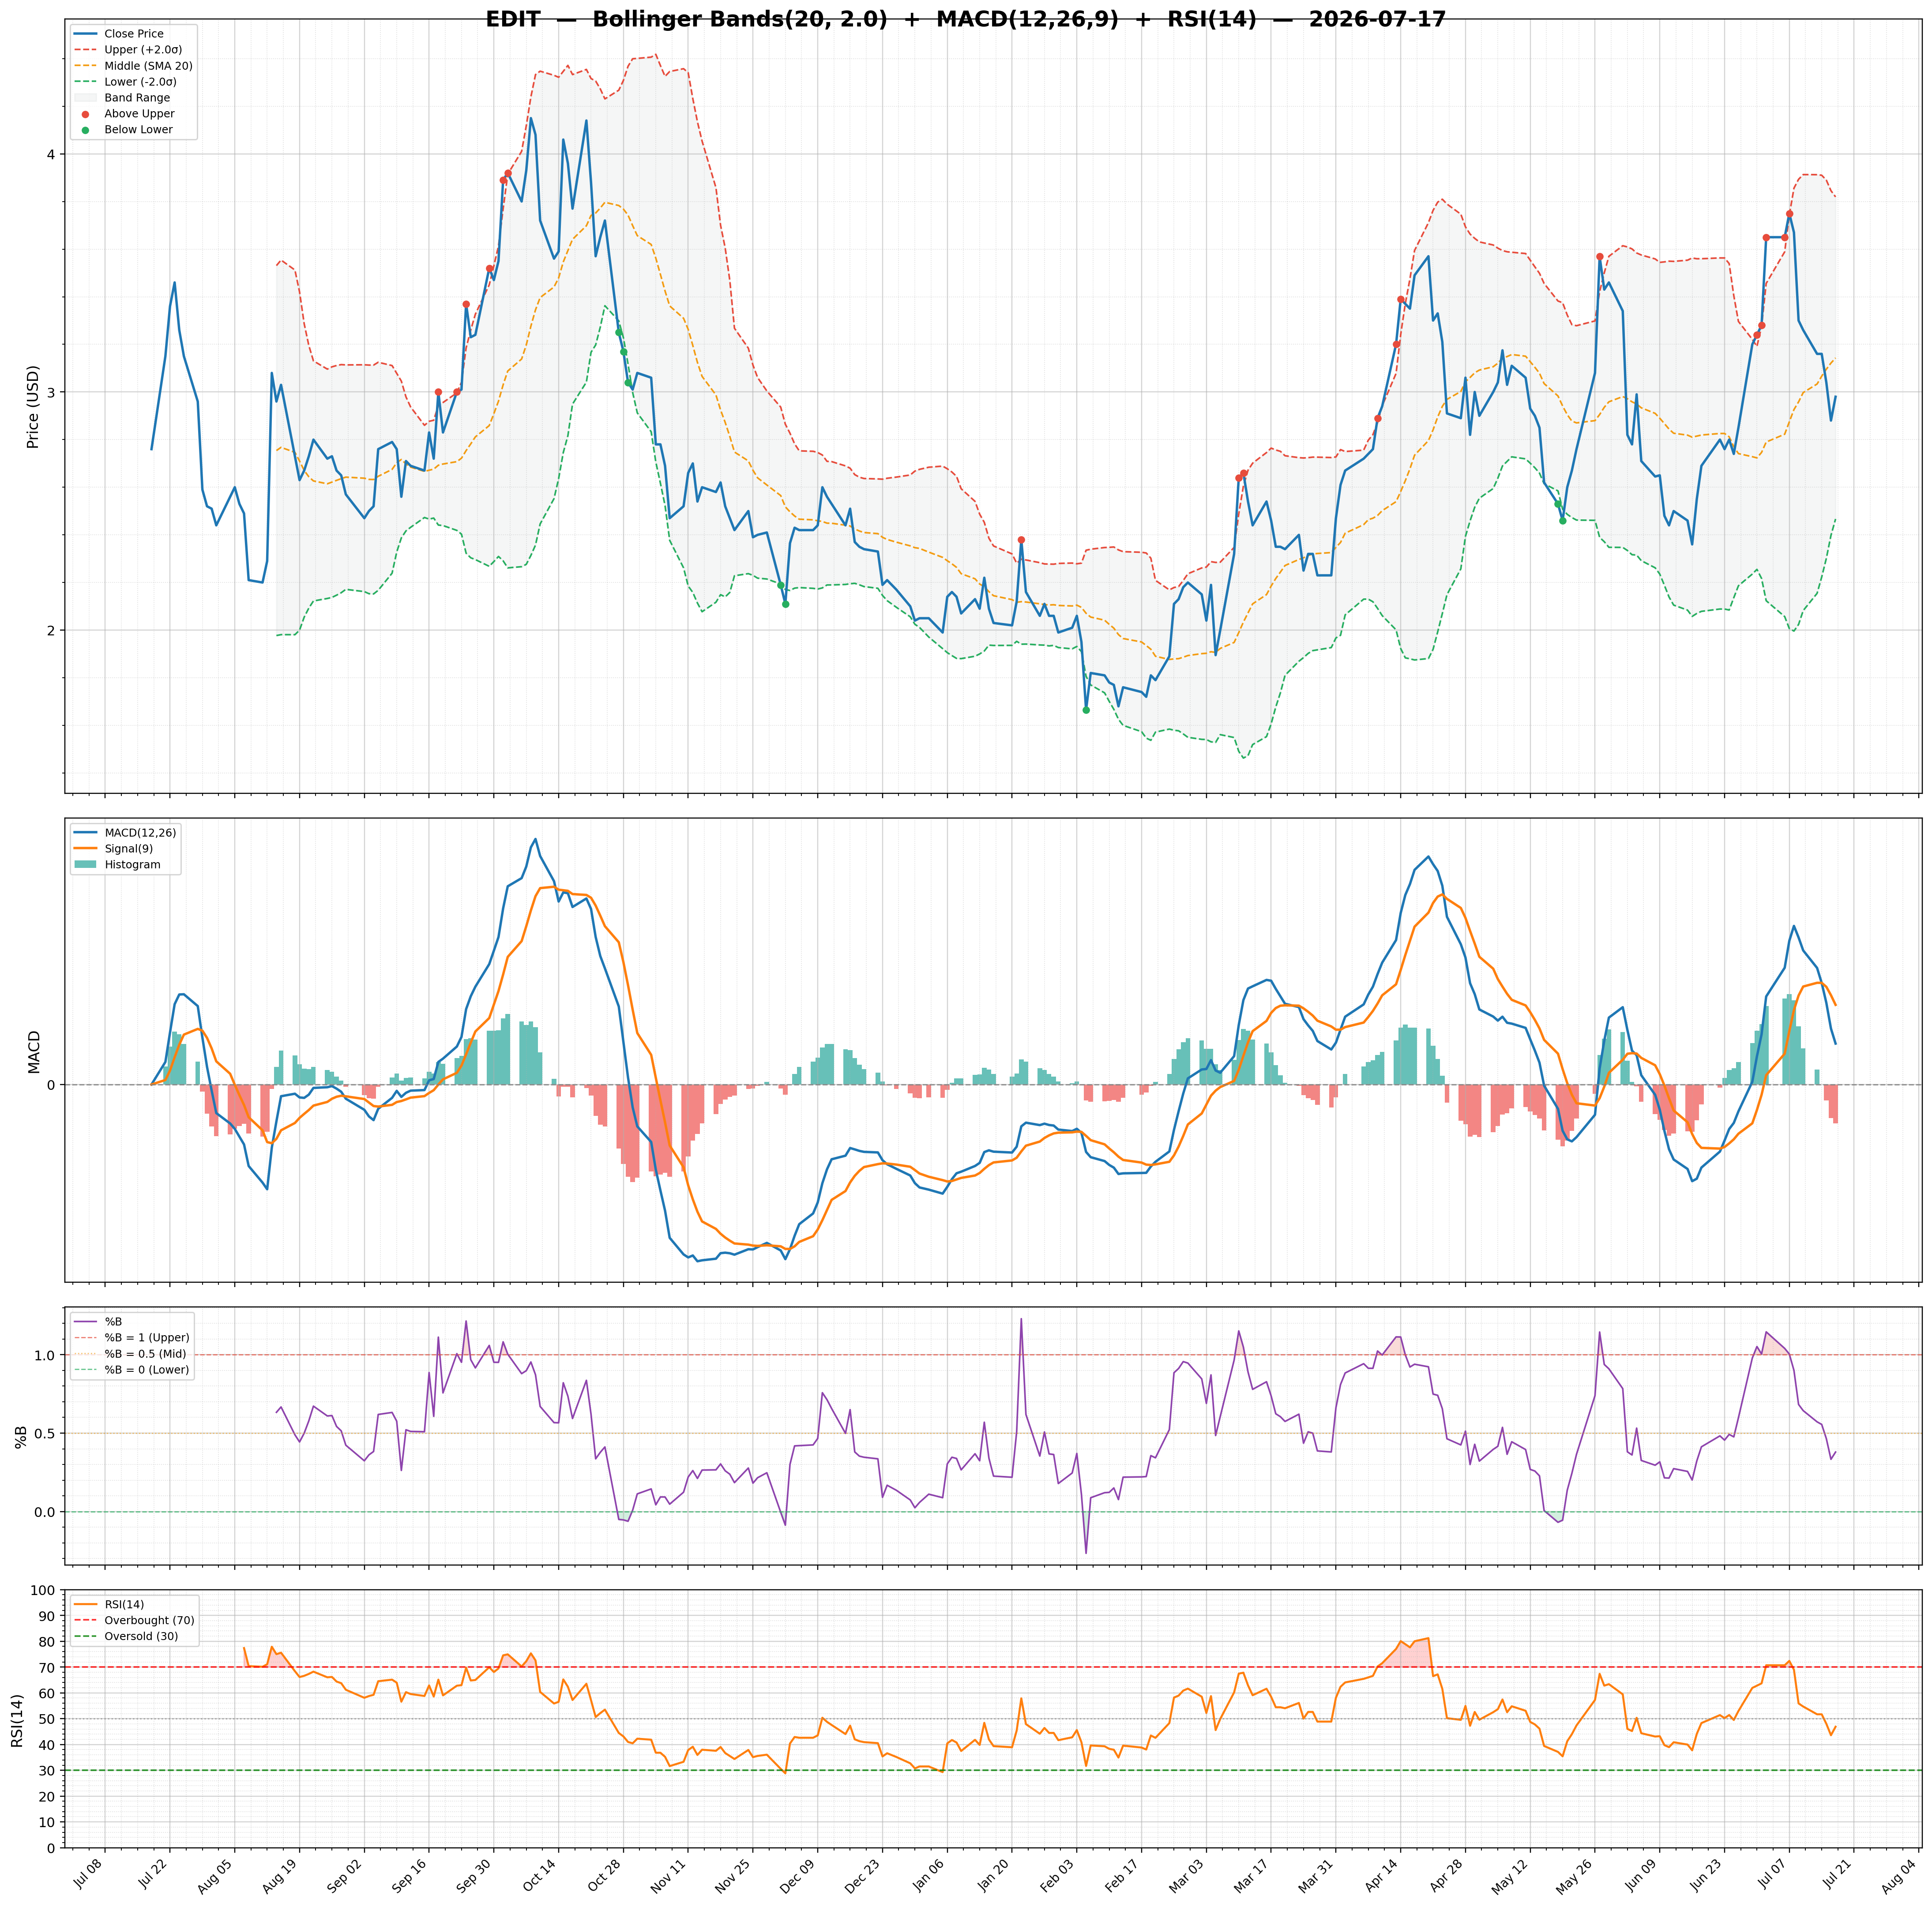
| 2026-07-17 | EDIT | 2.98 | / | 53.01% | none | 1,739,297/2,860,370 | 43.03/0.38 | 46.90/-0.0500 | -0.02 | 0.06/0.11 | Chart 3M 🌐 |
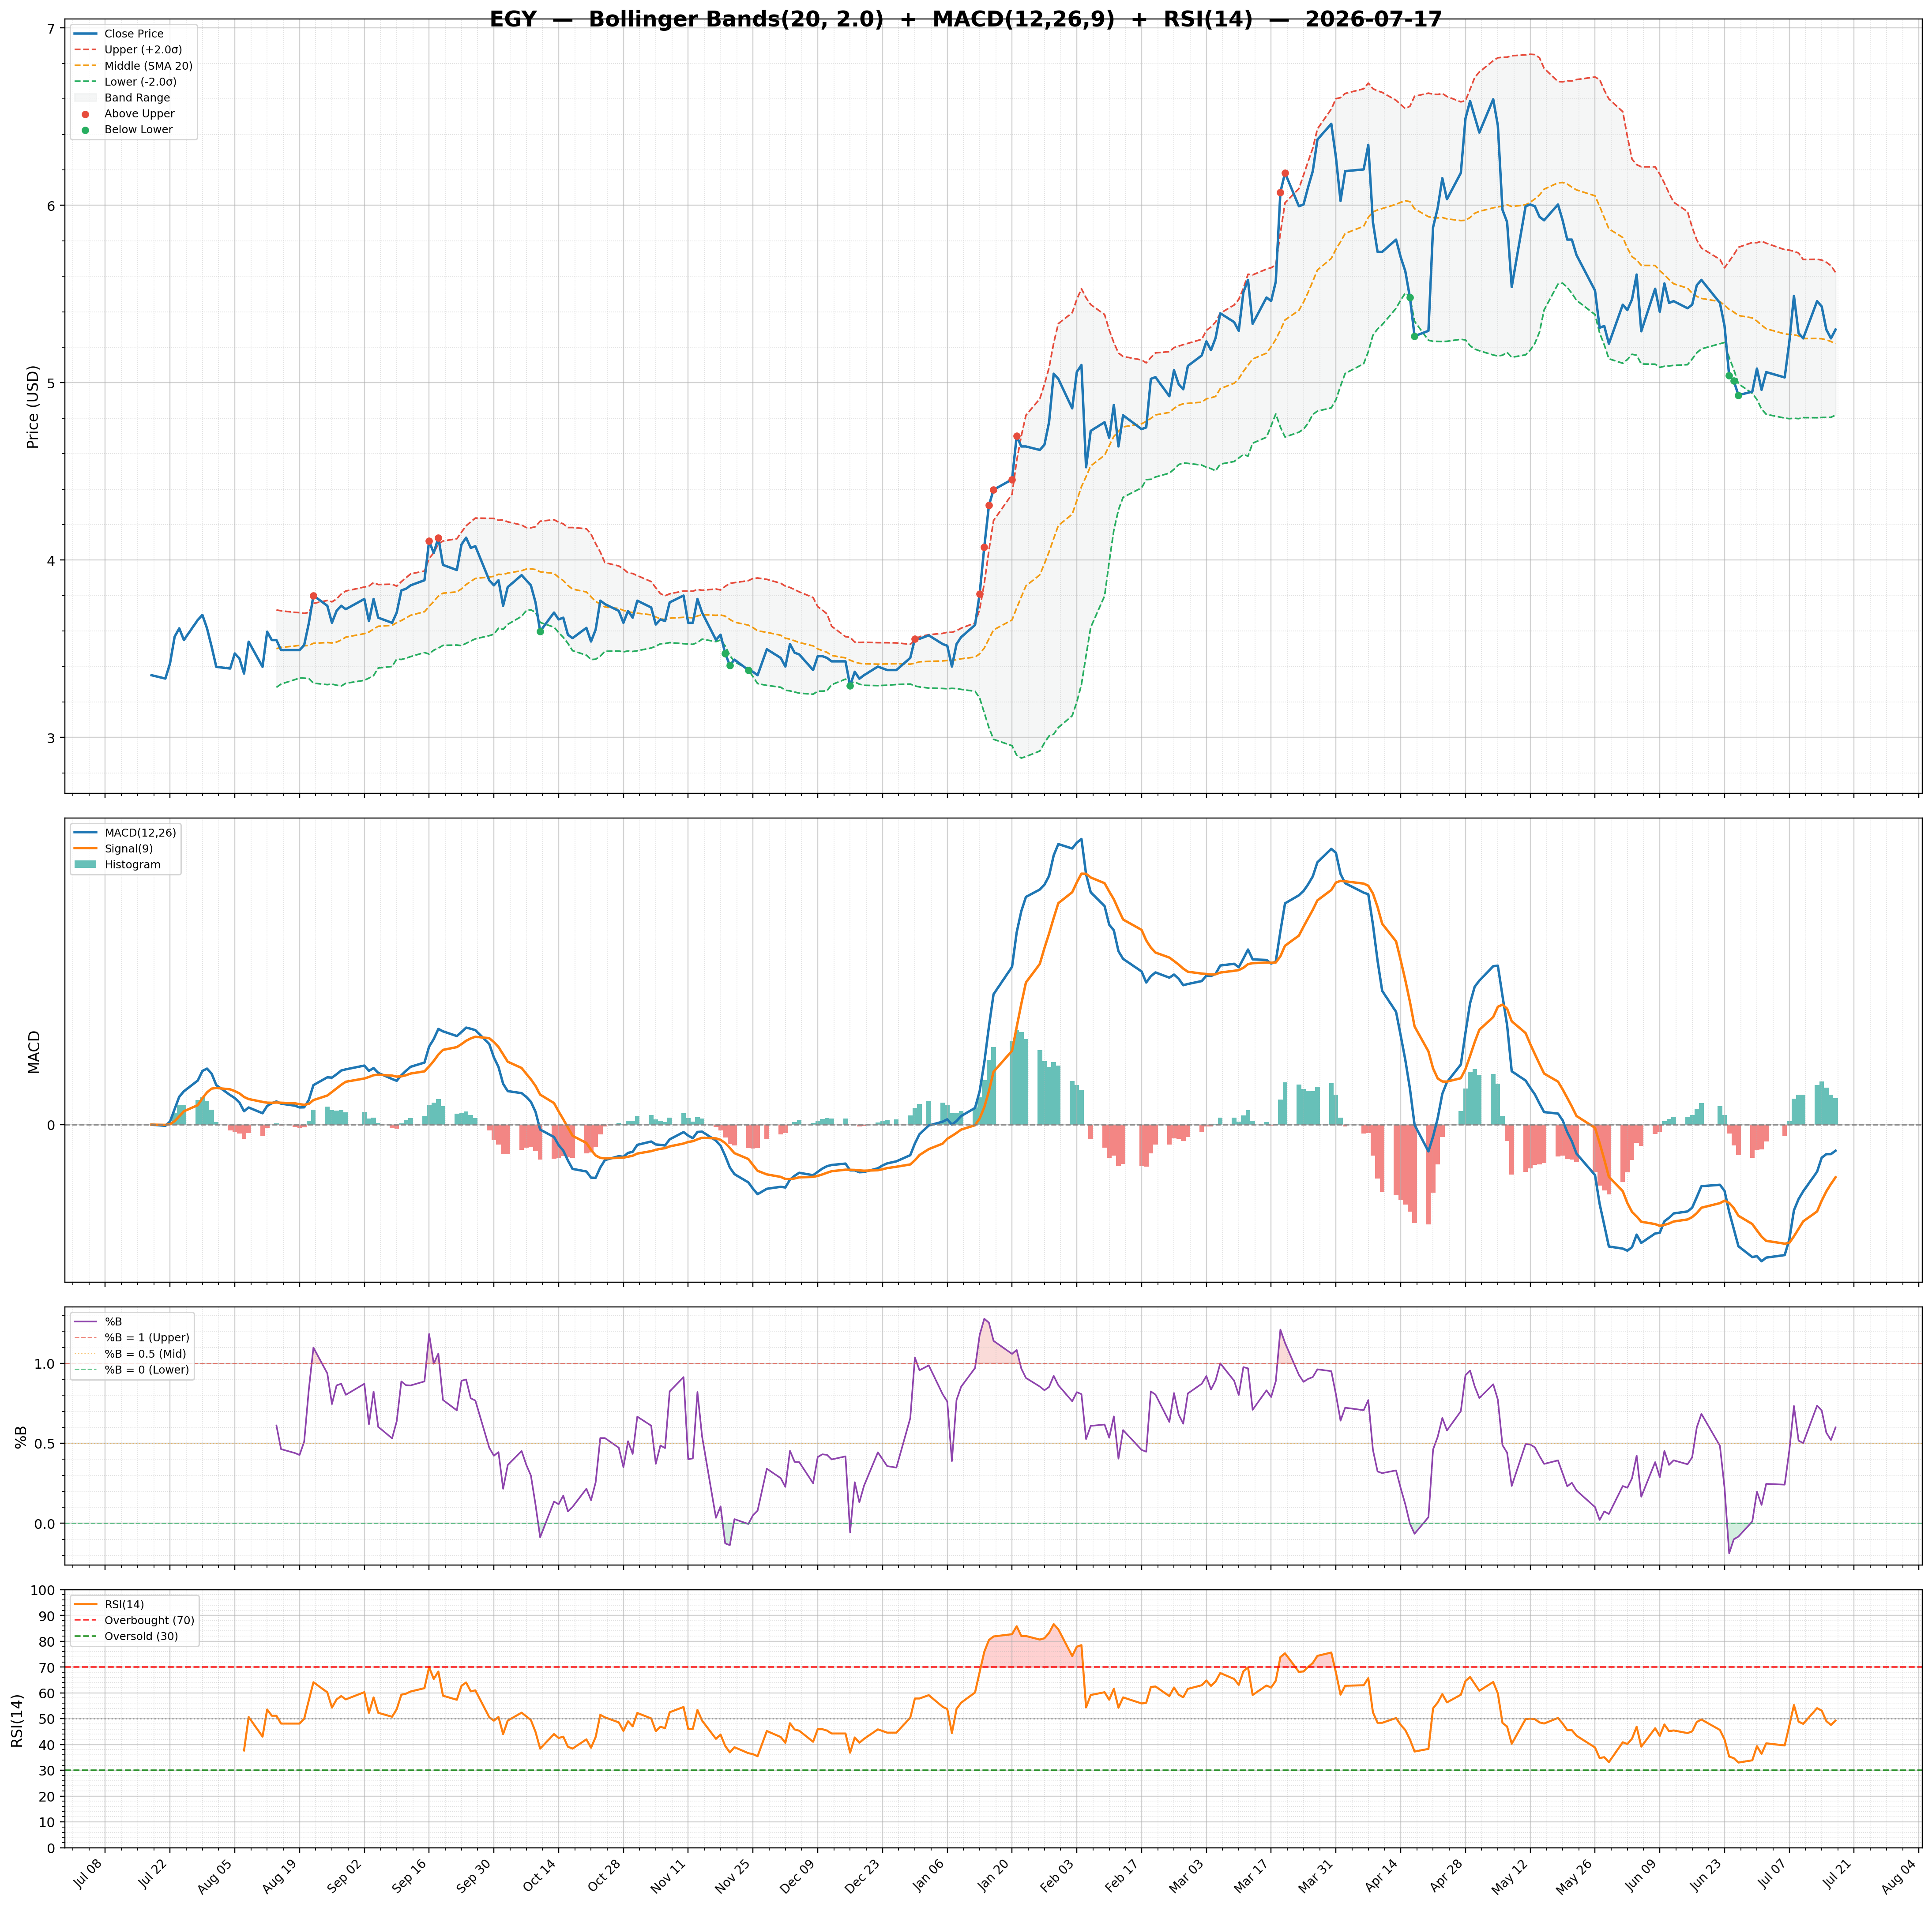
| 2026-07-17 | EGY | 5.30 | / | 60.73% | strong_buy | 719,912/1,534,291 | 15.40/0.60 | 49.25/0.0400 | 0.25 | -0.03/-0.07 | Chart 3M 🌐 |
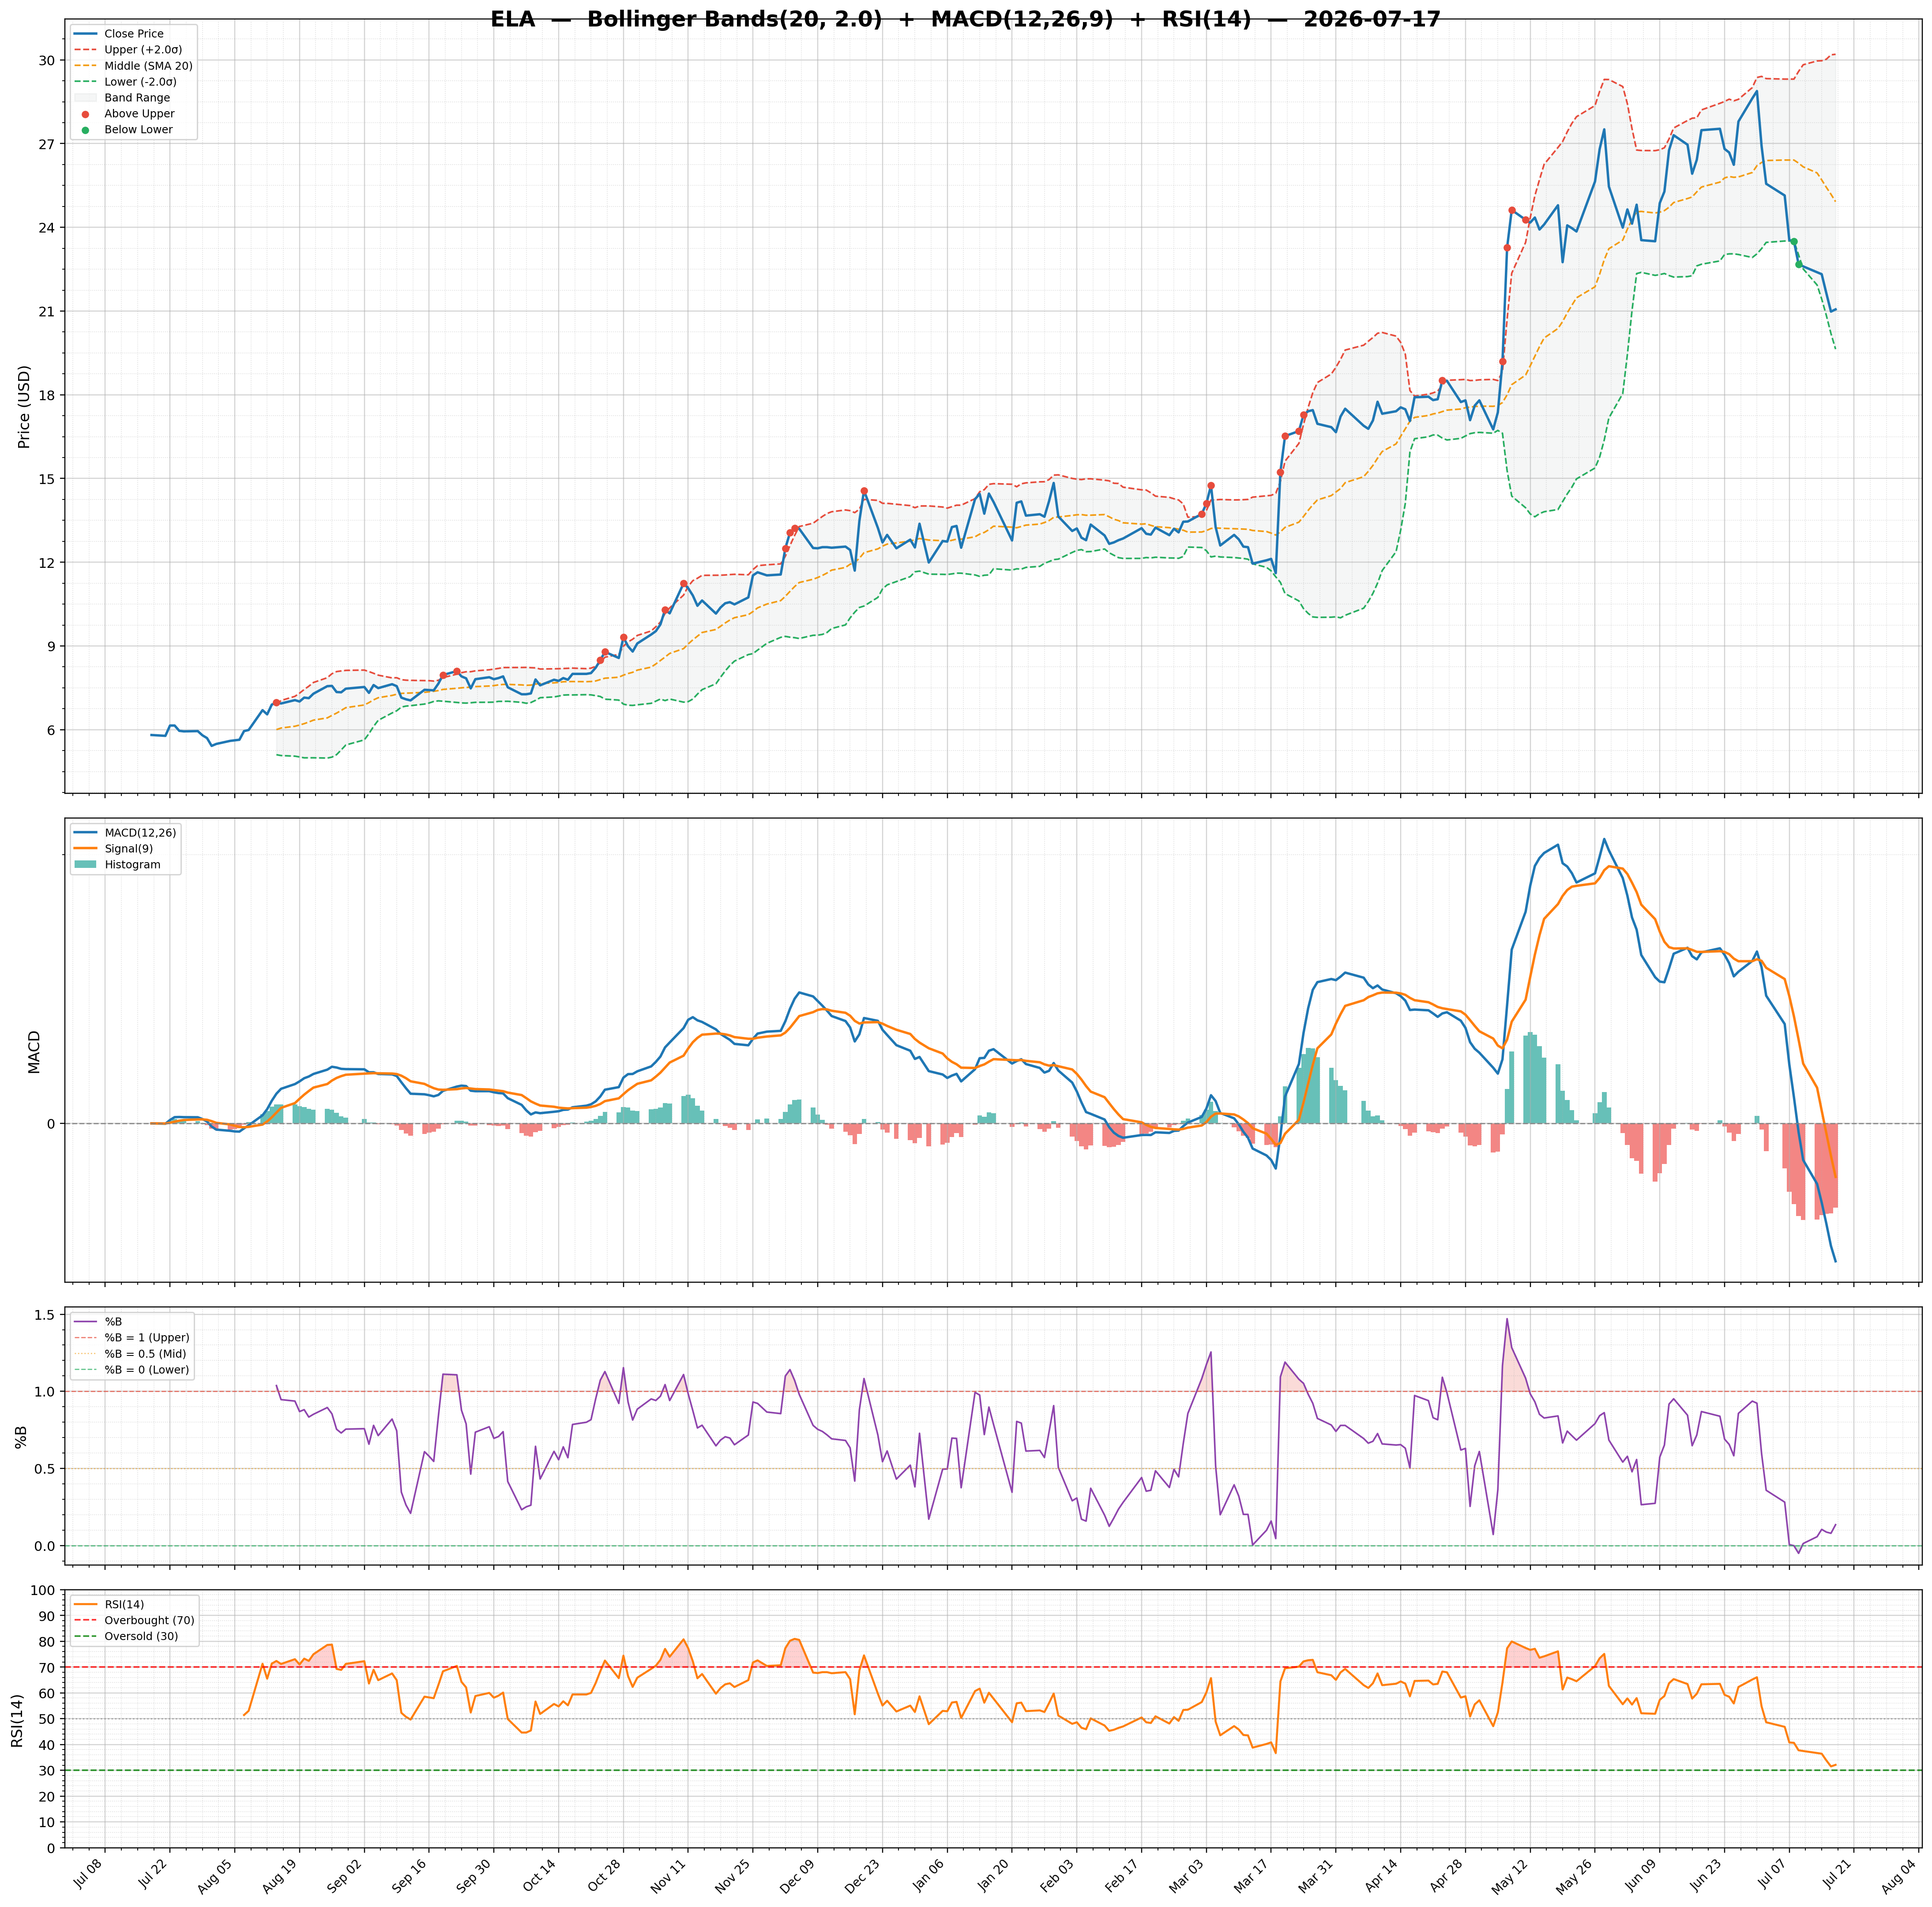
| 2026-07-17 | ELA | 21.06 | / | 66.67% | none | 135,010/144,179 | 42.39/0.14 | 32.12/-0.6300 | 1.07 | -1.03/-0.40 | Chart 3M 🌐 |
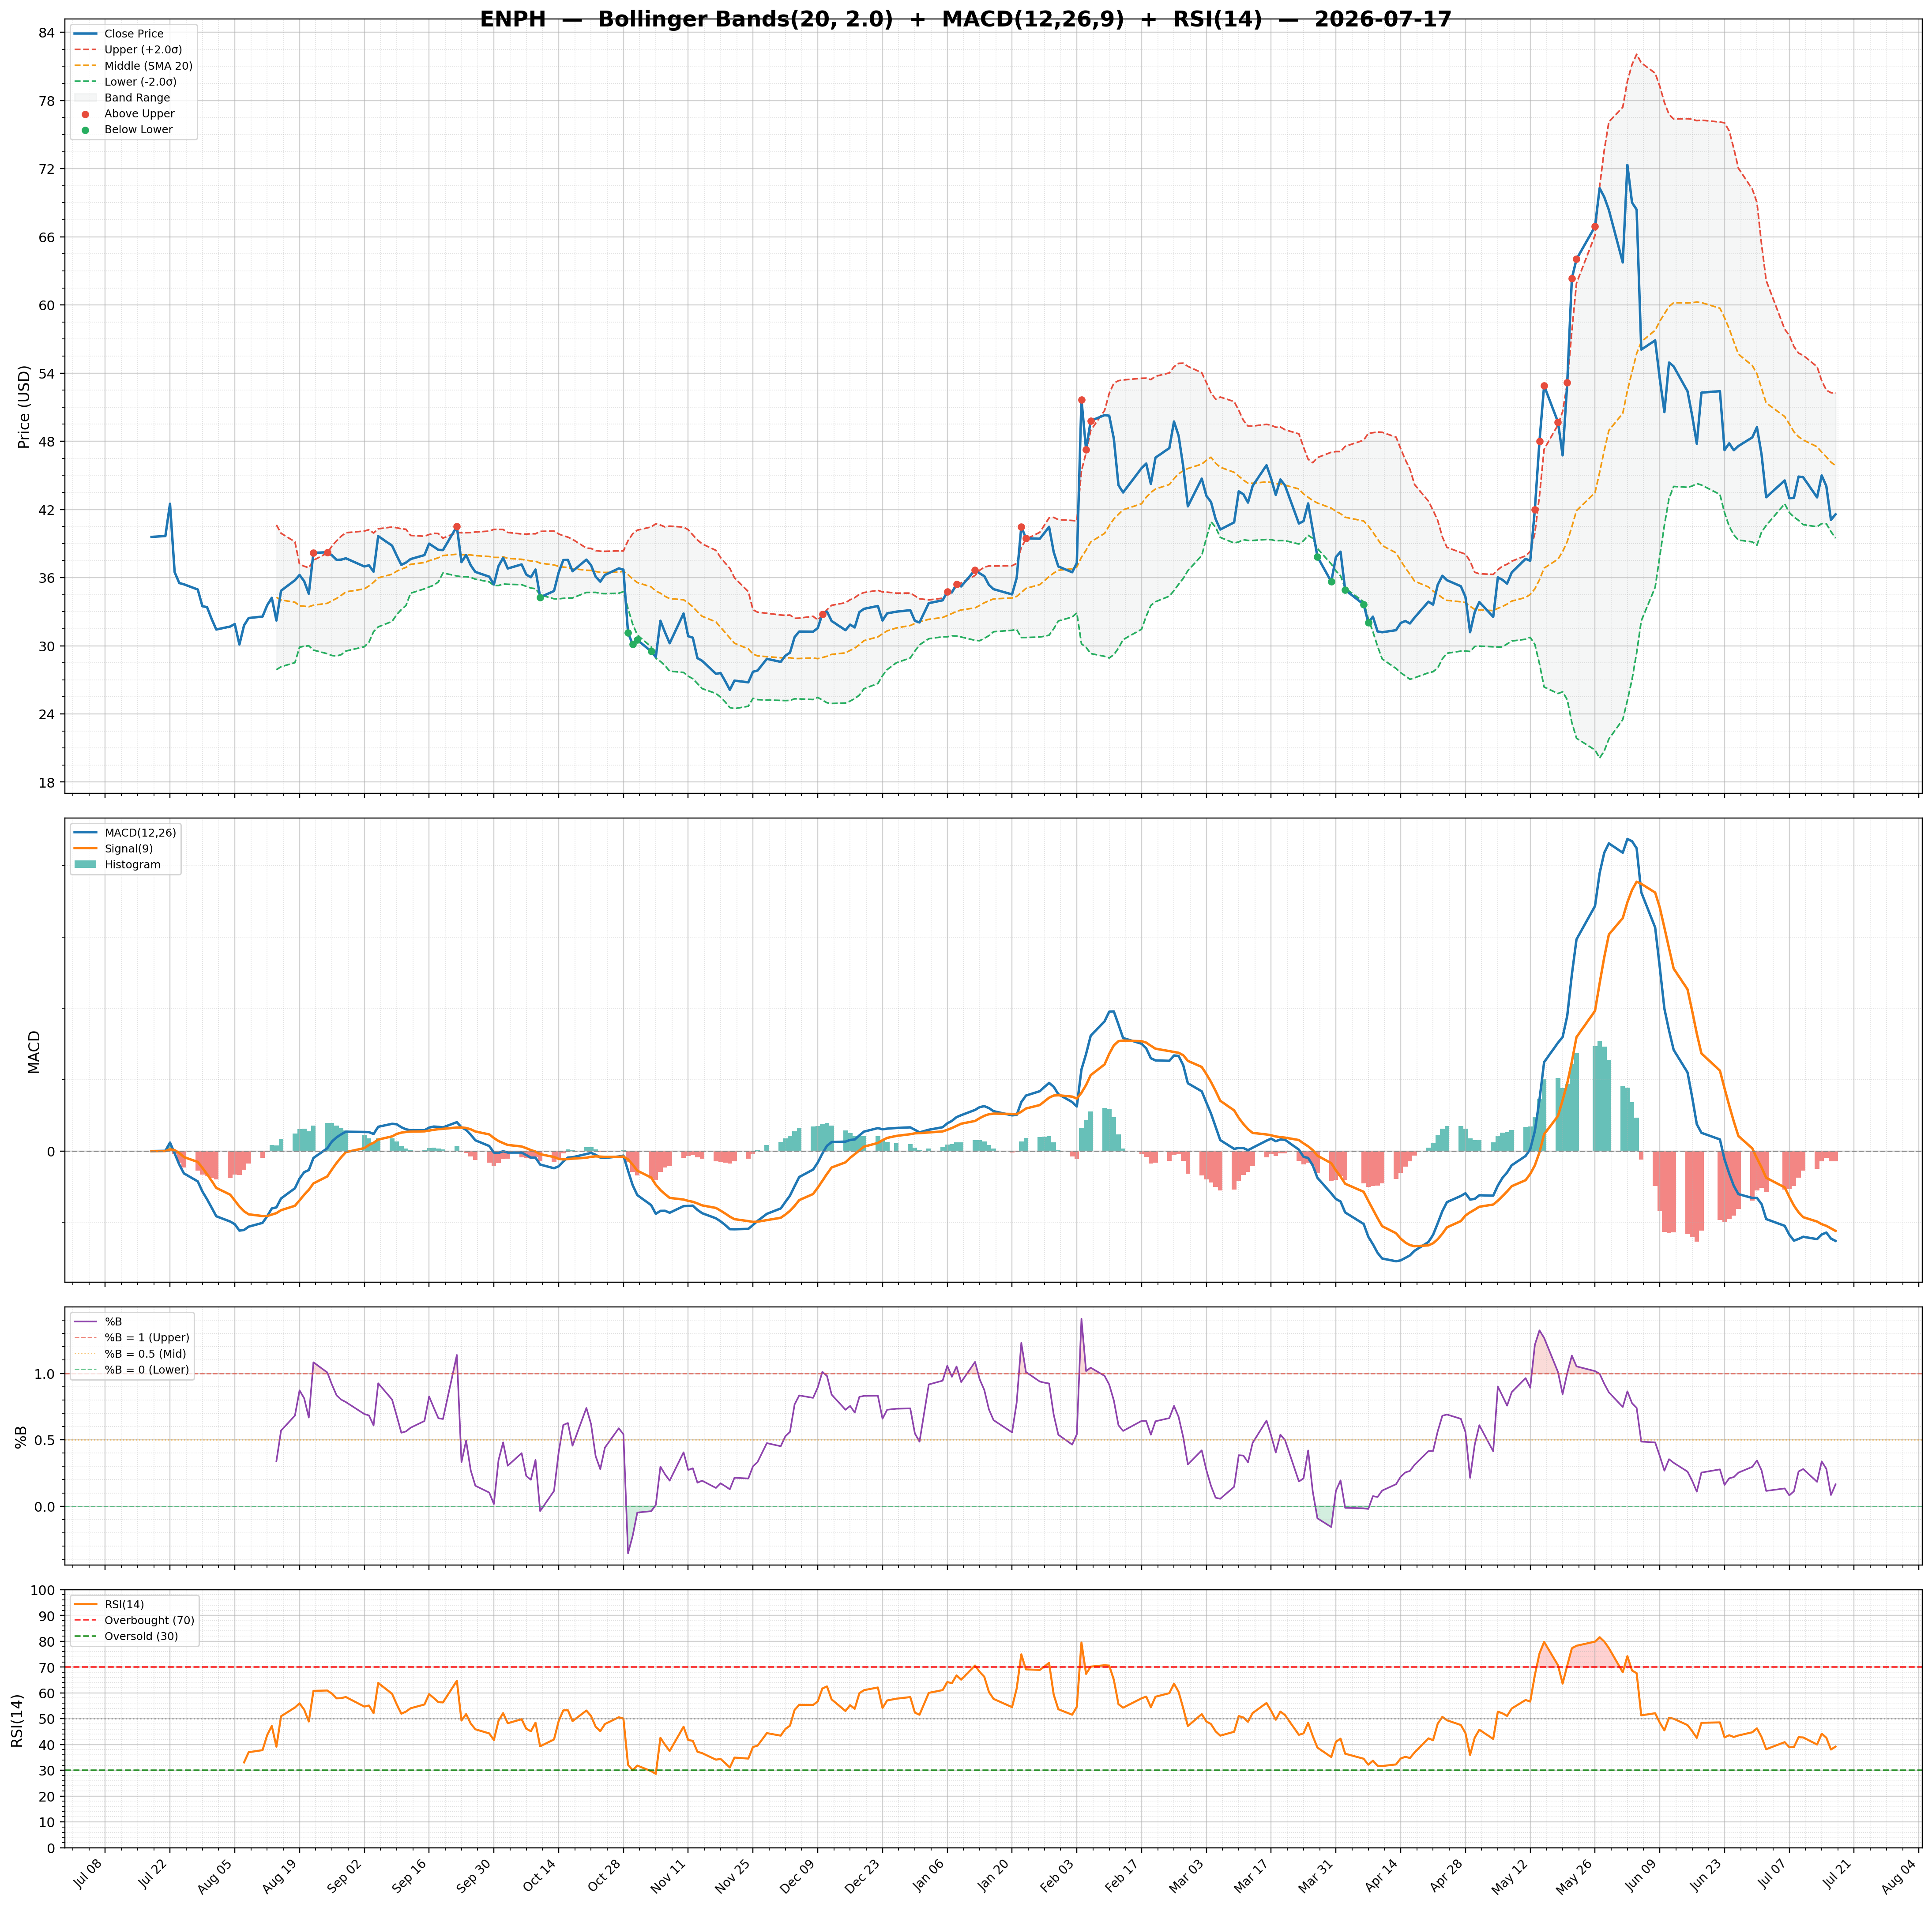
| 2026-07-17 | ENPH | 41.57 | / | 33.43% | buy | 4,446,223/6,174,256 | 27.88/0.16 | 39.21/-0.2800 | 0.19 | -2.52/-2.24 | Chart 3M 🌐 |
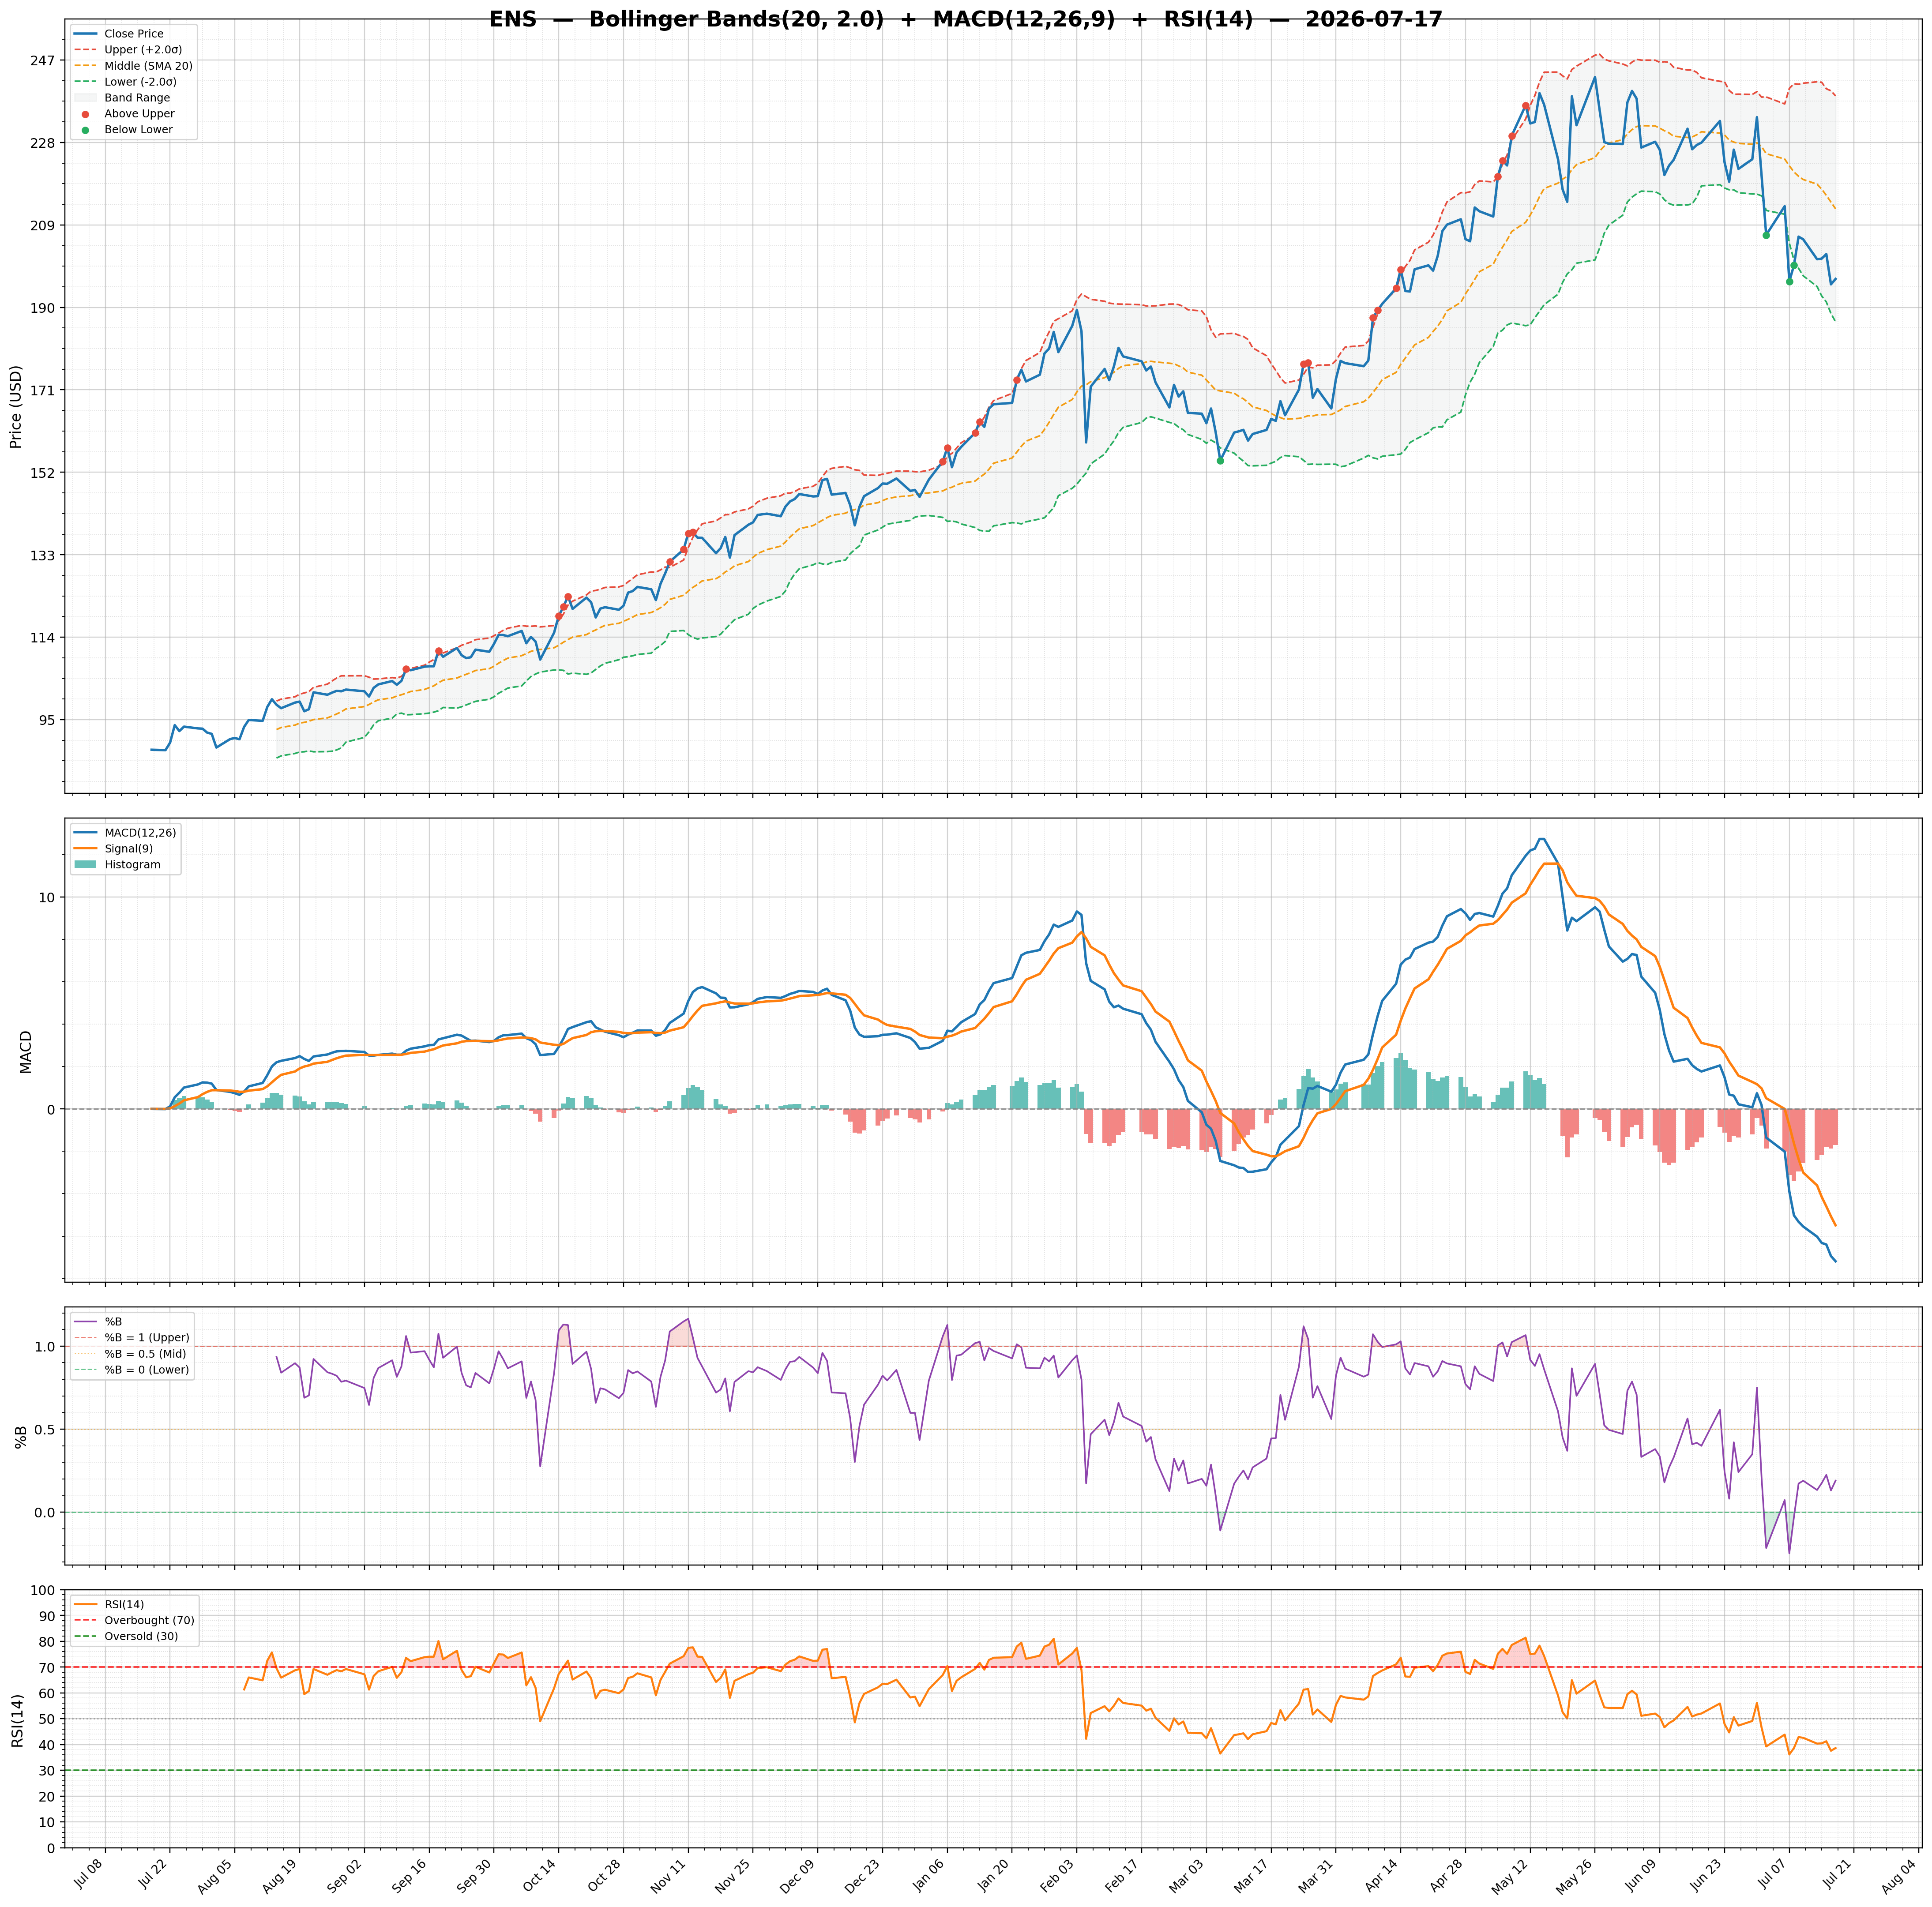
| 2026-07-17 | ENS | 196.55 | / | 70.01% | none | 441,748/614,558 | 24.48/0.19 | 38.63/-1.7000 | 0.43 | -7.18/-5.49 | Chart 3M 🌐 |
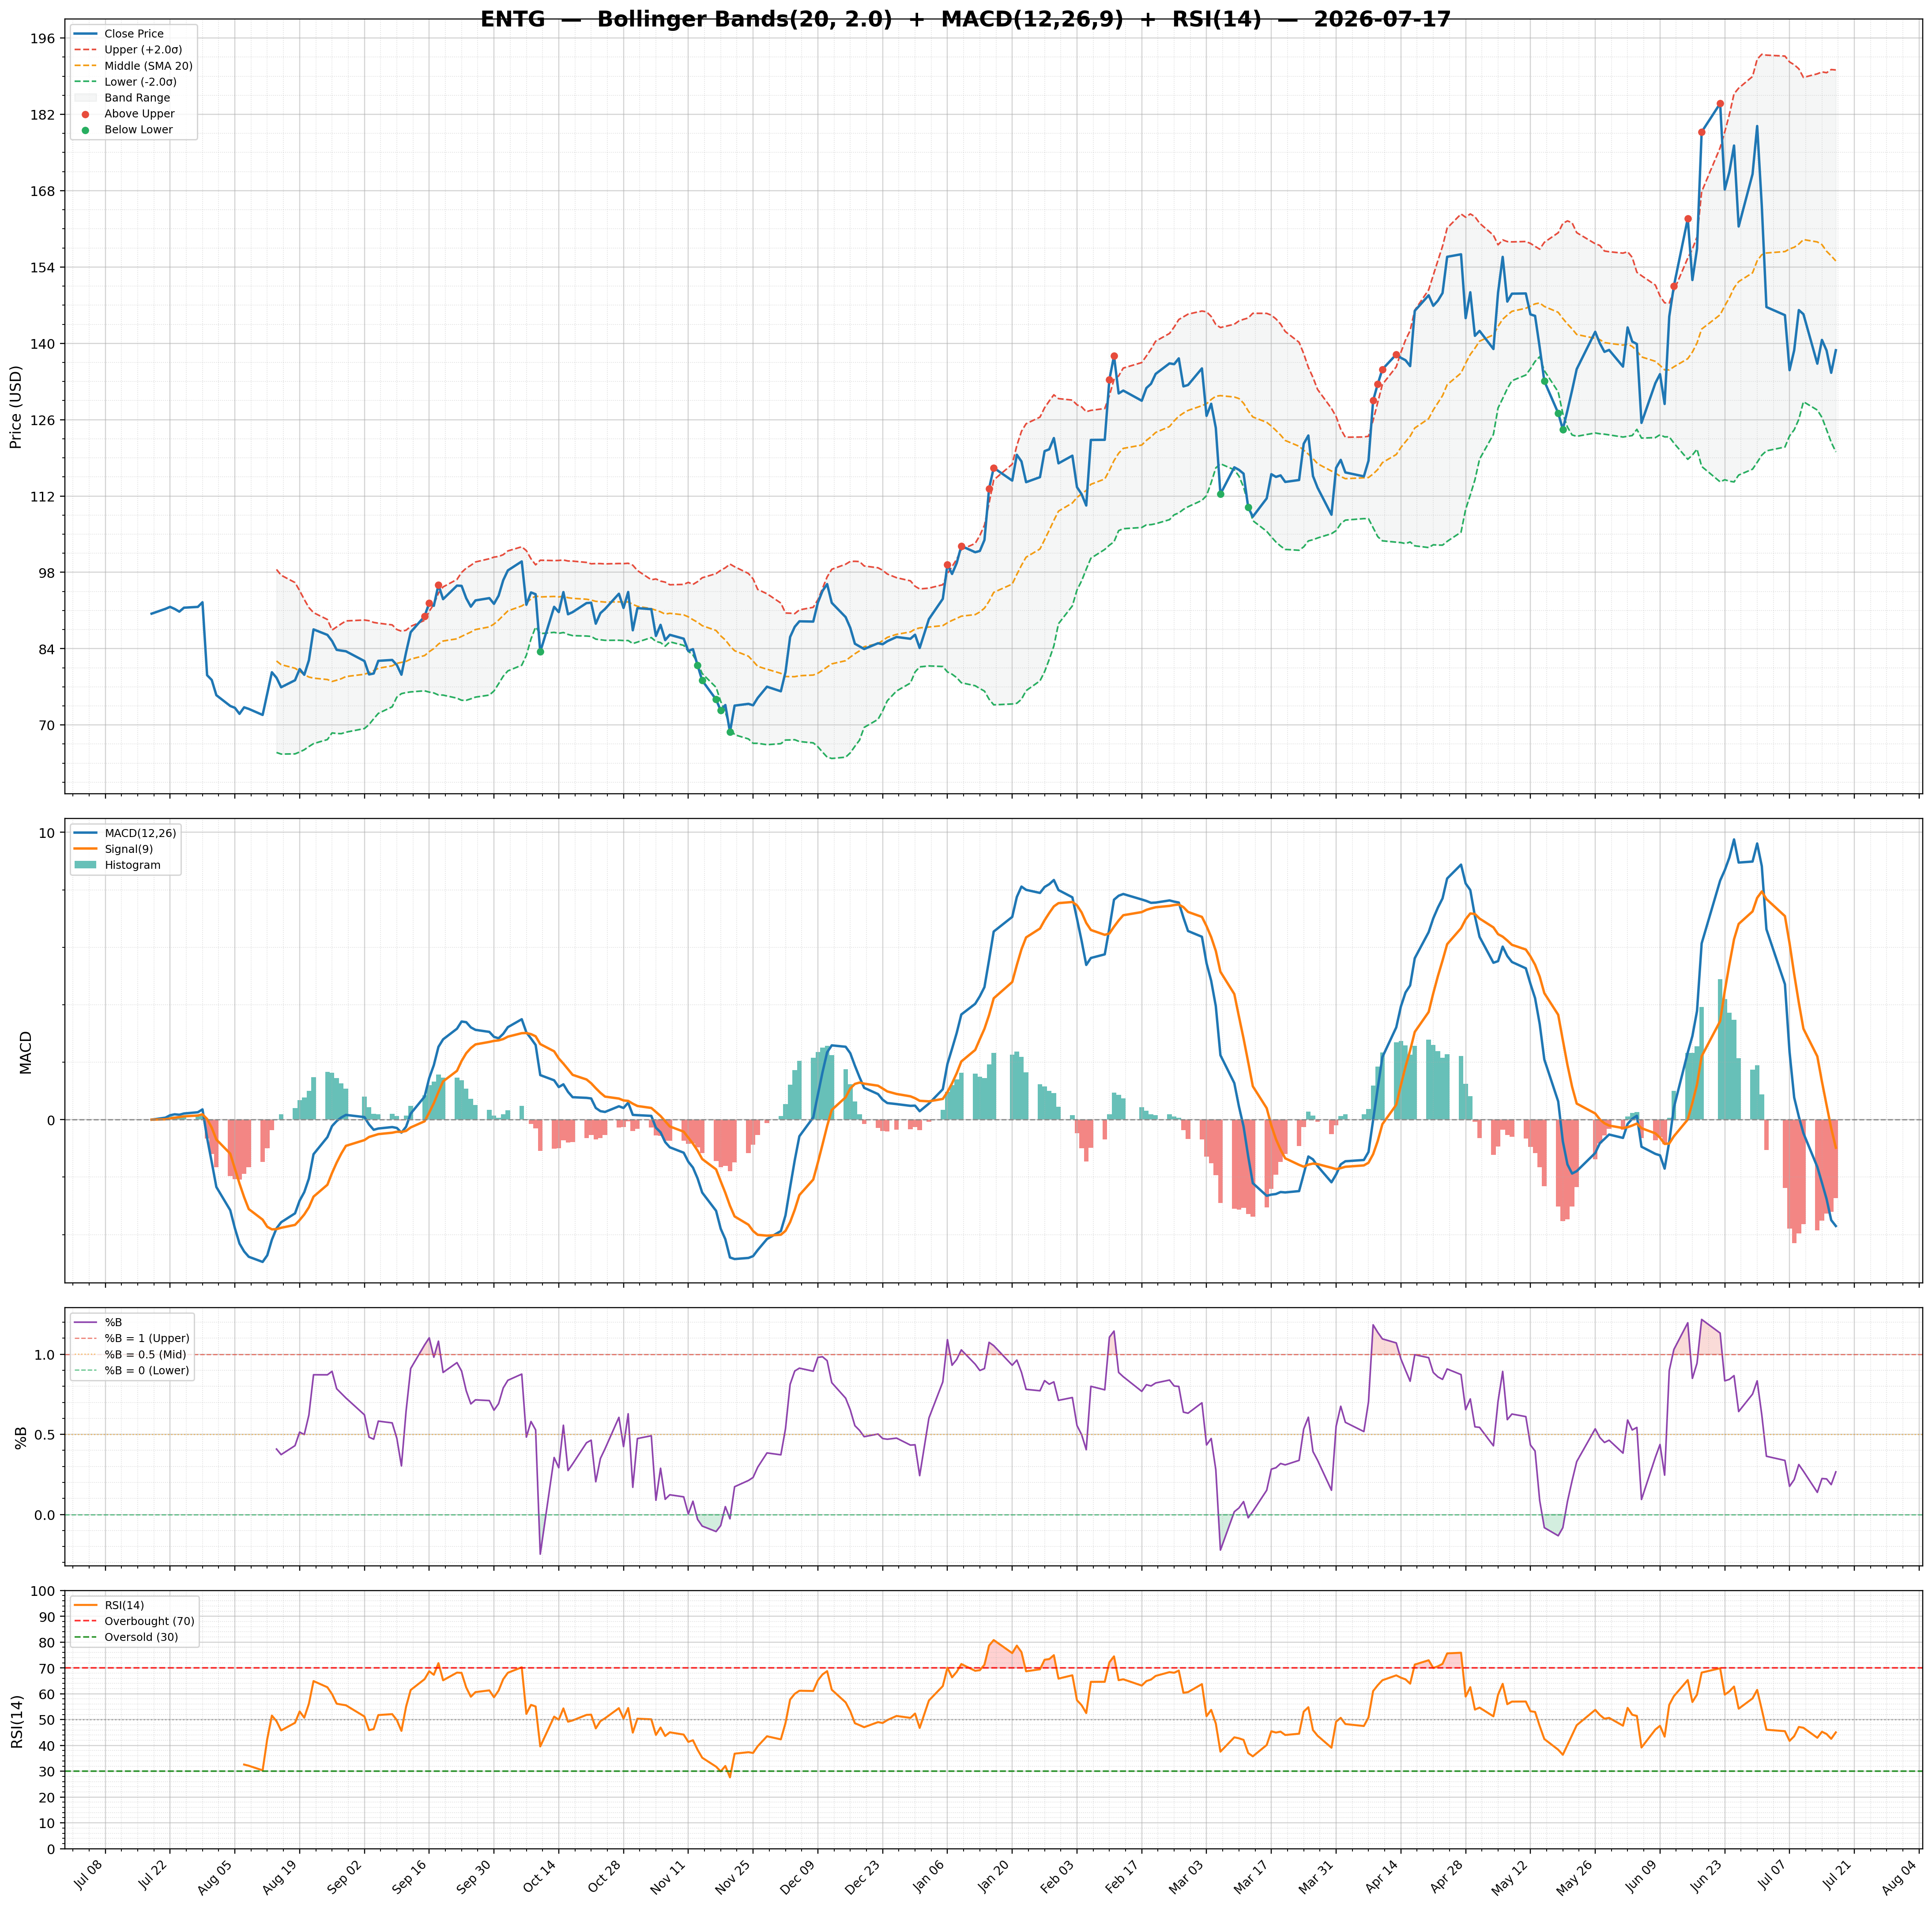
| 2026-07-17 | ENTG | 138.74 | / | 60.75% | buy | 4,454,557/3,678,319 | 45.17/0.27 | 45.07/-2.7300 | 0.29 | -3.70/-0.98 | Chart 3M 🌐 |
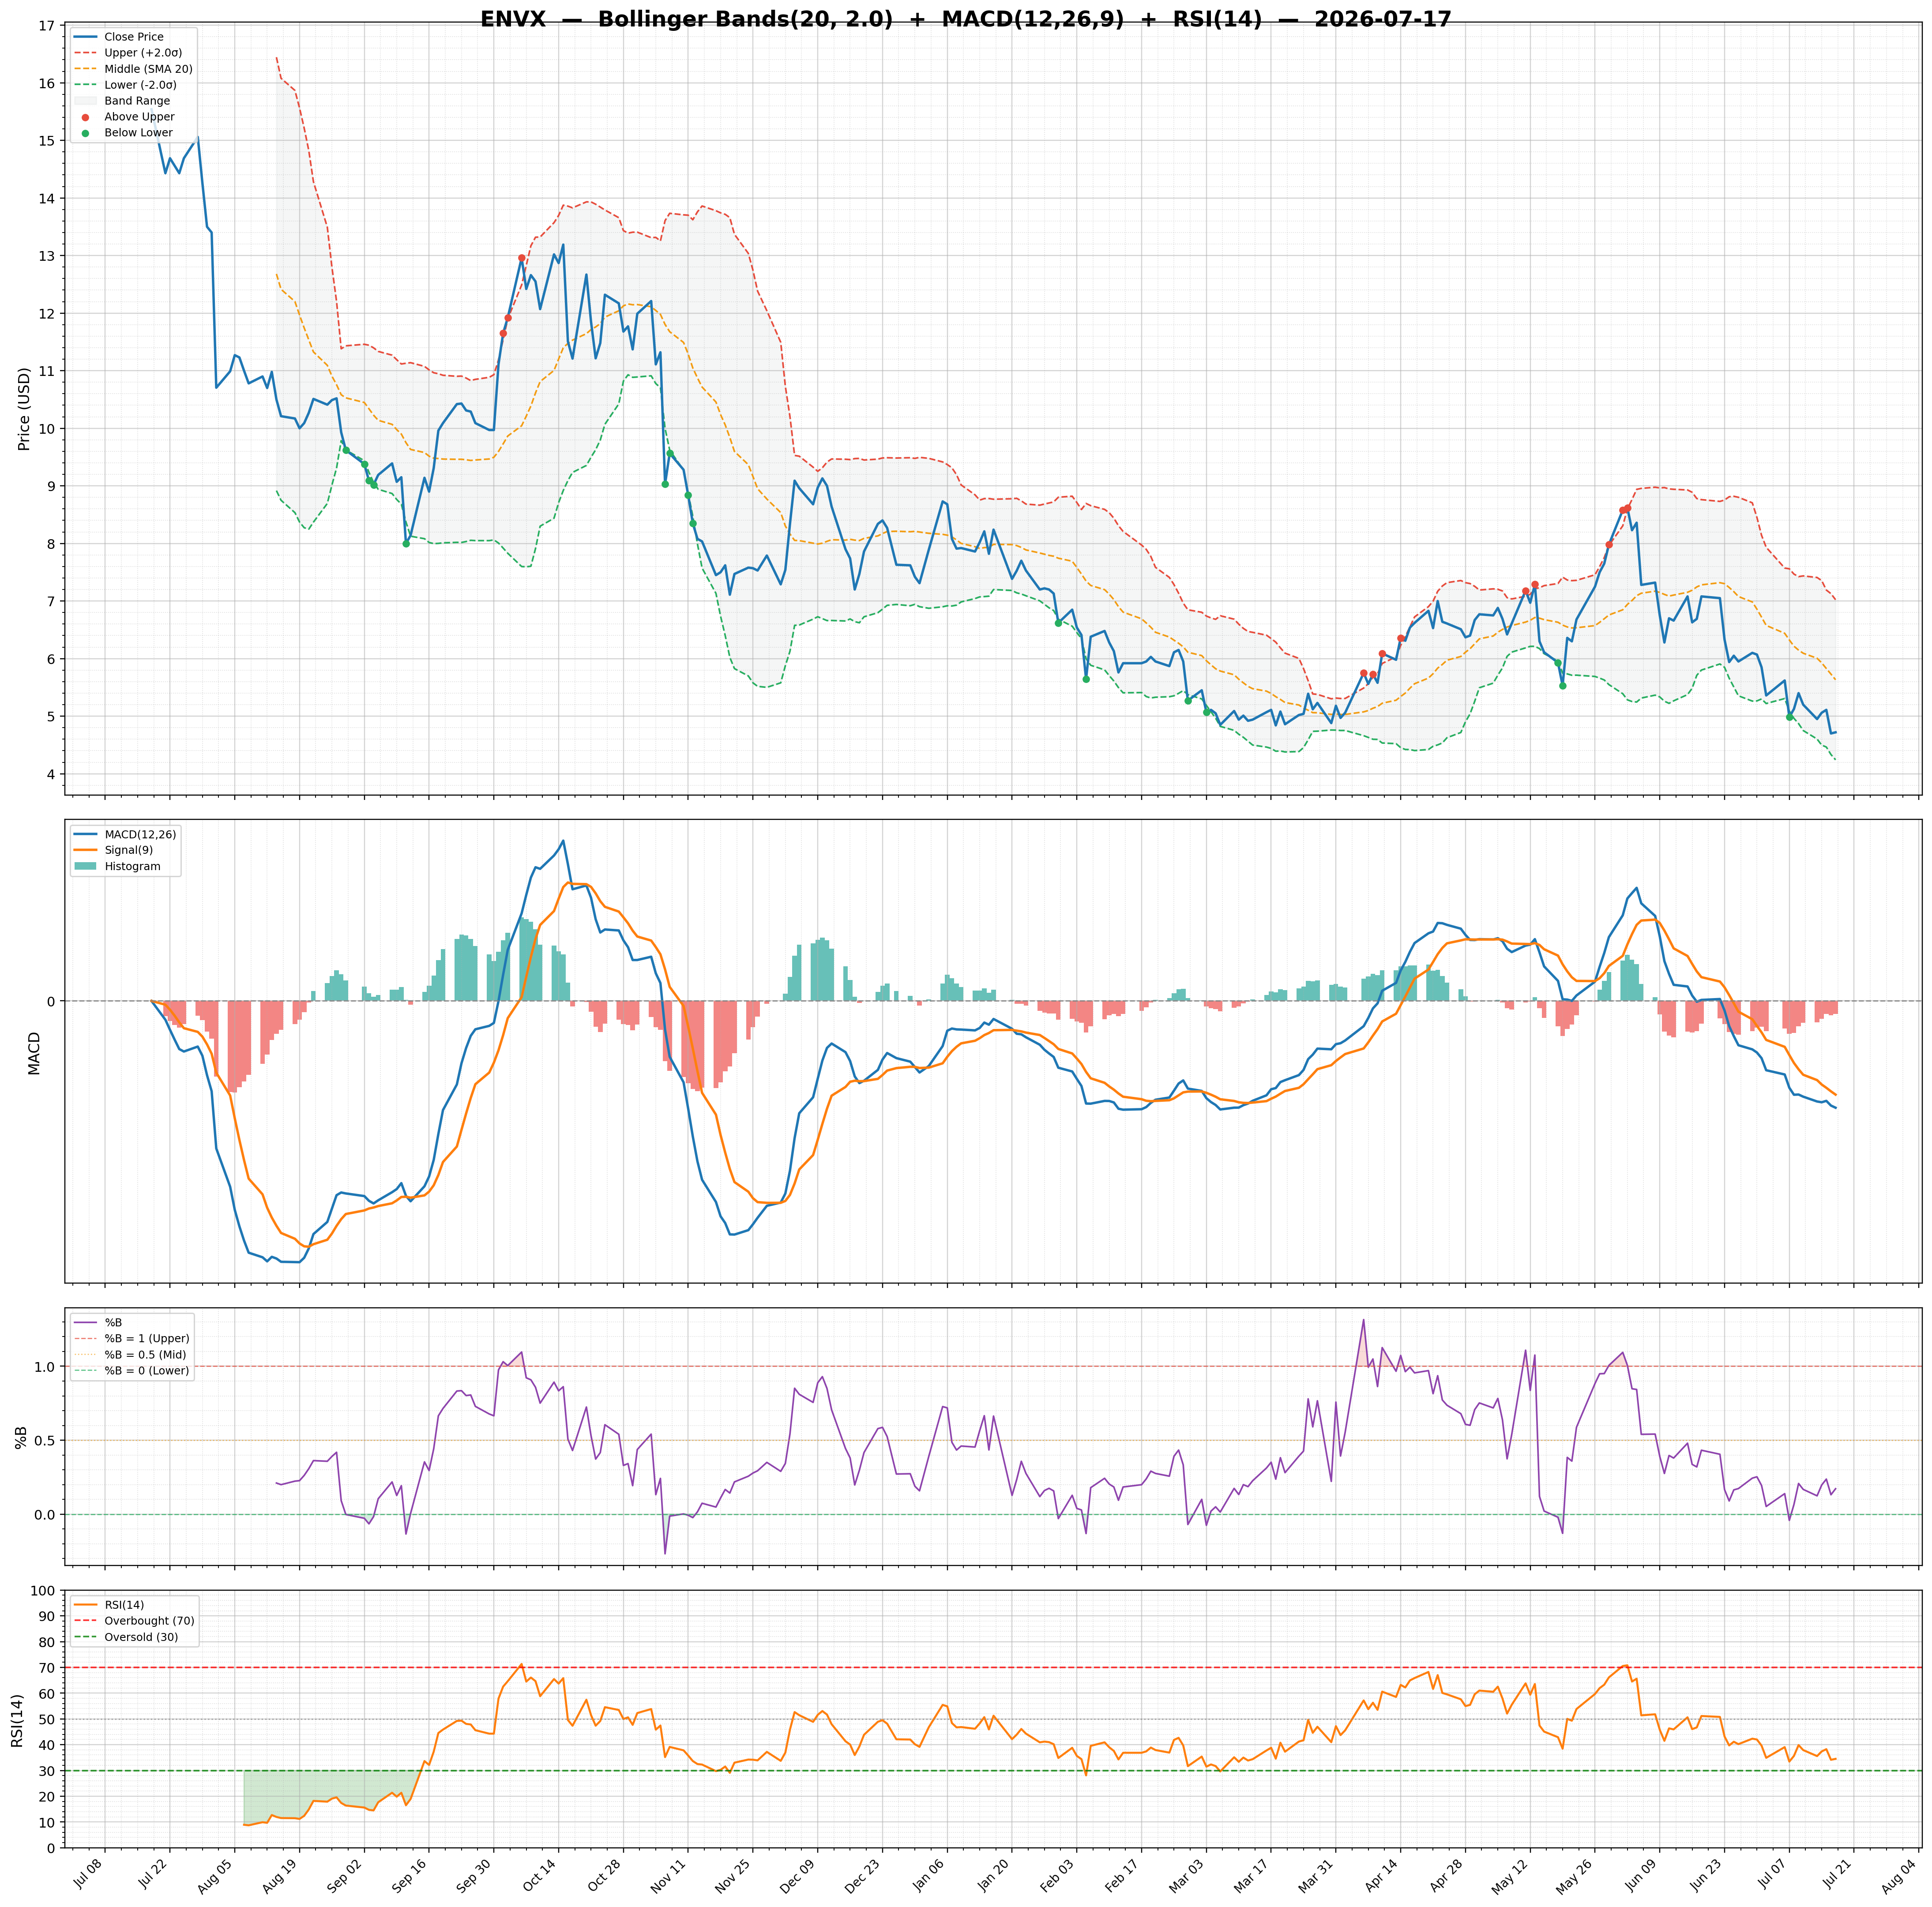
| 2026-07-17 | ENVX | 4.72 | / | 0.18% | buy | 5,960,788/5,809,411 | 49.36/0.17 | 34.50/-0.0600 | -0.46 | -0.50/-0.44 | Chart 3M 🌐 |
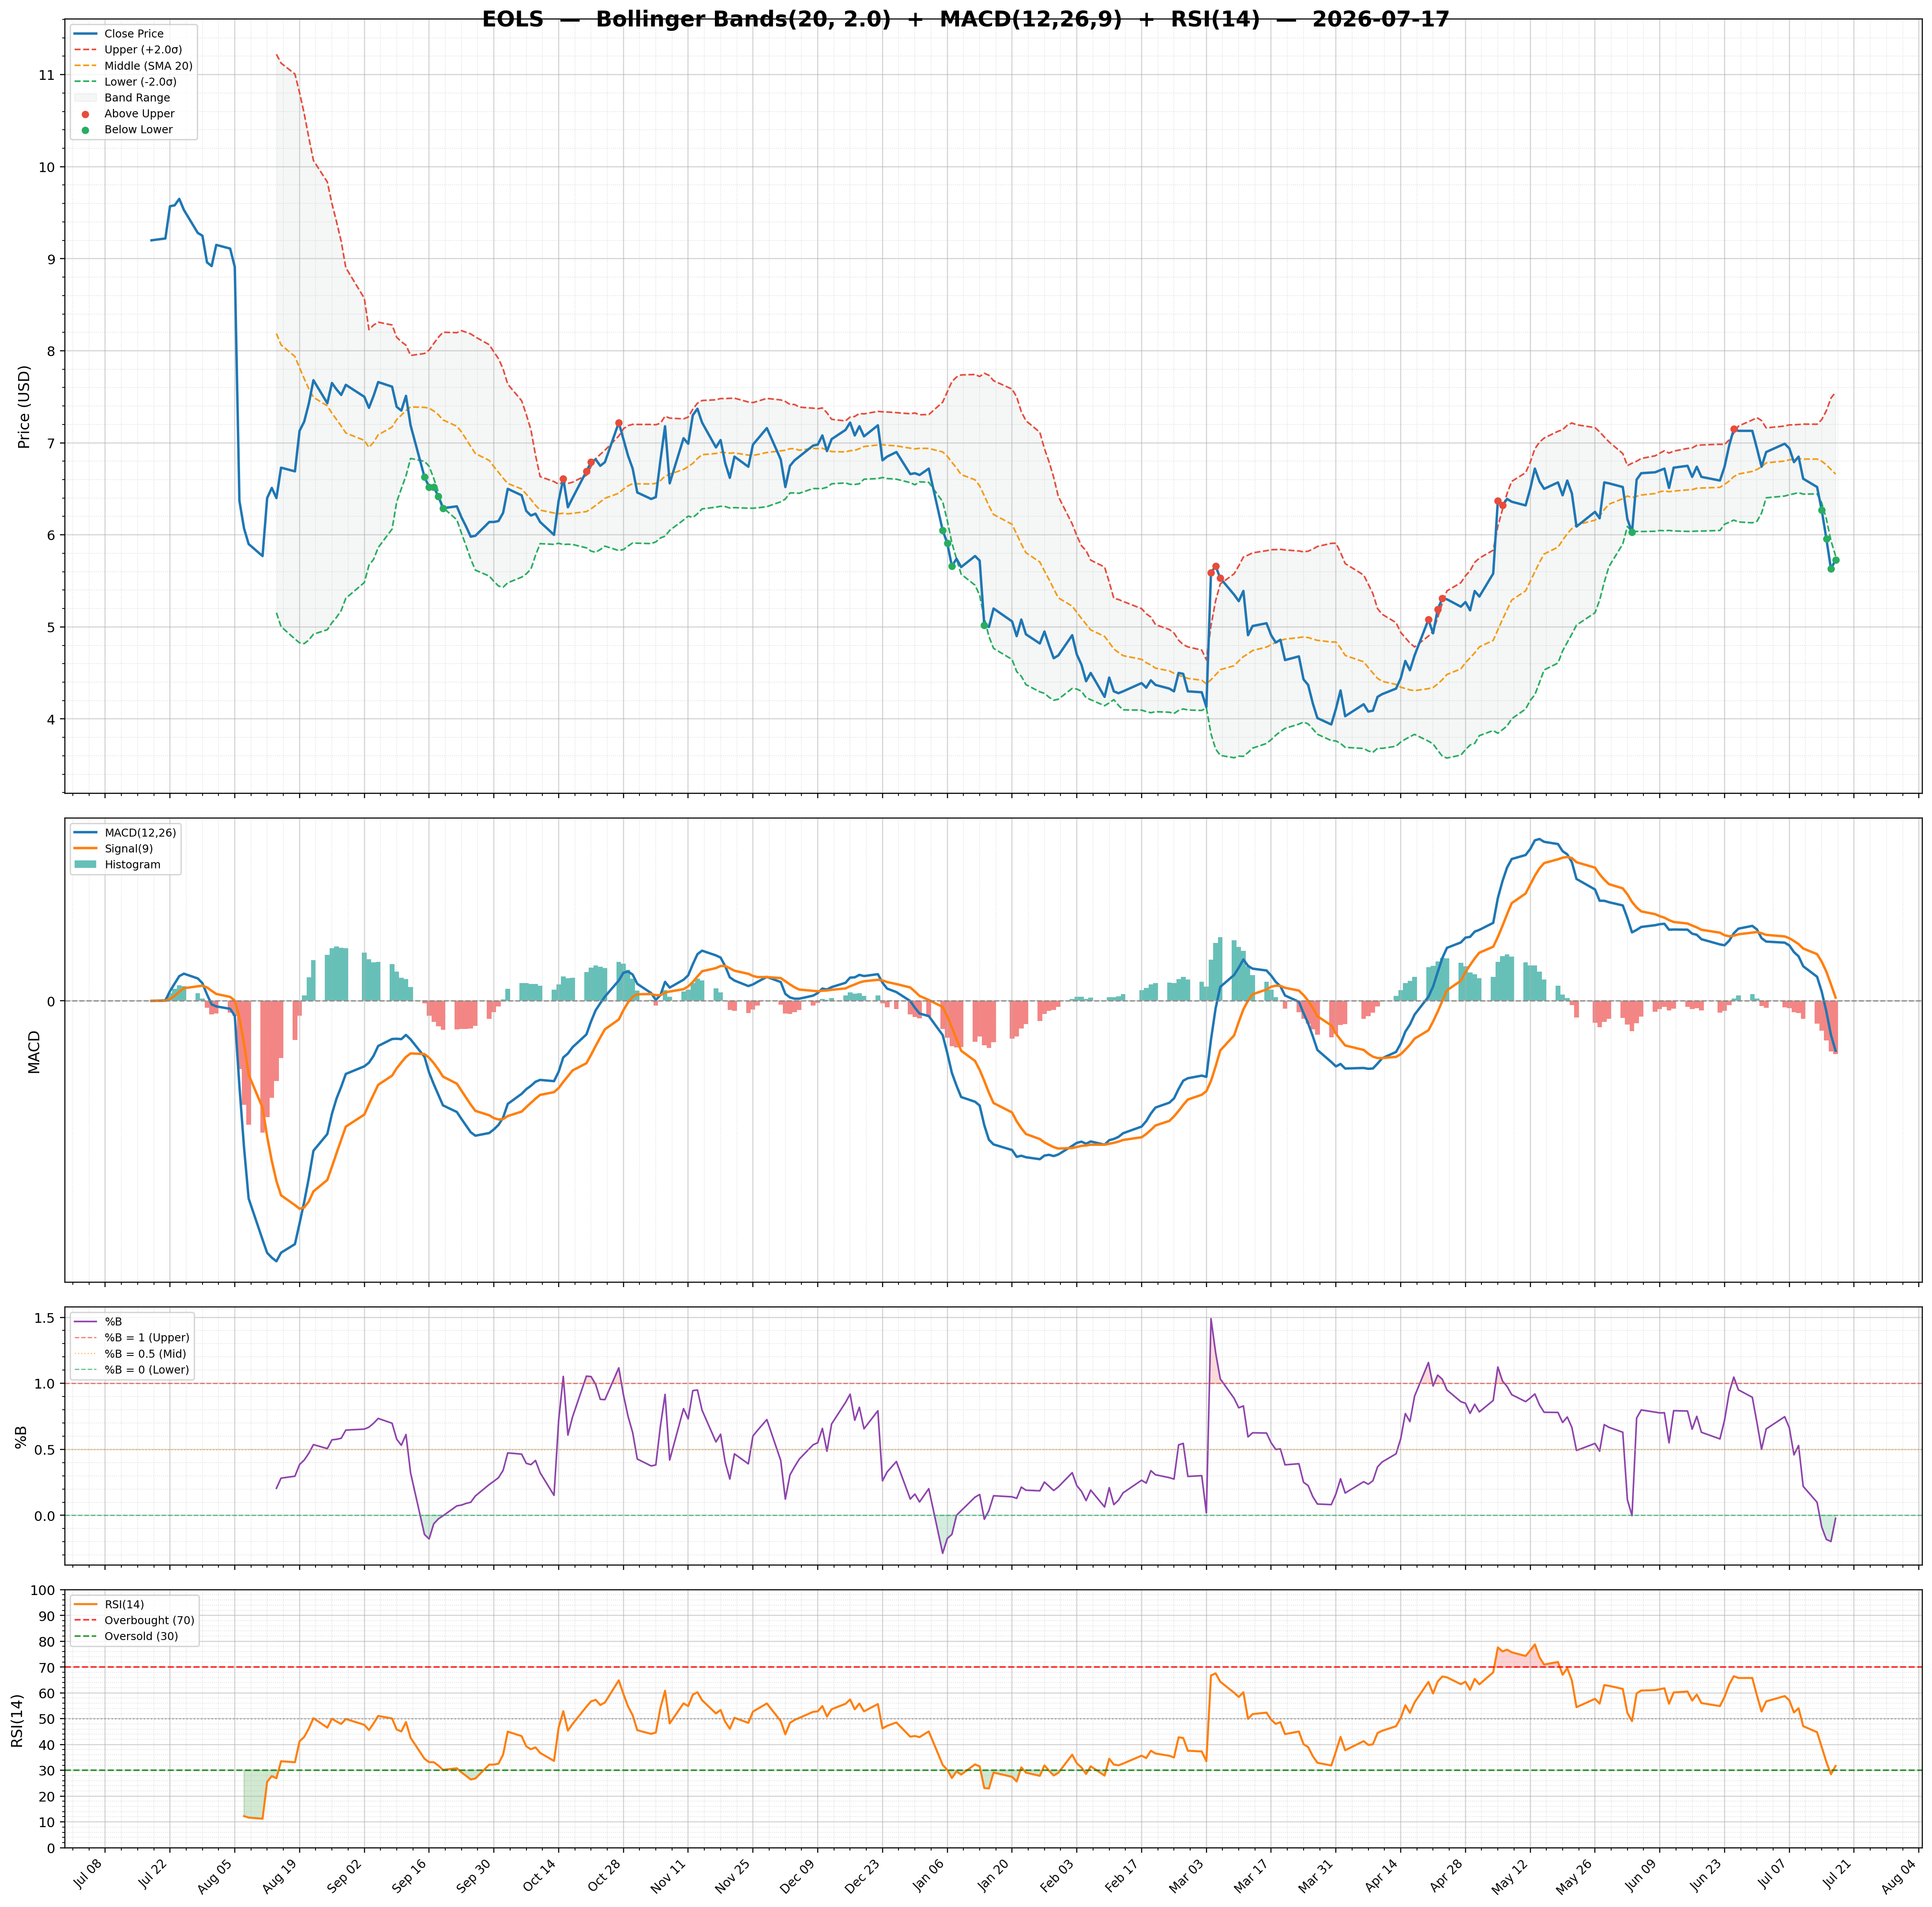
| 2026-07-17 | EOLS | 5.73 | / | 31.35% | strong_buy | 432,270/815,354 | 26.73/-0.02 | 31.70/-0.1700 | 0.04 | -0.16/0.01 | Chart 3M 🌐 |
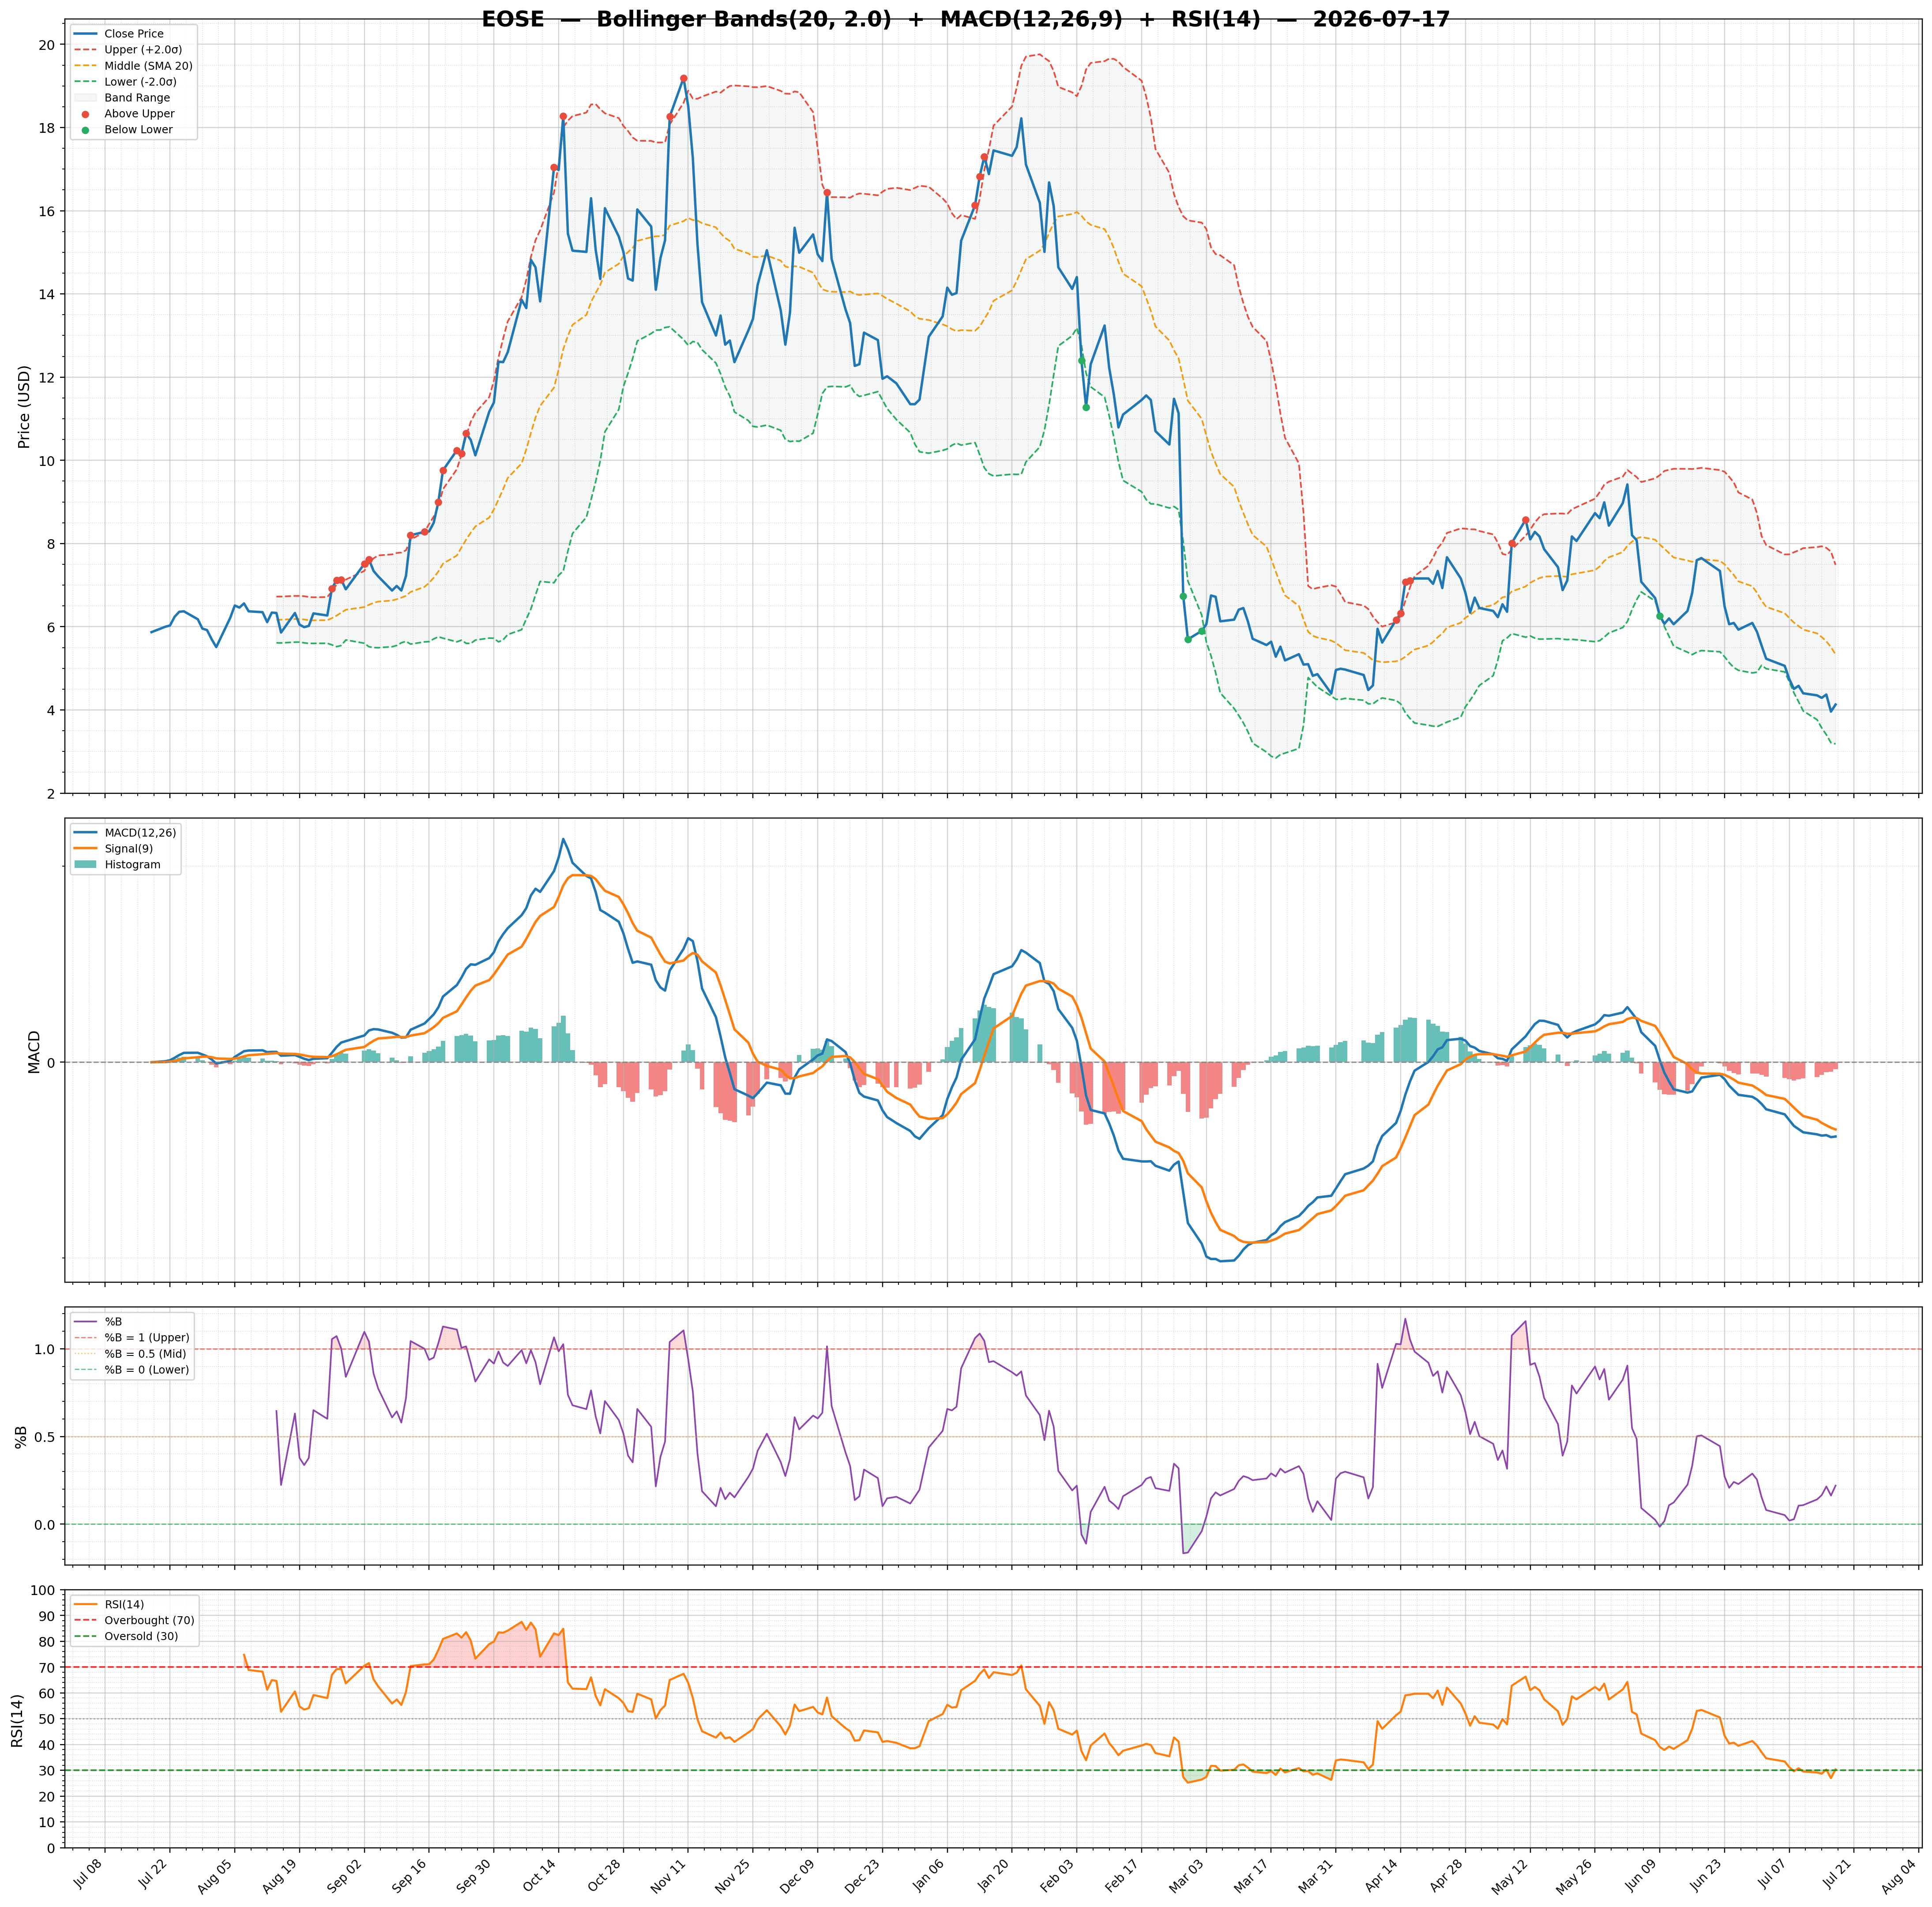
| 2026-07-17 | EOSE | 4.13 | / | 1.12% | buy | 28,033,235/25,961,802 | 80.66/0.22 | 30.36/-0.0700 | -0.53 | -0.76/-0.69 | Chart 3M 🌐 |
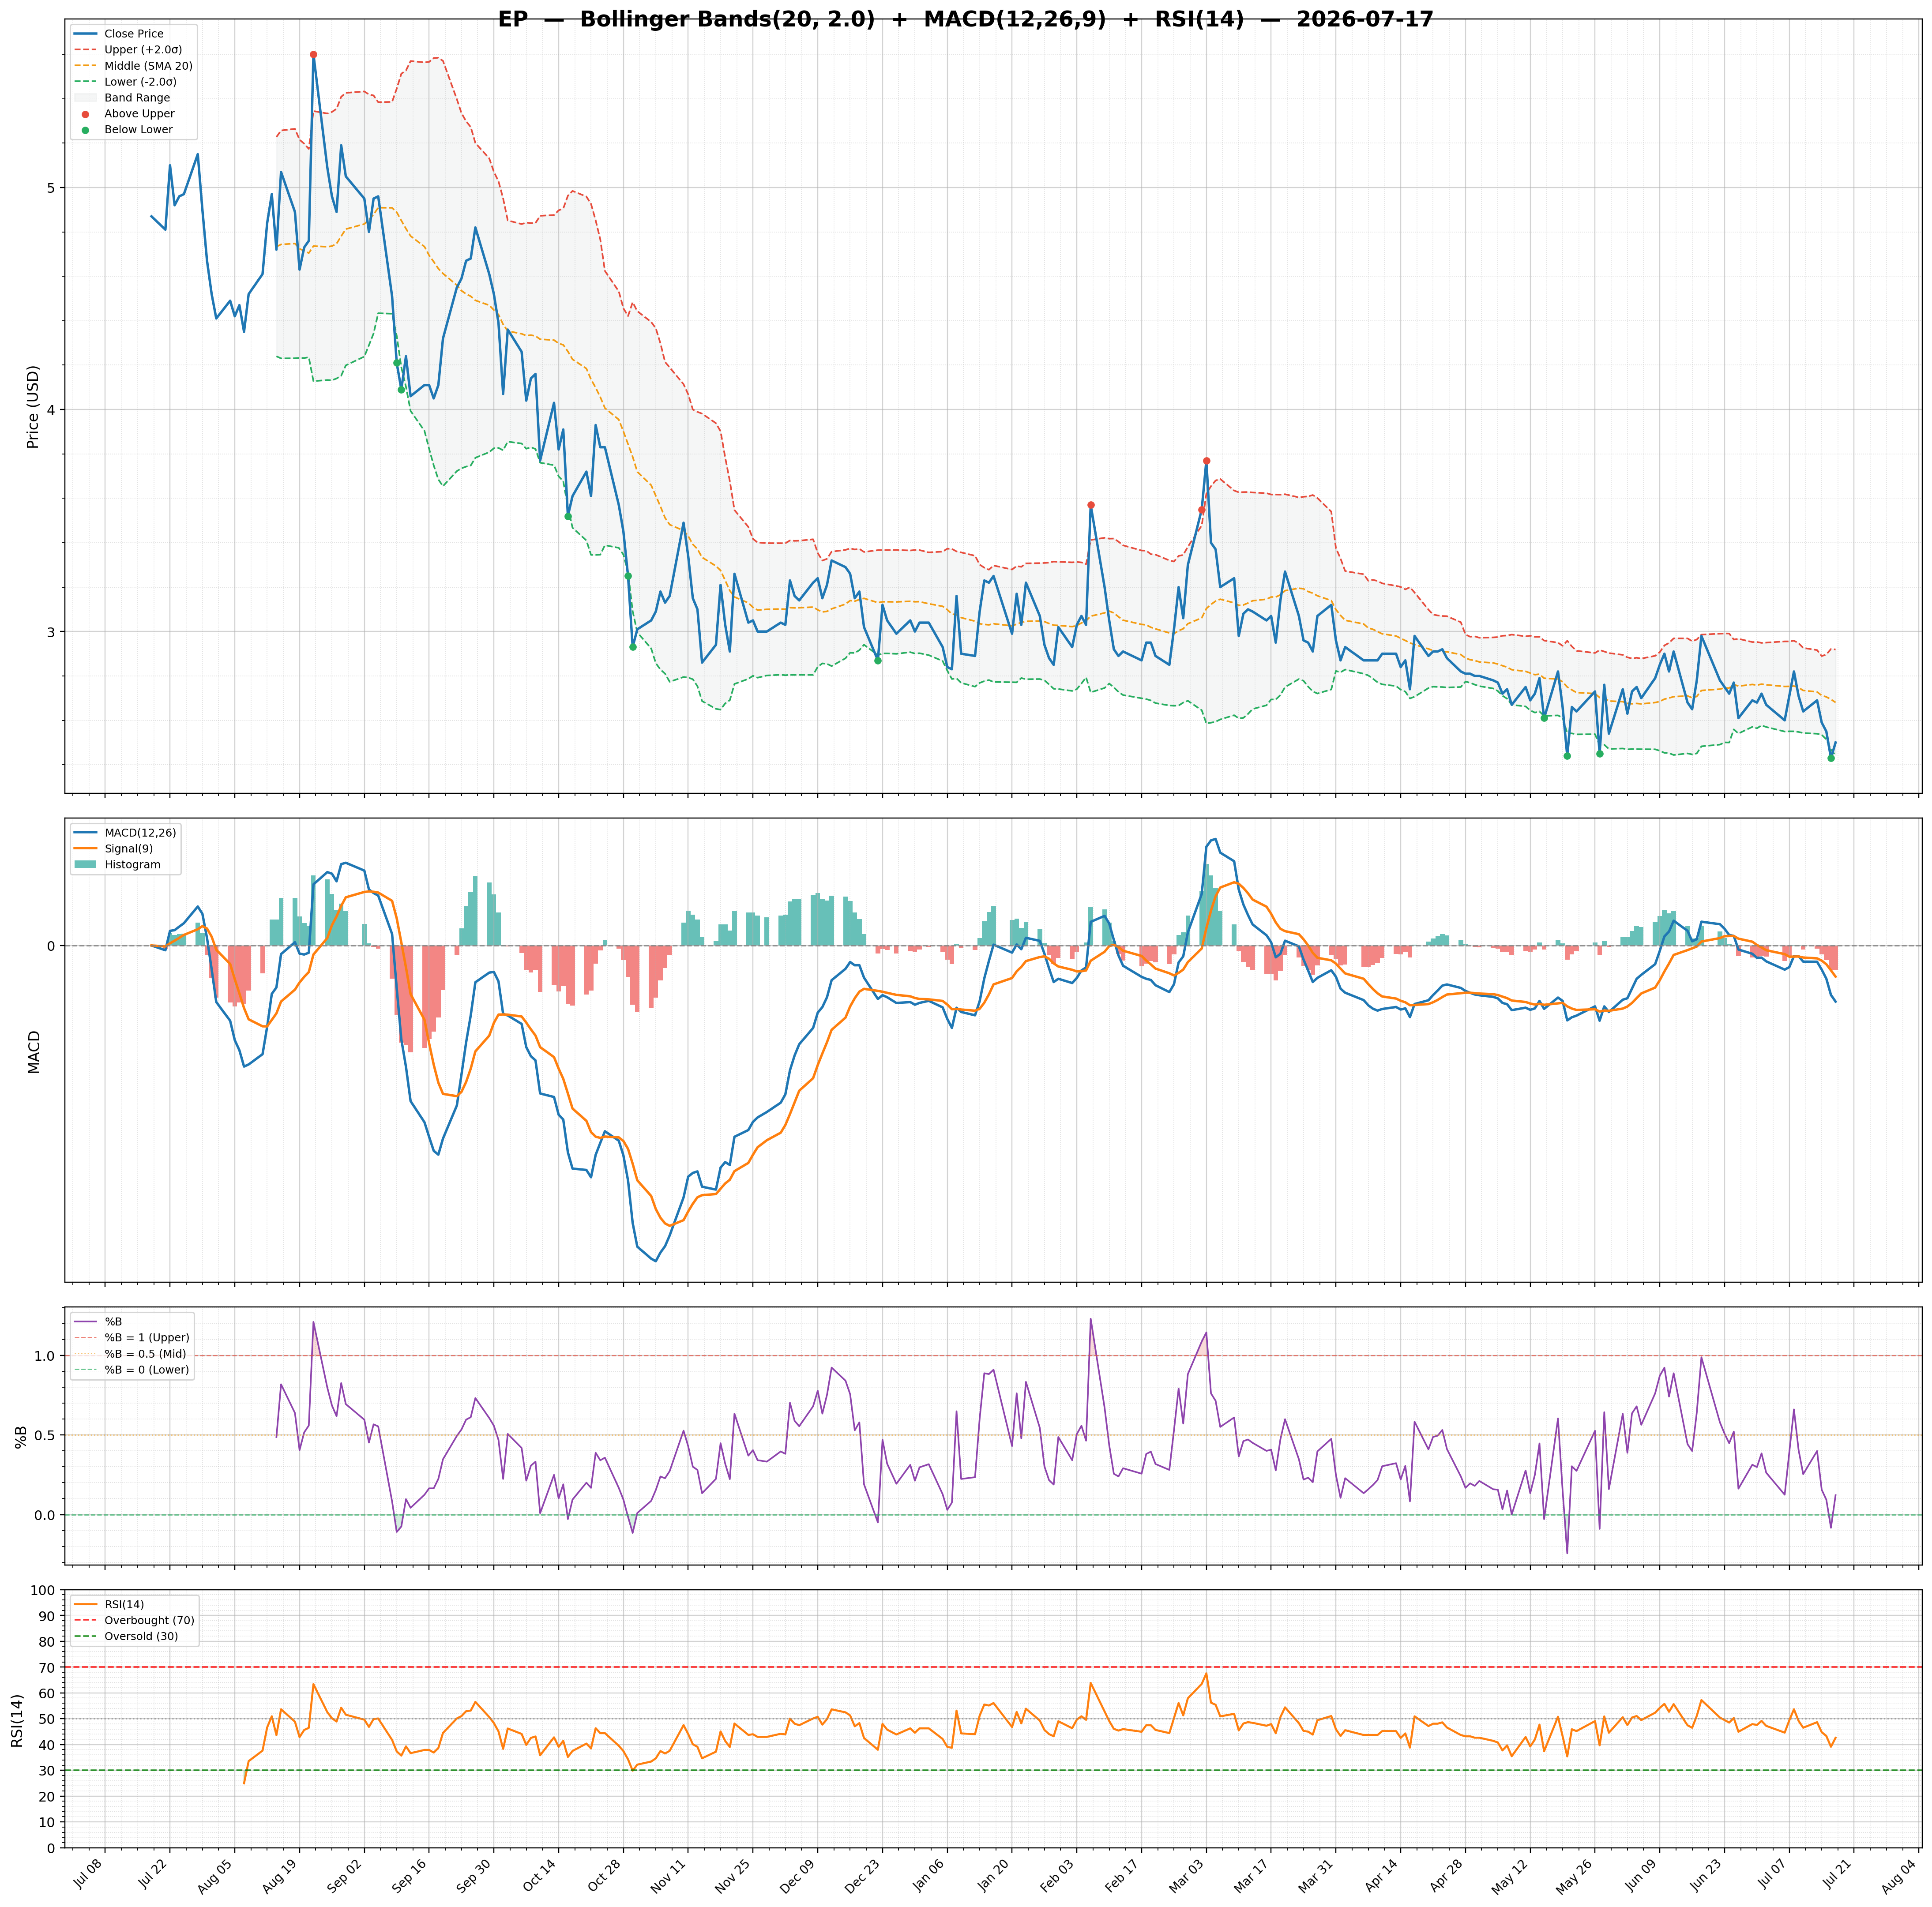
| 2026-07-17 | EP | 2.50 | / | 2.21% | none | 23,283/182,334 | 17.81/0.12 | 42.61/-0.0200 | -0.25 | -0.06/-0.03 | Chart 3M 🌐 |
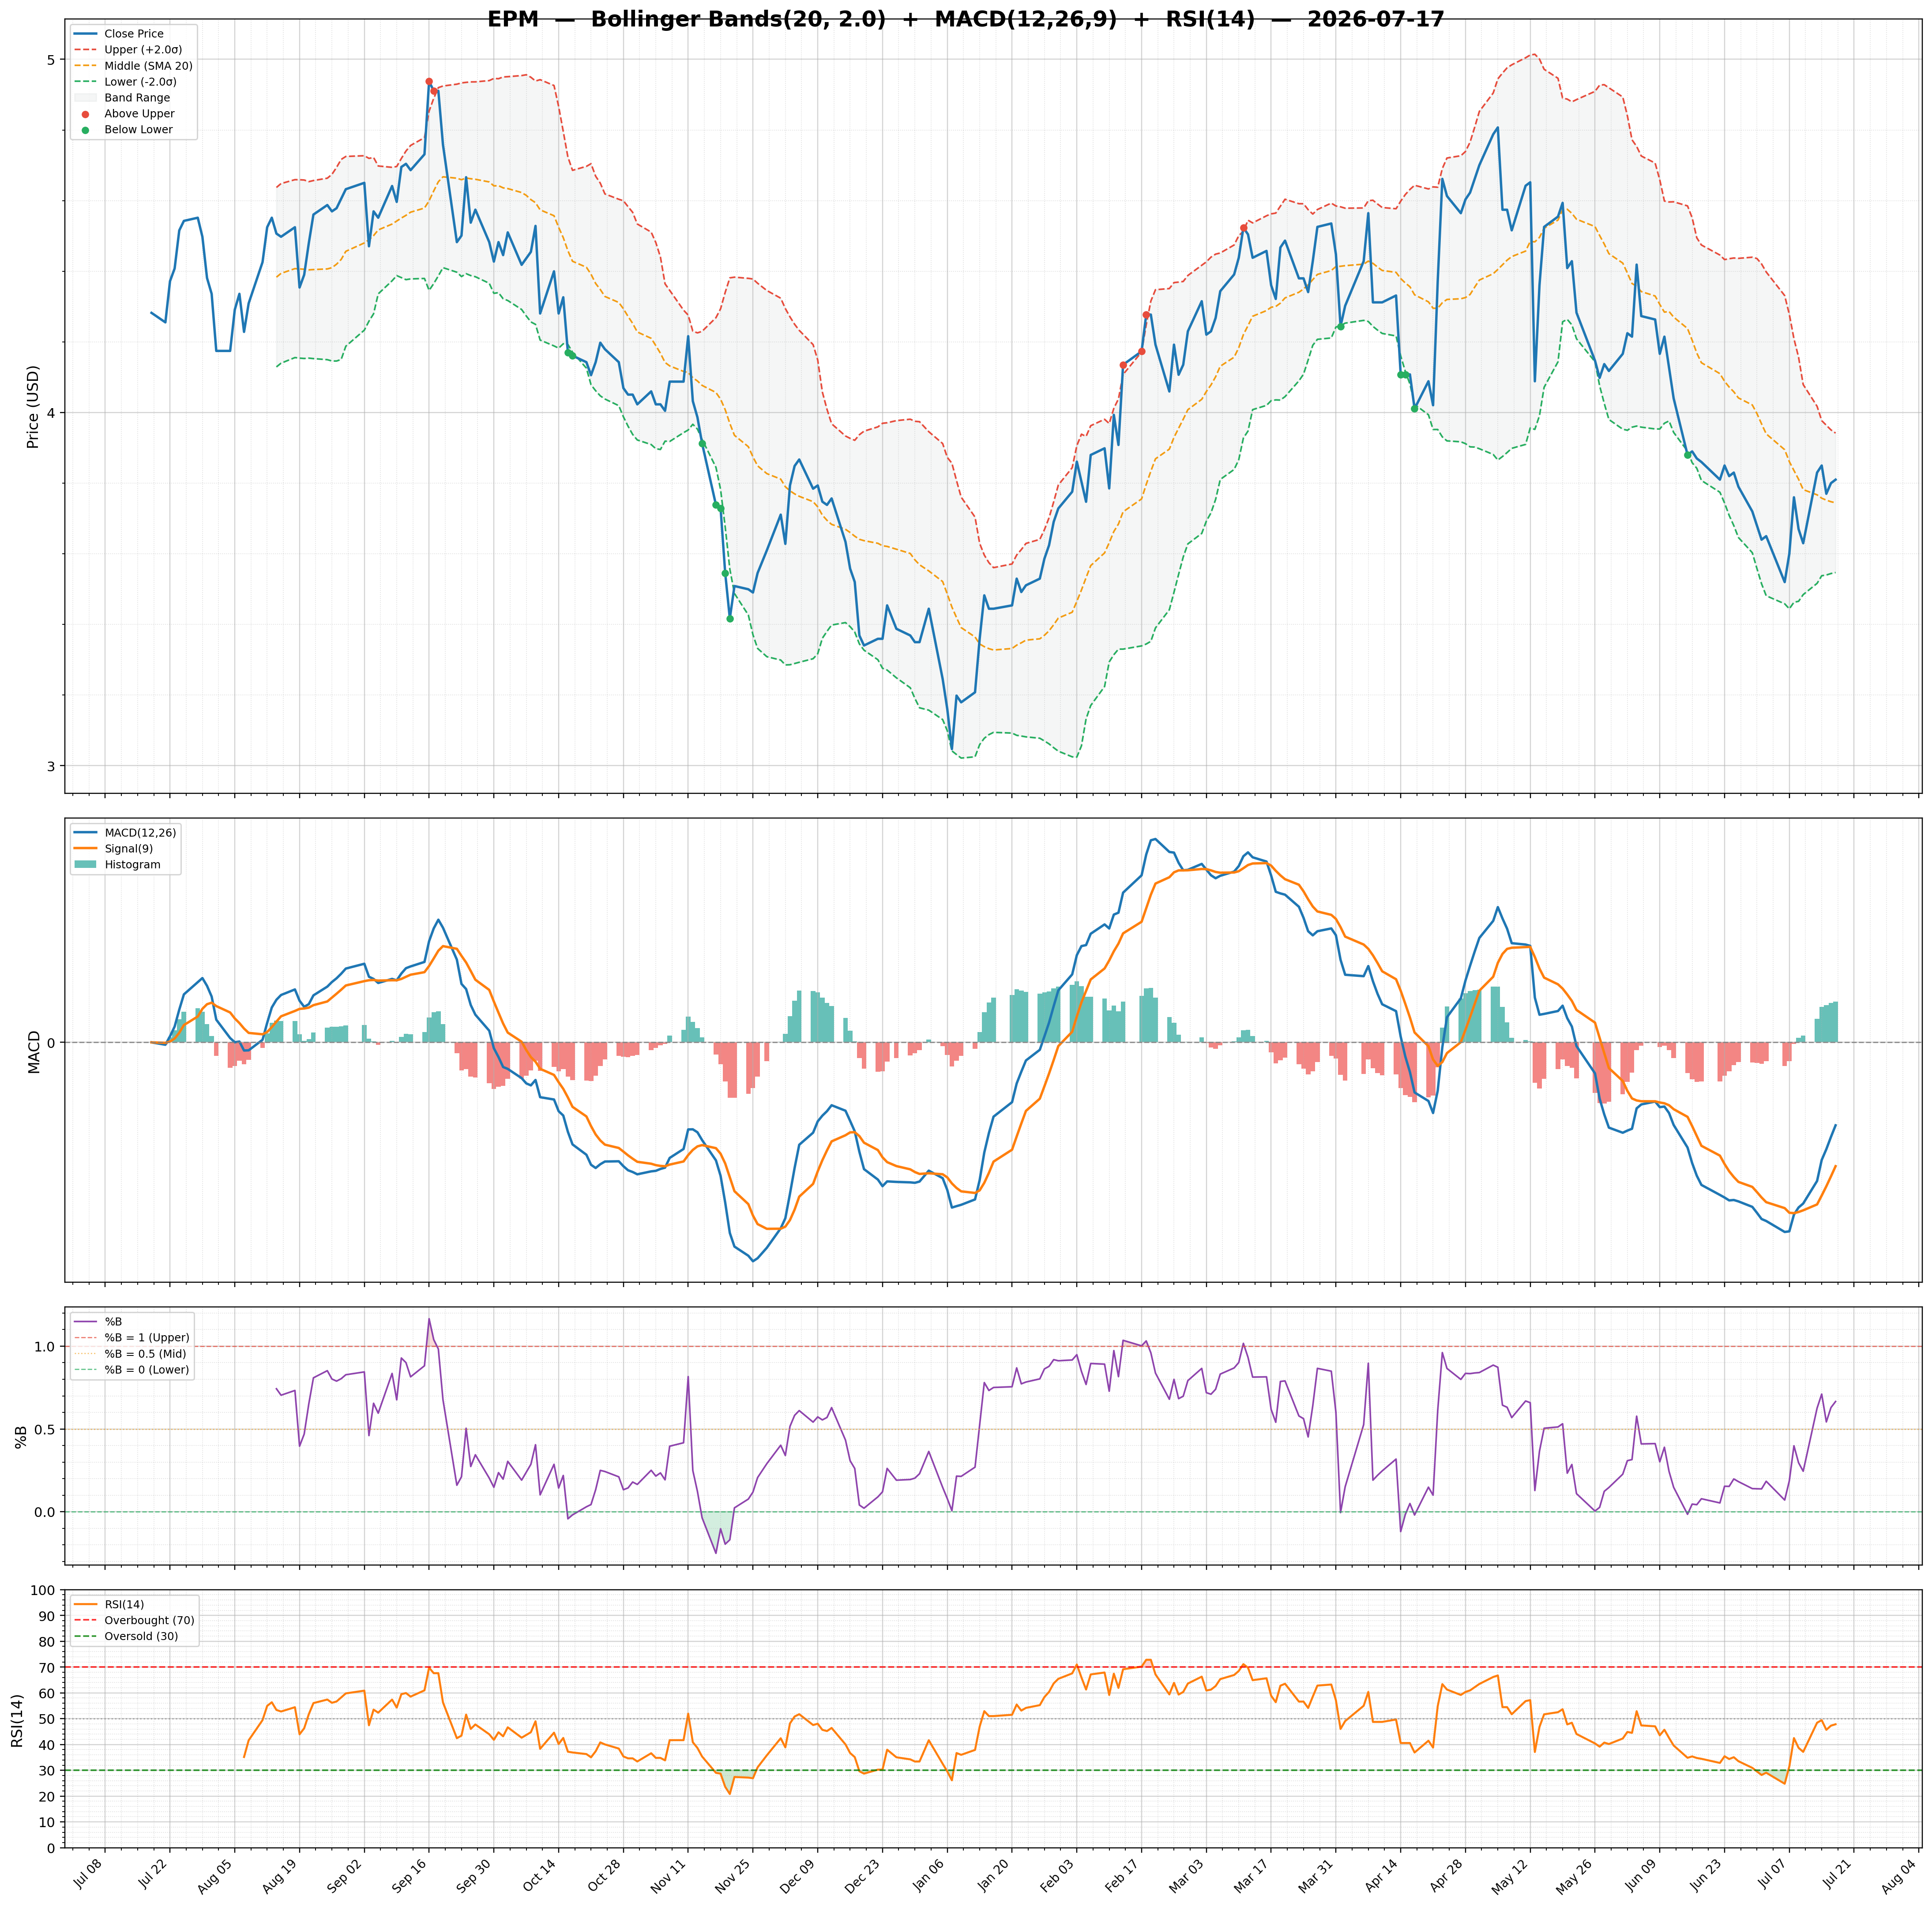
| 2026-07-17 | EPM | 3.81 | / | 40.21% | buy | 137,050/351,742 | 10.54/0.67 | 47.85/0.0400 | -0.05 | -0.08/-0.11 | Chart 3M 🌐 |
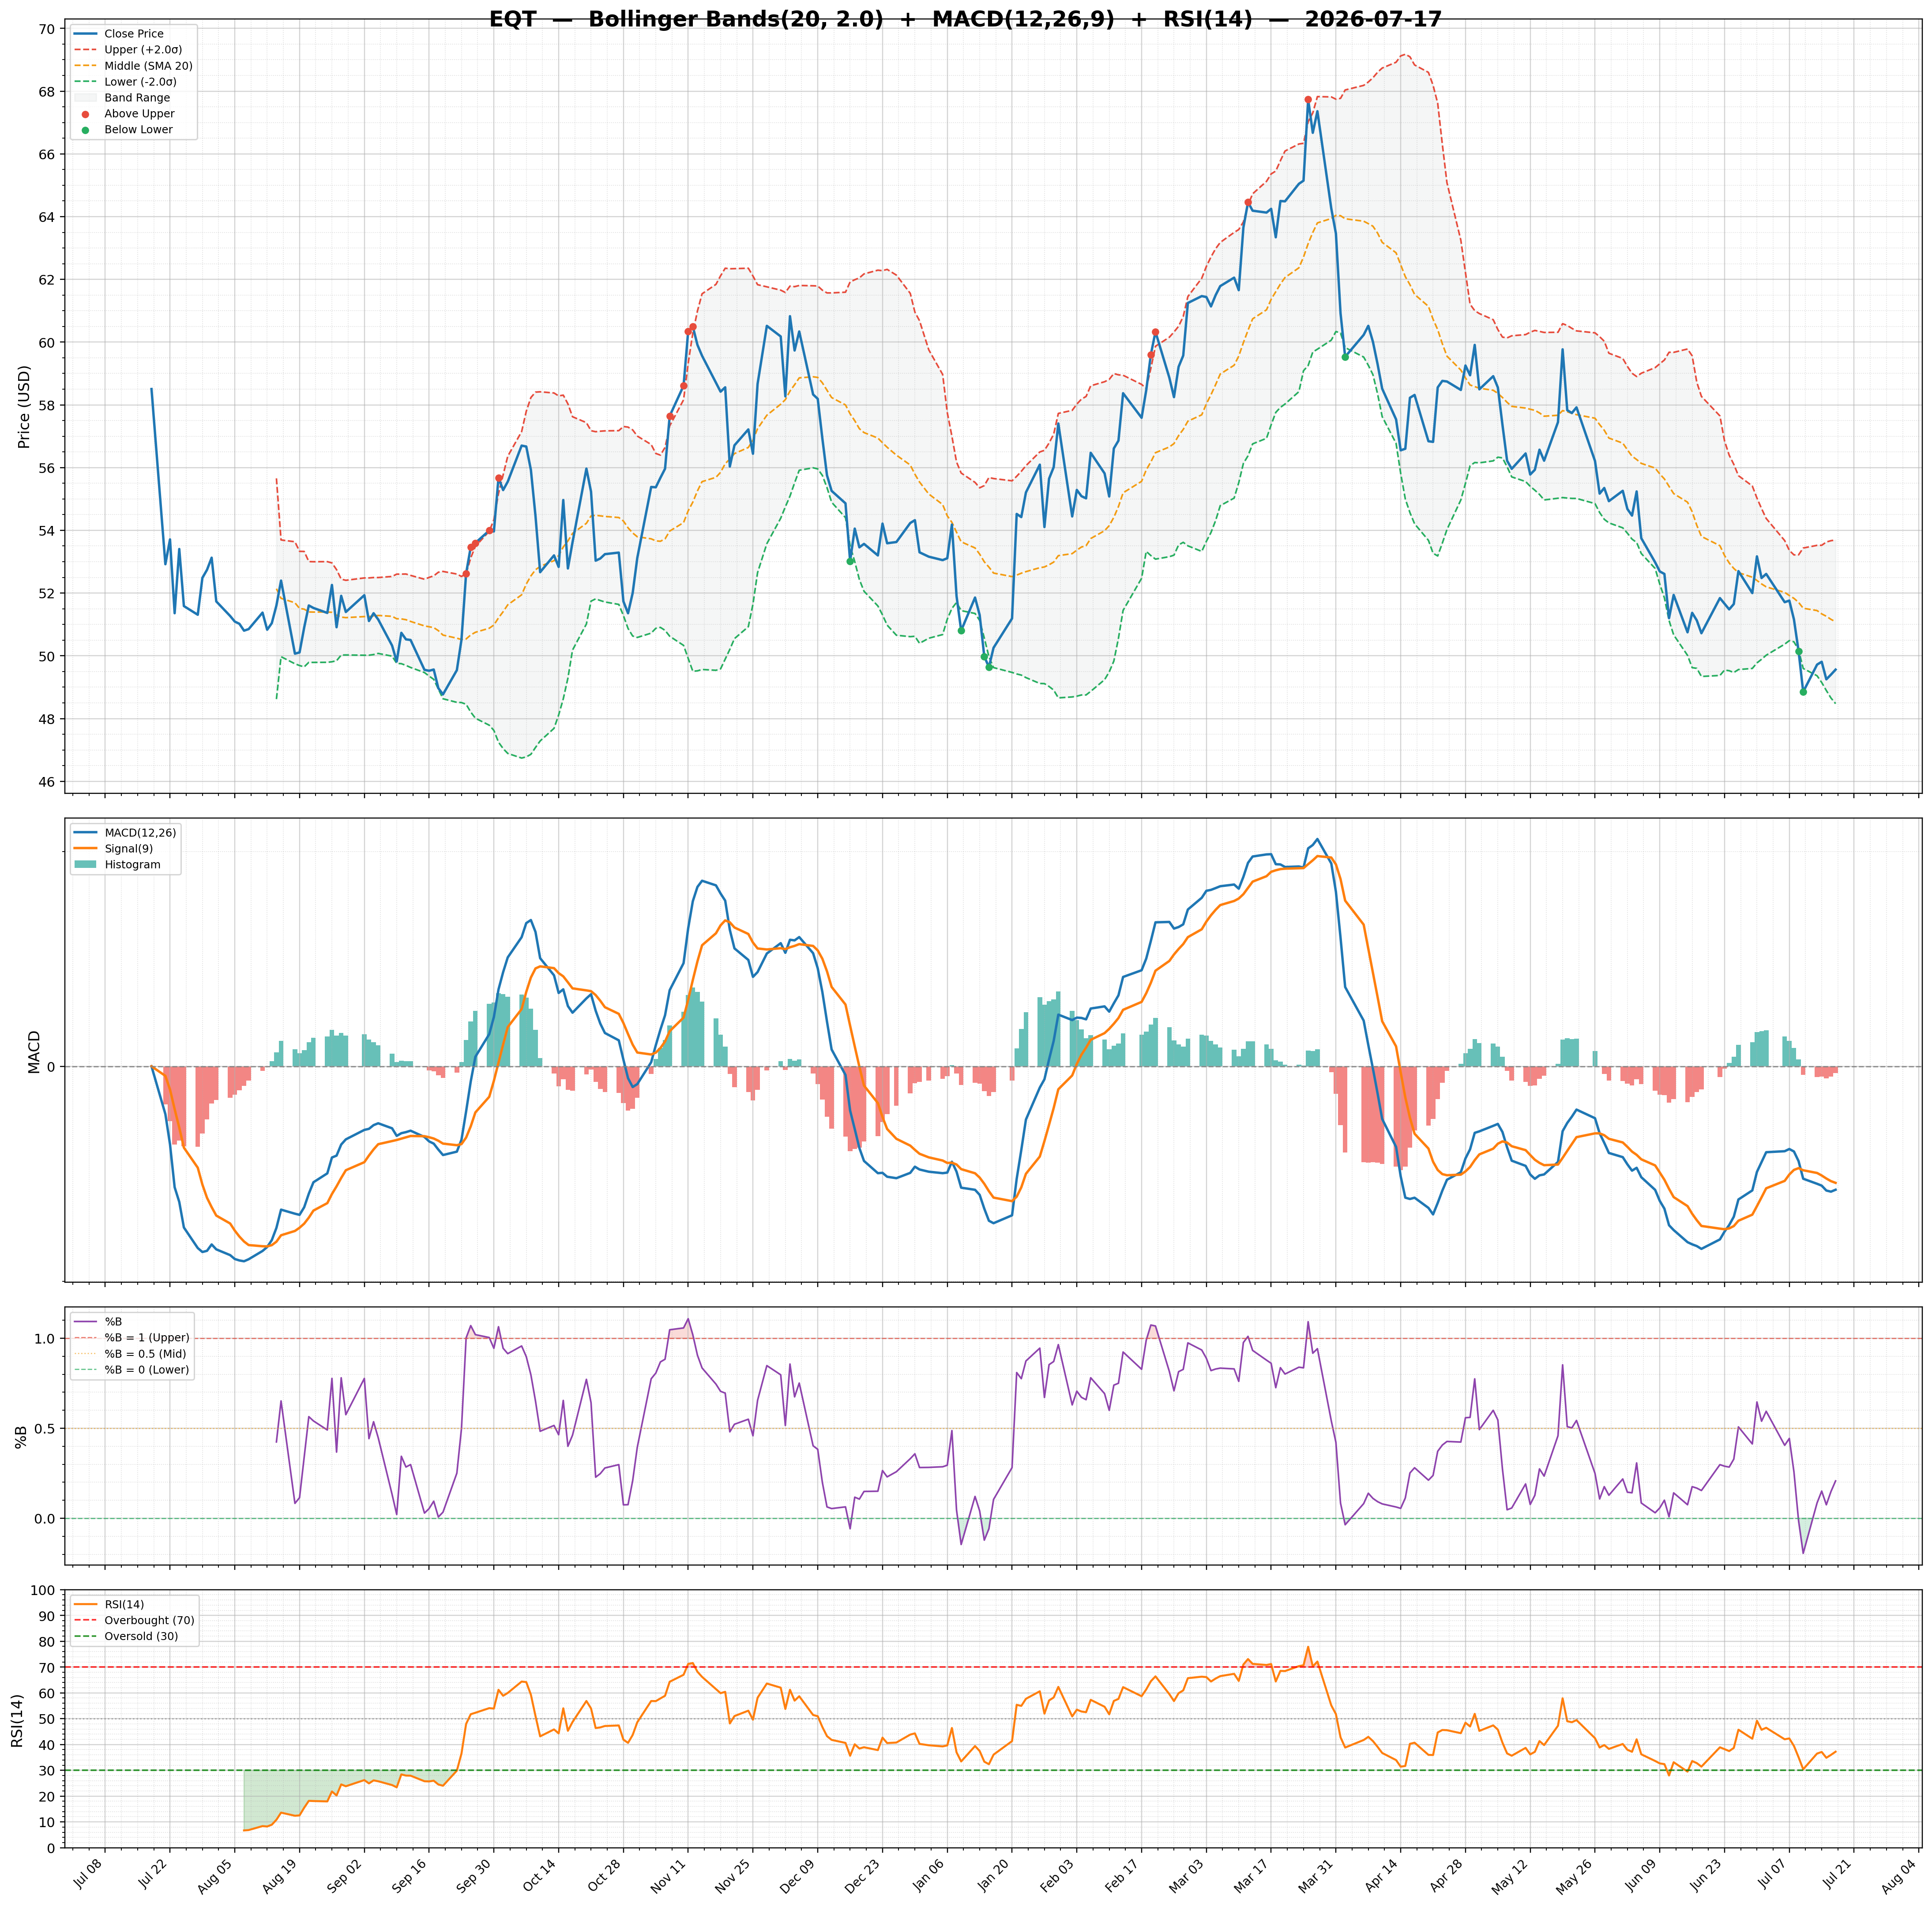
| 2026-07-17 | EQT | 49.56 | / | 4.16% | buy | 5,485,166/8,192,454 | 10.21/0.21 | 37.22/-0.0600 | -0.09 | -1.15/-1.08 | Chart 3M 🌐 |
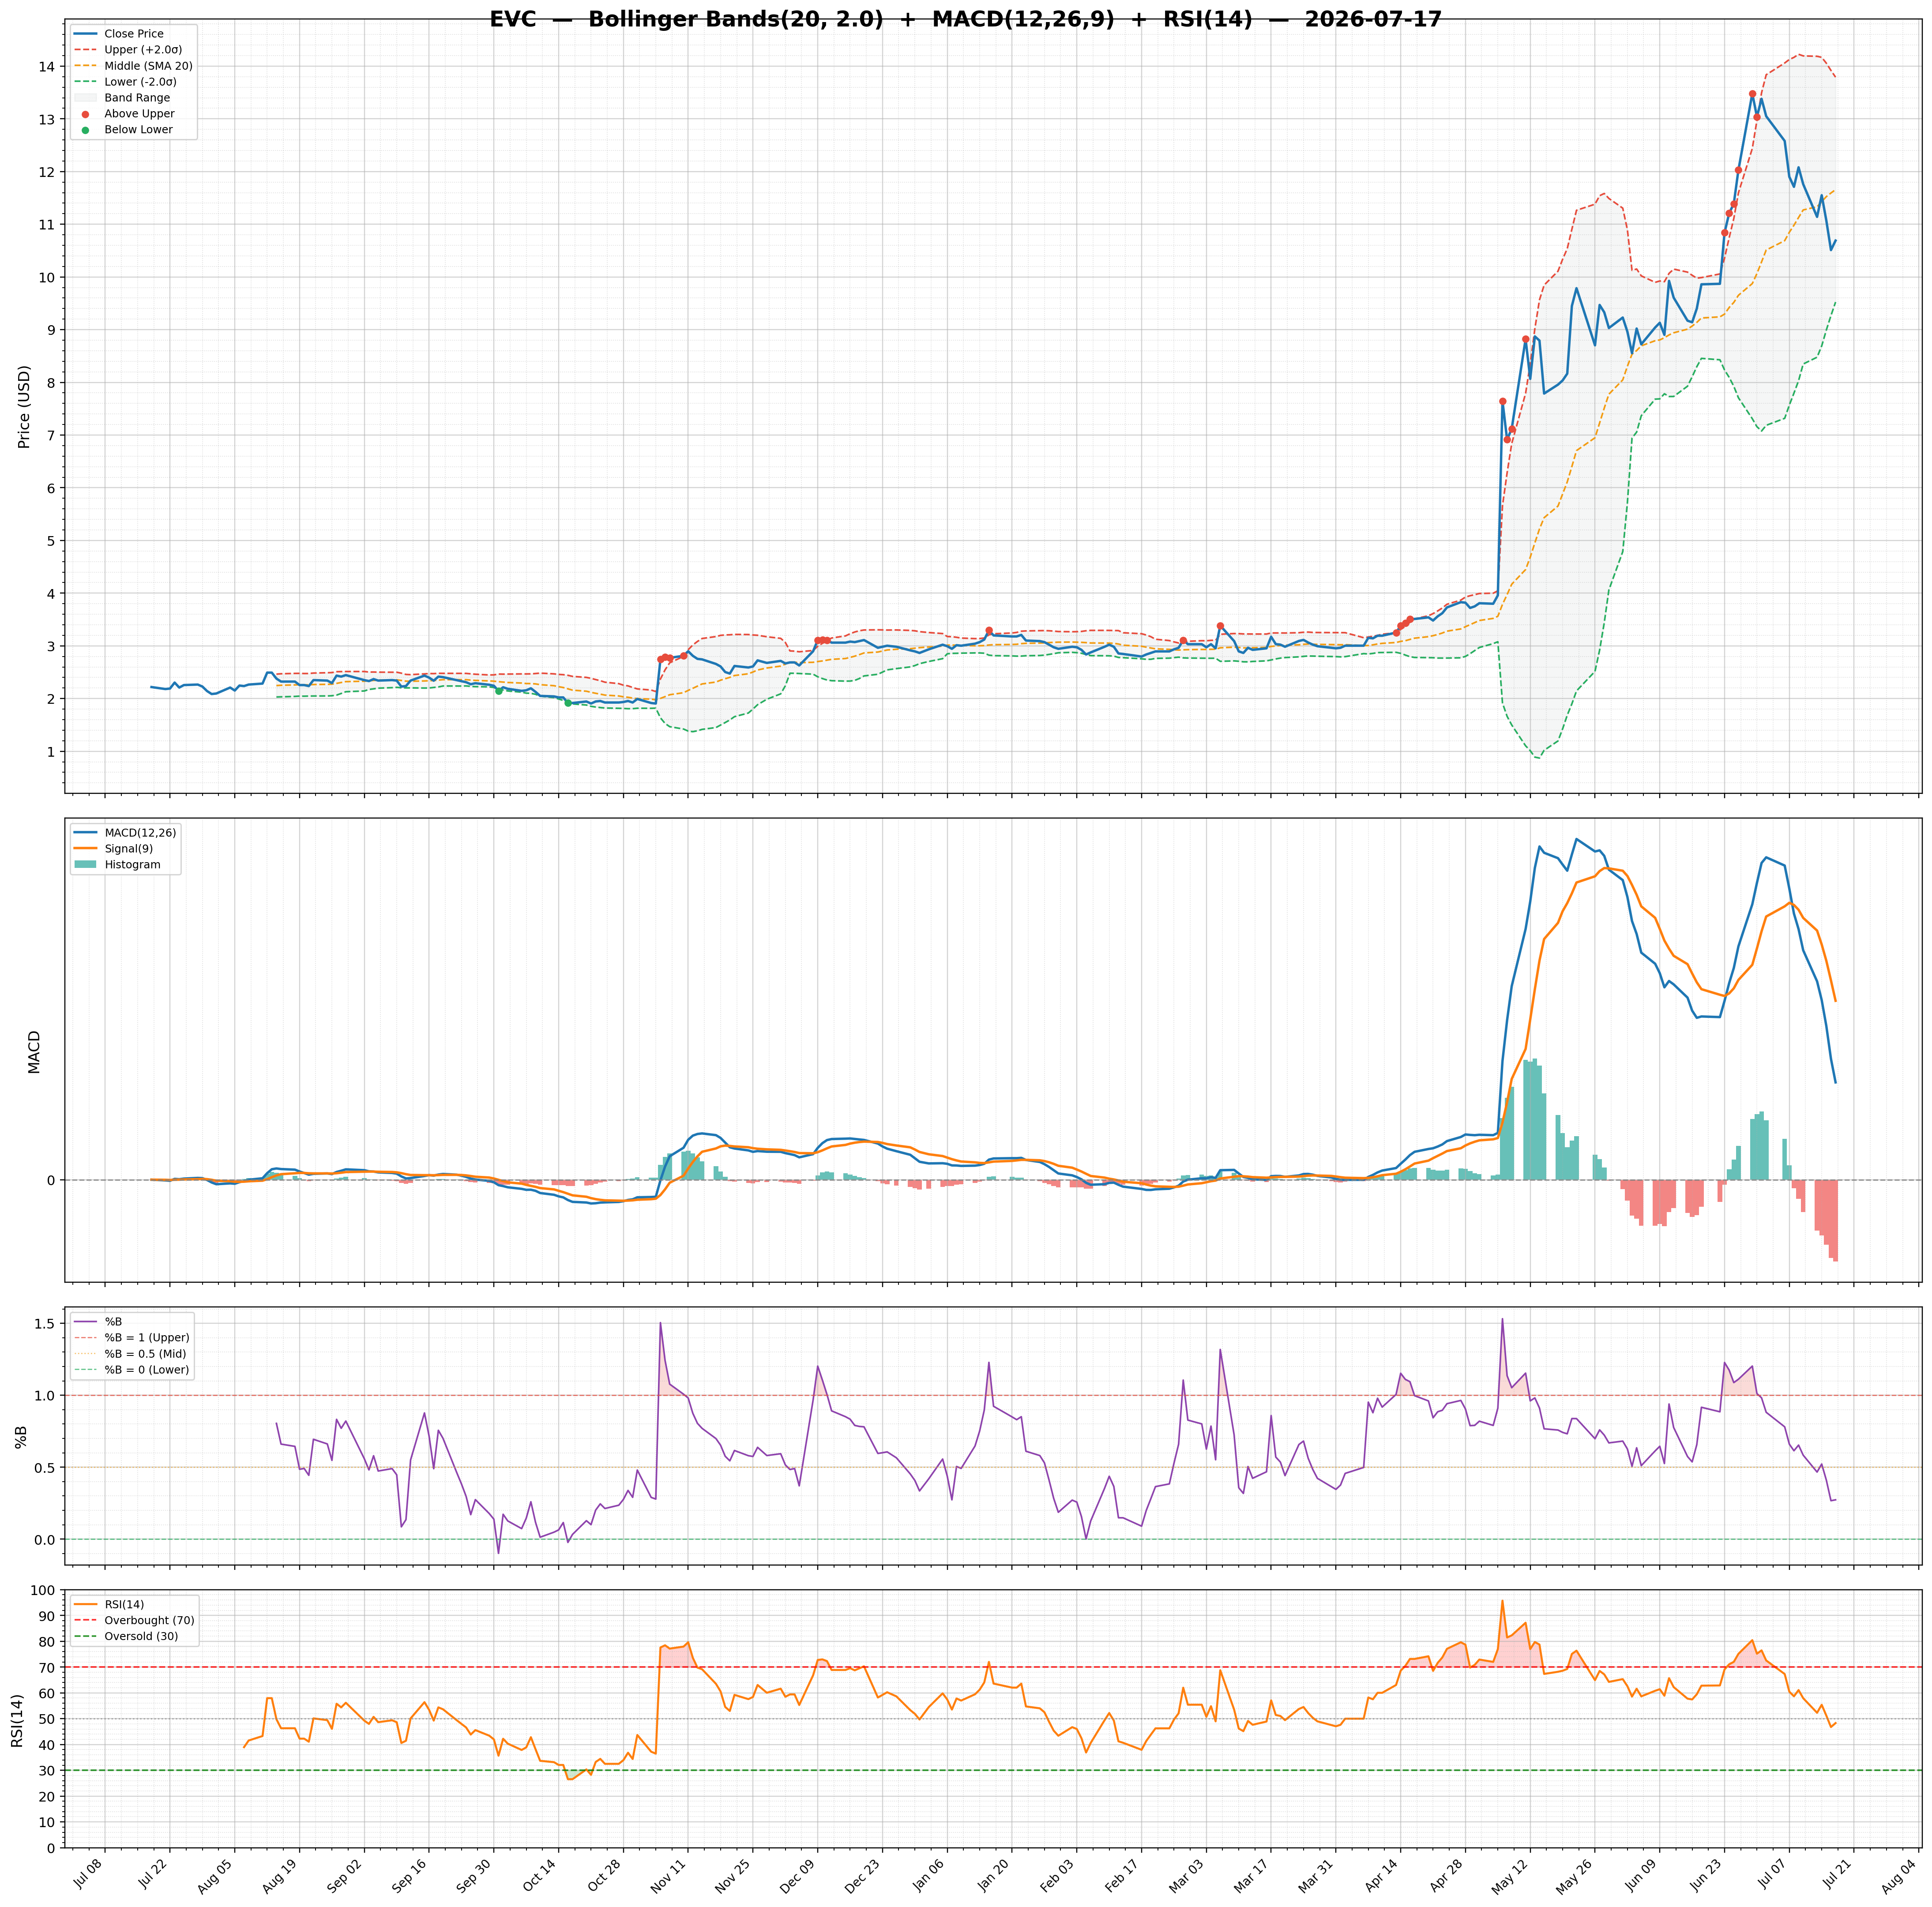
| 2026-07-17 | EVC | 10.69 | / | 75.89% | none | 1,077,128/1,991,061 | 36.61/0.27 | 48.31/-0.3400 | 2.94 | 0.41/0.75 | Chart 3M 🌐 |